i have real bad inSAR
S1B_IW_SLC__1SDV_20200808T173642_20200808T173712_022835_02B578_8F40
S1B_IW_SLC__1SDV_20200727T173641_20200727T173711_022660_02B028_25C7
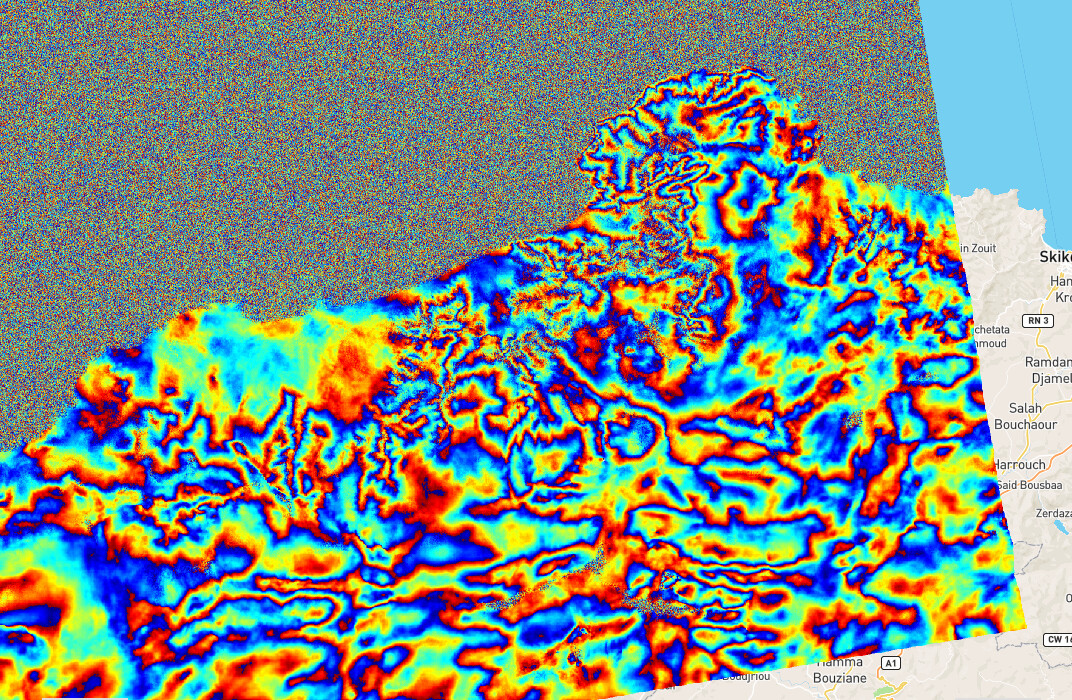
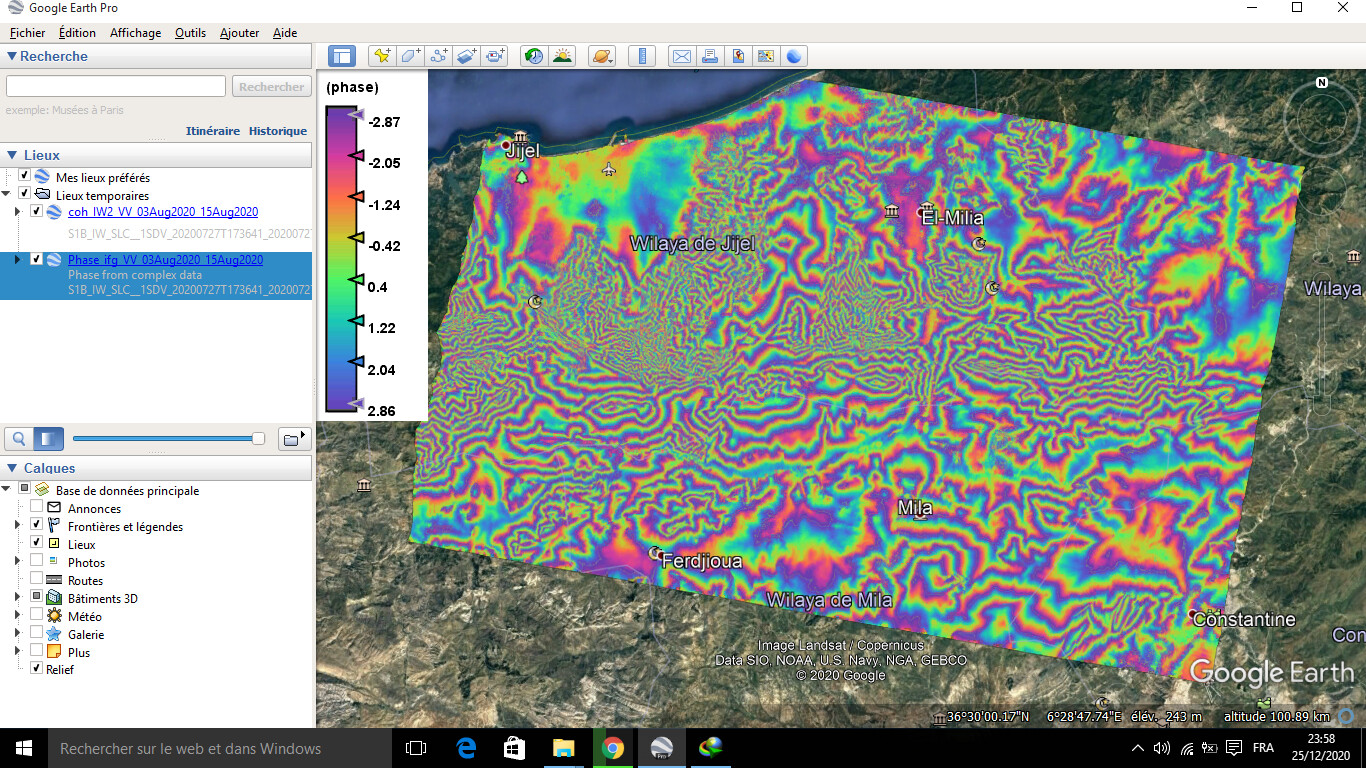
you can see the phase interferogam
i have real bad inSAR
S1B_IW_SLC__1SDV_20200808T173642_20200808T173712_022835_02B578_8F40
S1B_IW_SLC__1SDV_20200727T173641_20200727T173711_022660_02B028_25C7
you can see the phase interferogam
Sorry, but what is your question?
I created the interferogram using the DIAPASON service of the ESA G-TEP and get similar results
The fringe pattern probably consists of both topographic and atmospheric phase contributions. Many of them are reasonably caused by the underlying topography (the sharp ones) while others are more smudged and rather artifcats from atmospheric phase delay.
additionally, especially the areas near the coast suffer from low coherence which causes phase decorrelation over the forest areas
thank you sir
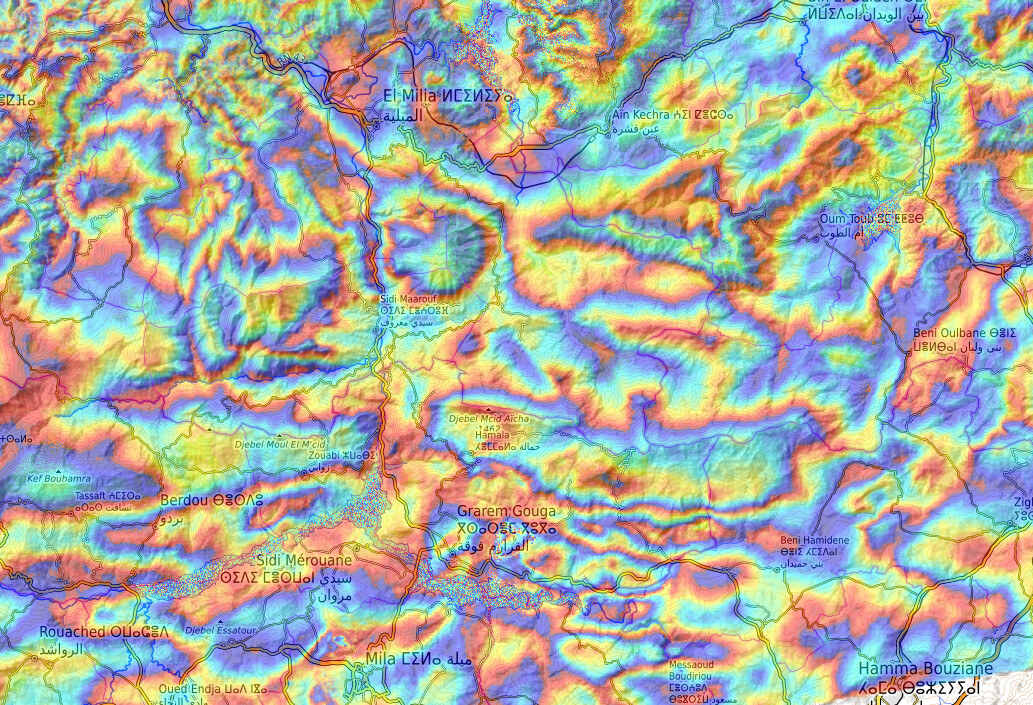
now i’m working on other product in the same area
S1A_IW_SLC__1SDV_20200803T053758_20200803T053825_033738_03E909_8EC8
S1A_IW_SLC__1SDV_20200815T053759_20200815T053826_033913_03EF0C_5E46
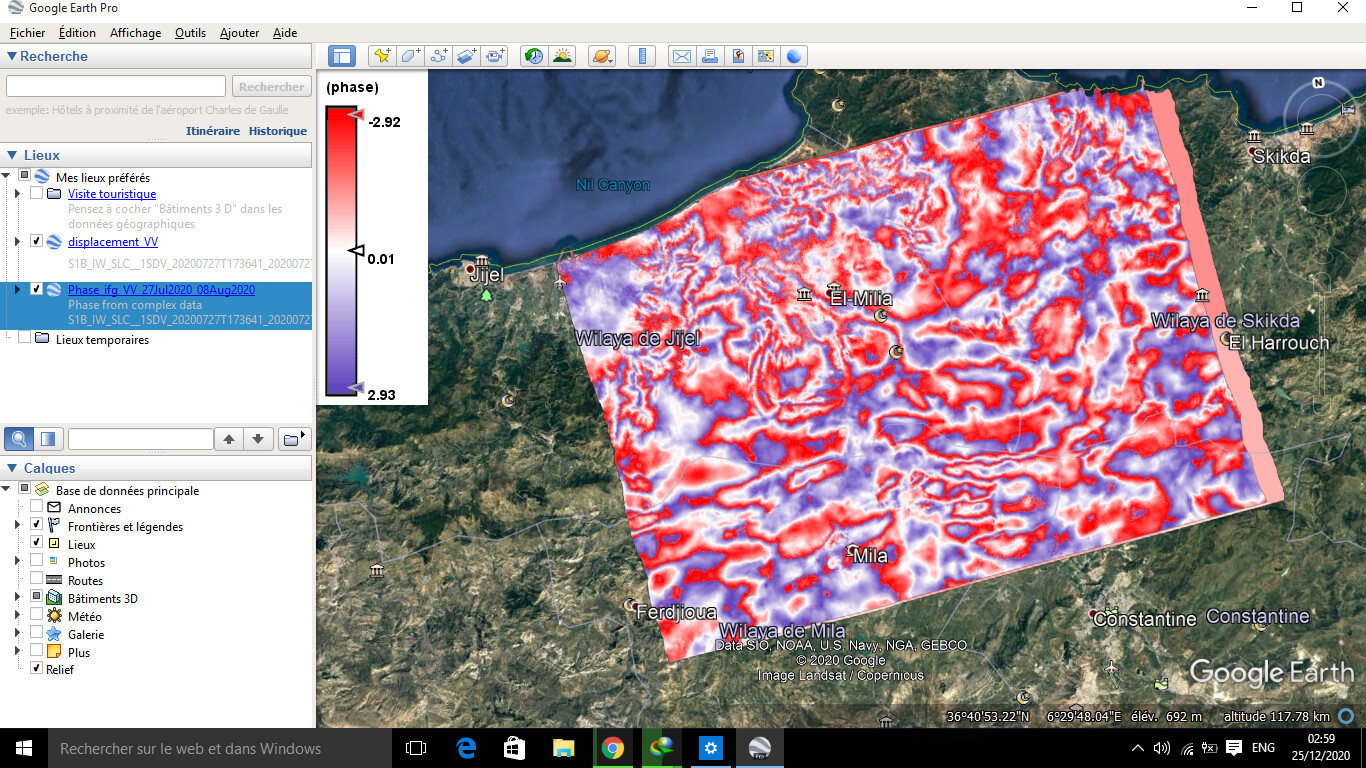
i get some result but i don’t know if correct or wrong
thanks forum thank you sir ABraun
looks much better! What is your aim with the data?
earthquake ,landslid and damage in the city “Mila Stat”
thanks sir
to be honest, that’s quite a challenging aim, especially within cities.
Mainly, because the urban area is small, and you search for different patterns.
Earthquakes cause large-scale fringe patterns around the epicentre, landslides are mostly non-coherent processes (depending on the size) and urban damage is hardly visible at this resolution.
In any way, I recommend to remove the topographic phase, because currently you observe phase contributions of atmosphere (here less than in the first result) topography and deformation. Accordingly, the deformation patterns are superimposed by the topographic phase in your inteferogram.
Maybe this tutorial helps you: Sentinel-1 TOPS interferometry
I recommend coherence-based approaches, such as here