Hello everyone,
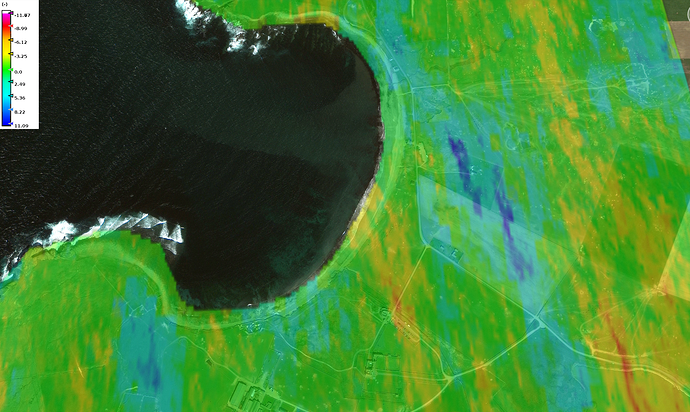
I have produced a displacement map along a coastal area (looking for detecting coastal erosion) in Scotland and try to understand if the displacement map make sense to me. It is estimated that this specific location undergoes an erosion of 4-6cm per year. Looking at the image below, we see some subsidence occurred along the coast (- sign) and also some uplift (+ sign). The color in blue that shows an uplift, I am trying to understand, does this uplift make sense along the coast? What might have caused this uplift? Can that be rocks movements or maybe ground water re-charge due to heavy rainfall?
One more thing, I have read a few posts and on-line tutorials about the + and - signs in the displacement map. According to my understanding, - sing denotes subsidence (away from satellite) and +sign denotes uplift (towards the satellite).
According to the website below, it sates the opposite. It confused me a bit
I would appreciate any help on this matter.
http://vldb.gsi.go.jp/sokuchi/sar/mechanism/interpretation-e.html
Thank you
Ioannis
