Good day! I am processing Interferometry into different active volcanoes in the Philippines such as Mt. Mayon, Mt. Canlaon, etc, for a better understanding of the current activities of these volcanoes. I already arrived at its final results such as the wrapped and unwrapped phases of InSAR images but am having trouble in interpreting the results. I already read different articles for the interpretation of these images but still I’m not confident with regard to my interpretation. Can someone supplement me with simple-to-comprehend interpretation of Interferometry? Especially interpreting its fringes and the values of wrapped and unwrapped phases.
By the way, the interpretation that I will be soon presenting is crucial for the safety of many people here in my country that is why I am trying so hard to exhaust all the knowledge that I can gain to better understand this method. So logical advice/help is highly appreciated. Thank you!
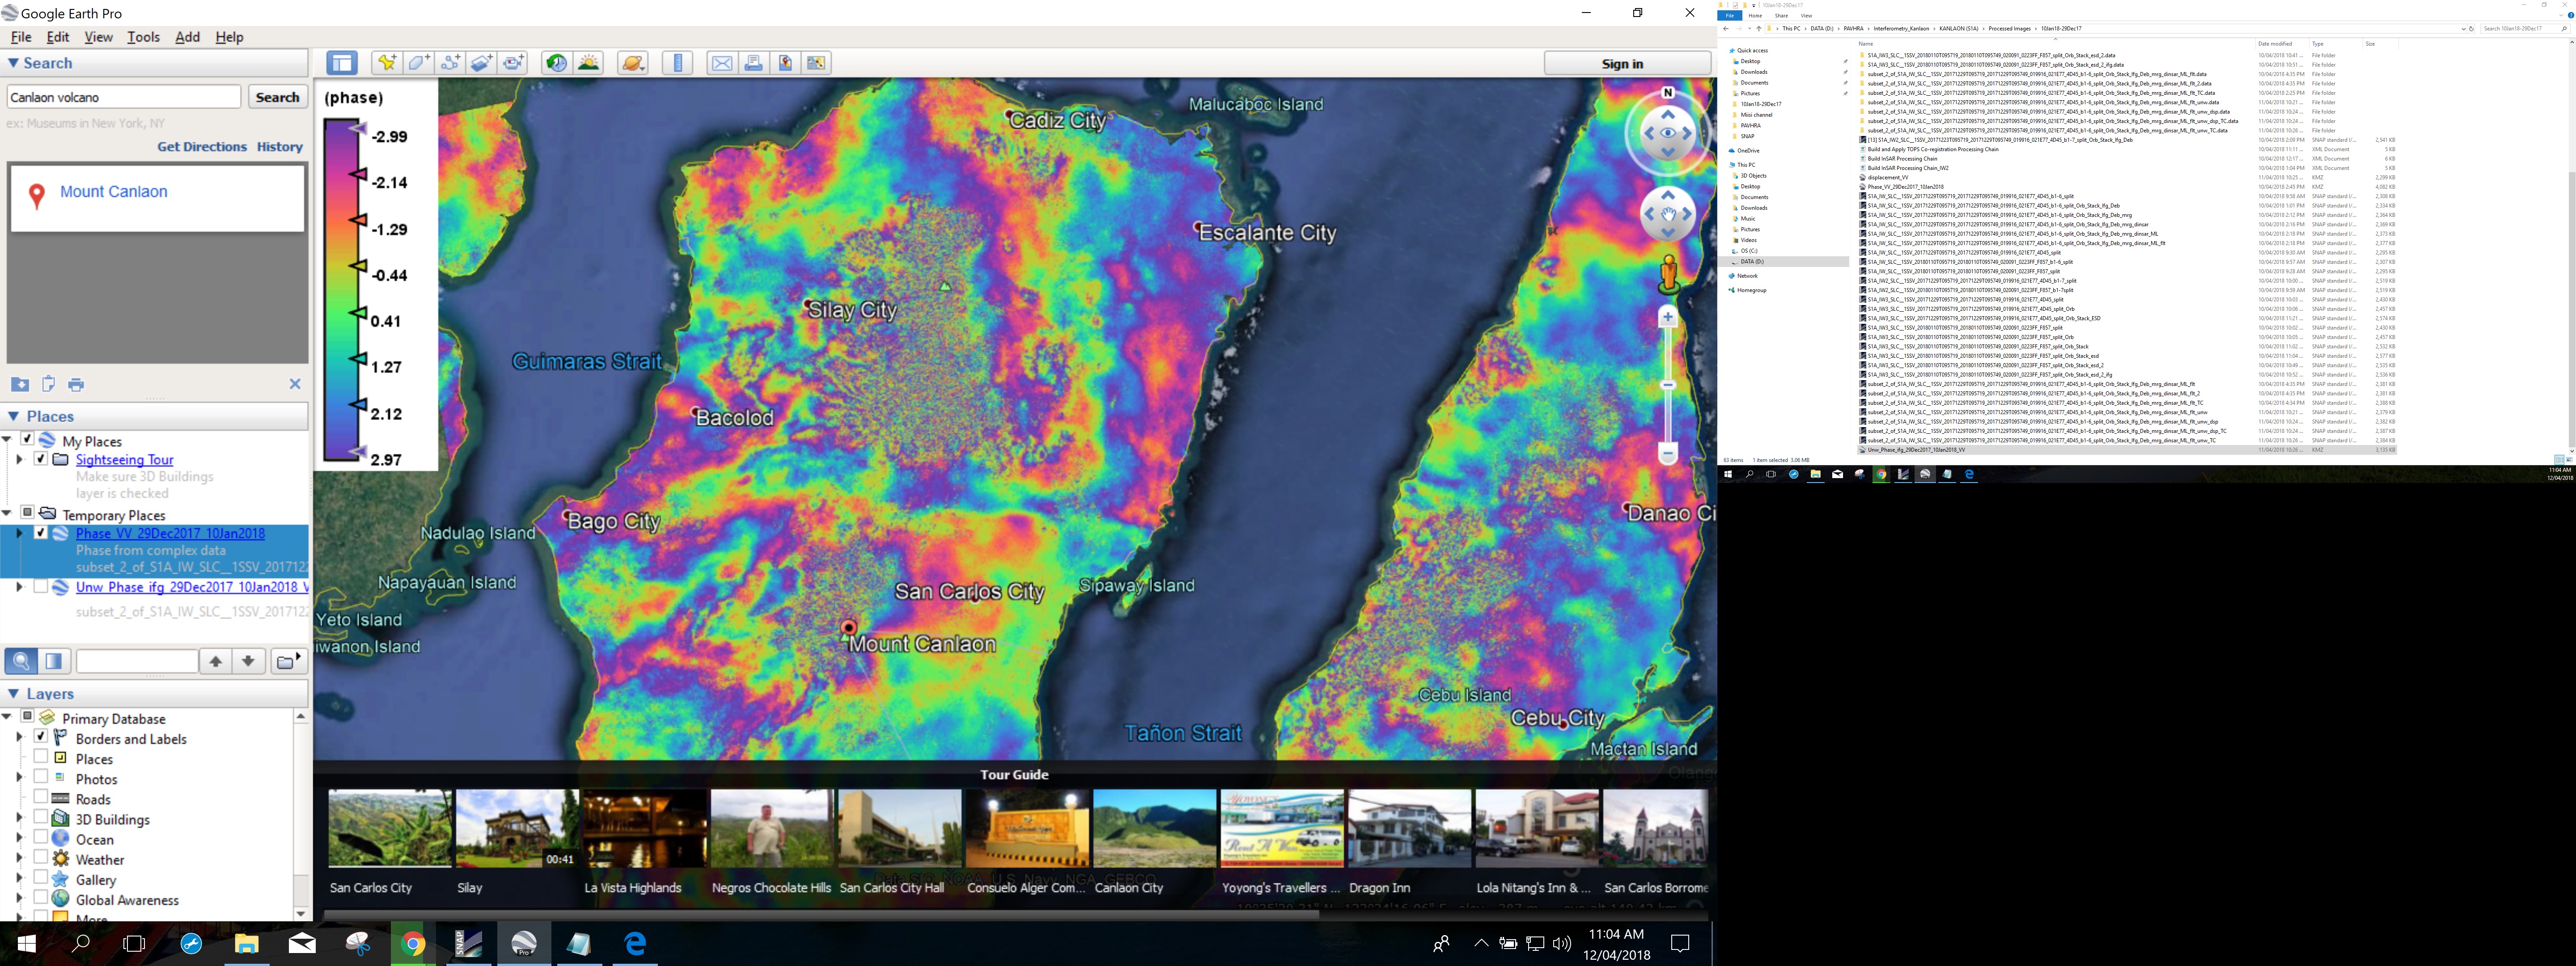
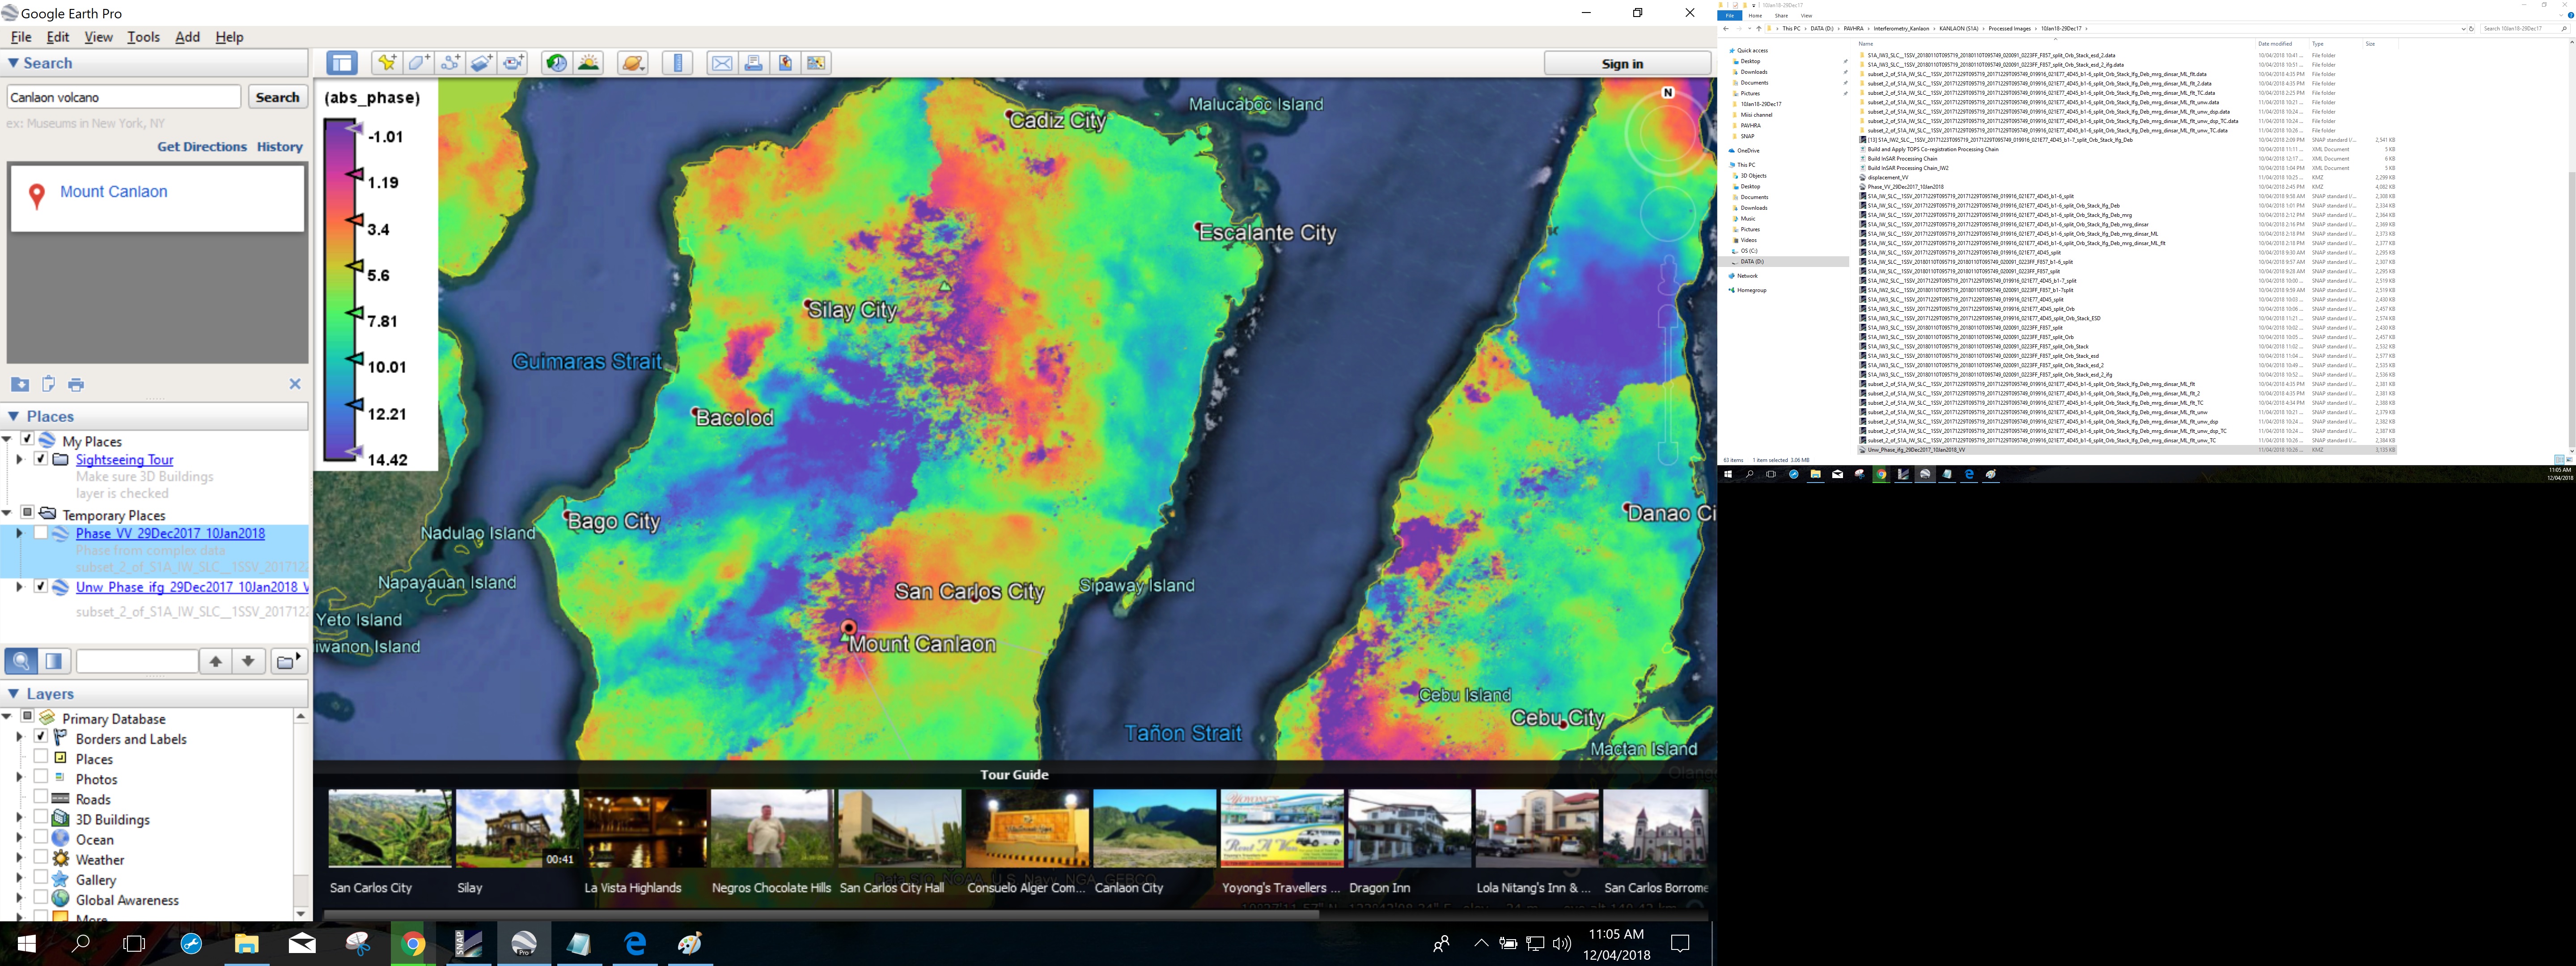
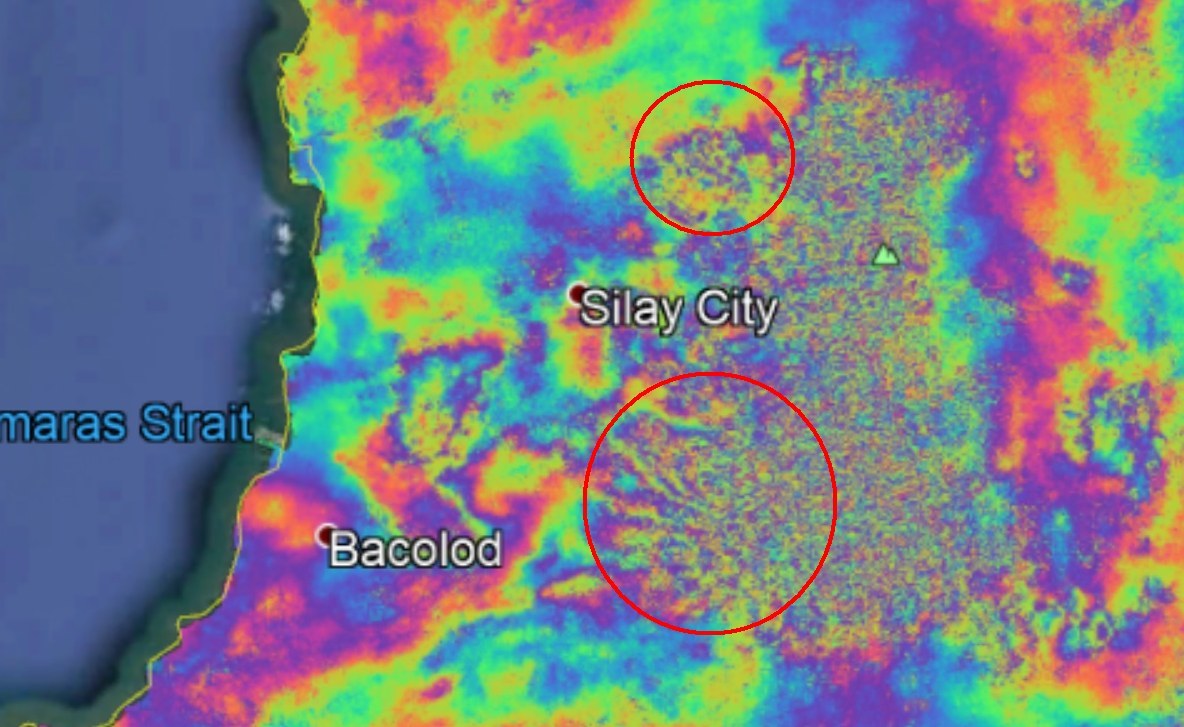
Thank you @qglaude for your response. Btw, the images I attached here is the screen captured of my wrapped and unwrapped InSAR images of Mt. Canlaon, Philippines. Can I have valuable insights on how to properly interpret these results? I would just like to hear comments from other people to validate my interpretation. Thank you!
You probably read that when you compute the interferometric phase from the master and slave images, this phase is a combination of different factors. Mains are an orbital phase (removed by default in Interferogram Formation), topographic phase (that you can now optionally remove in Interferogram Formation too) and finally the displacement phase.
In your case, you did not tell us if you removed topography or not, which is crucial when interpreting results.
If your goal is to monitor volcanoes, my guess is that you want to do differential interferometry (meaning that you remove the topographic component of the interferometric phase) so you can study the surface movement of your area of interest.
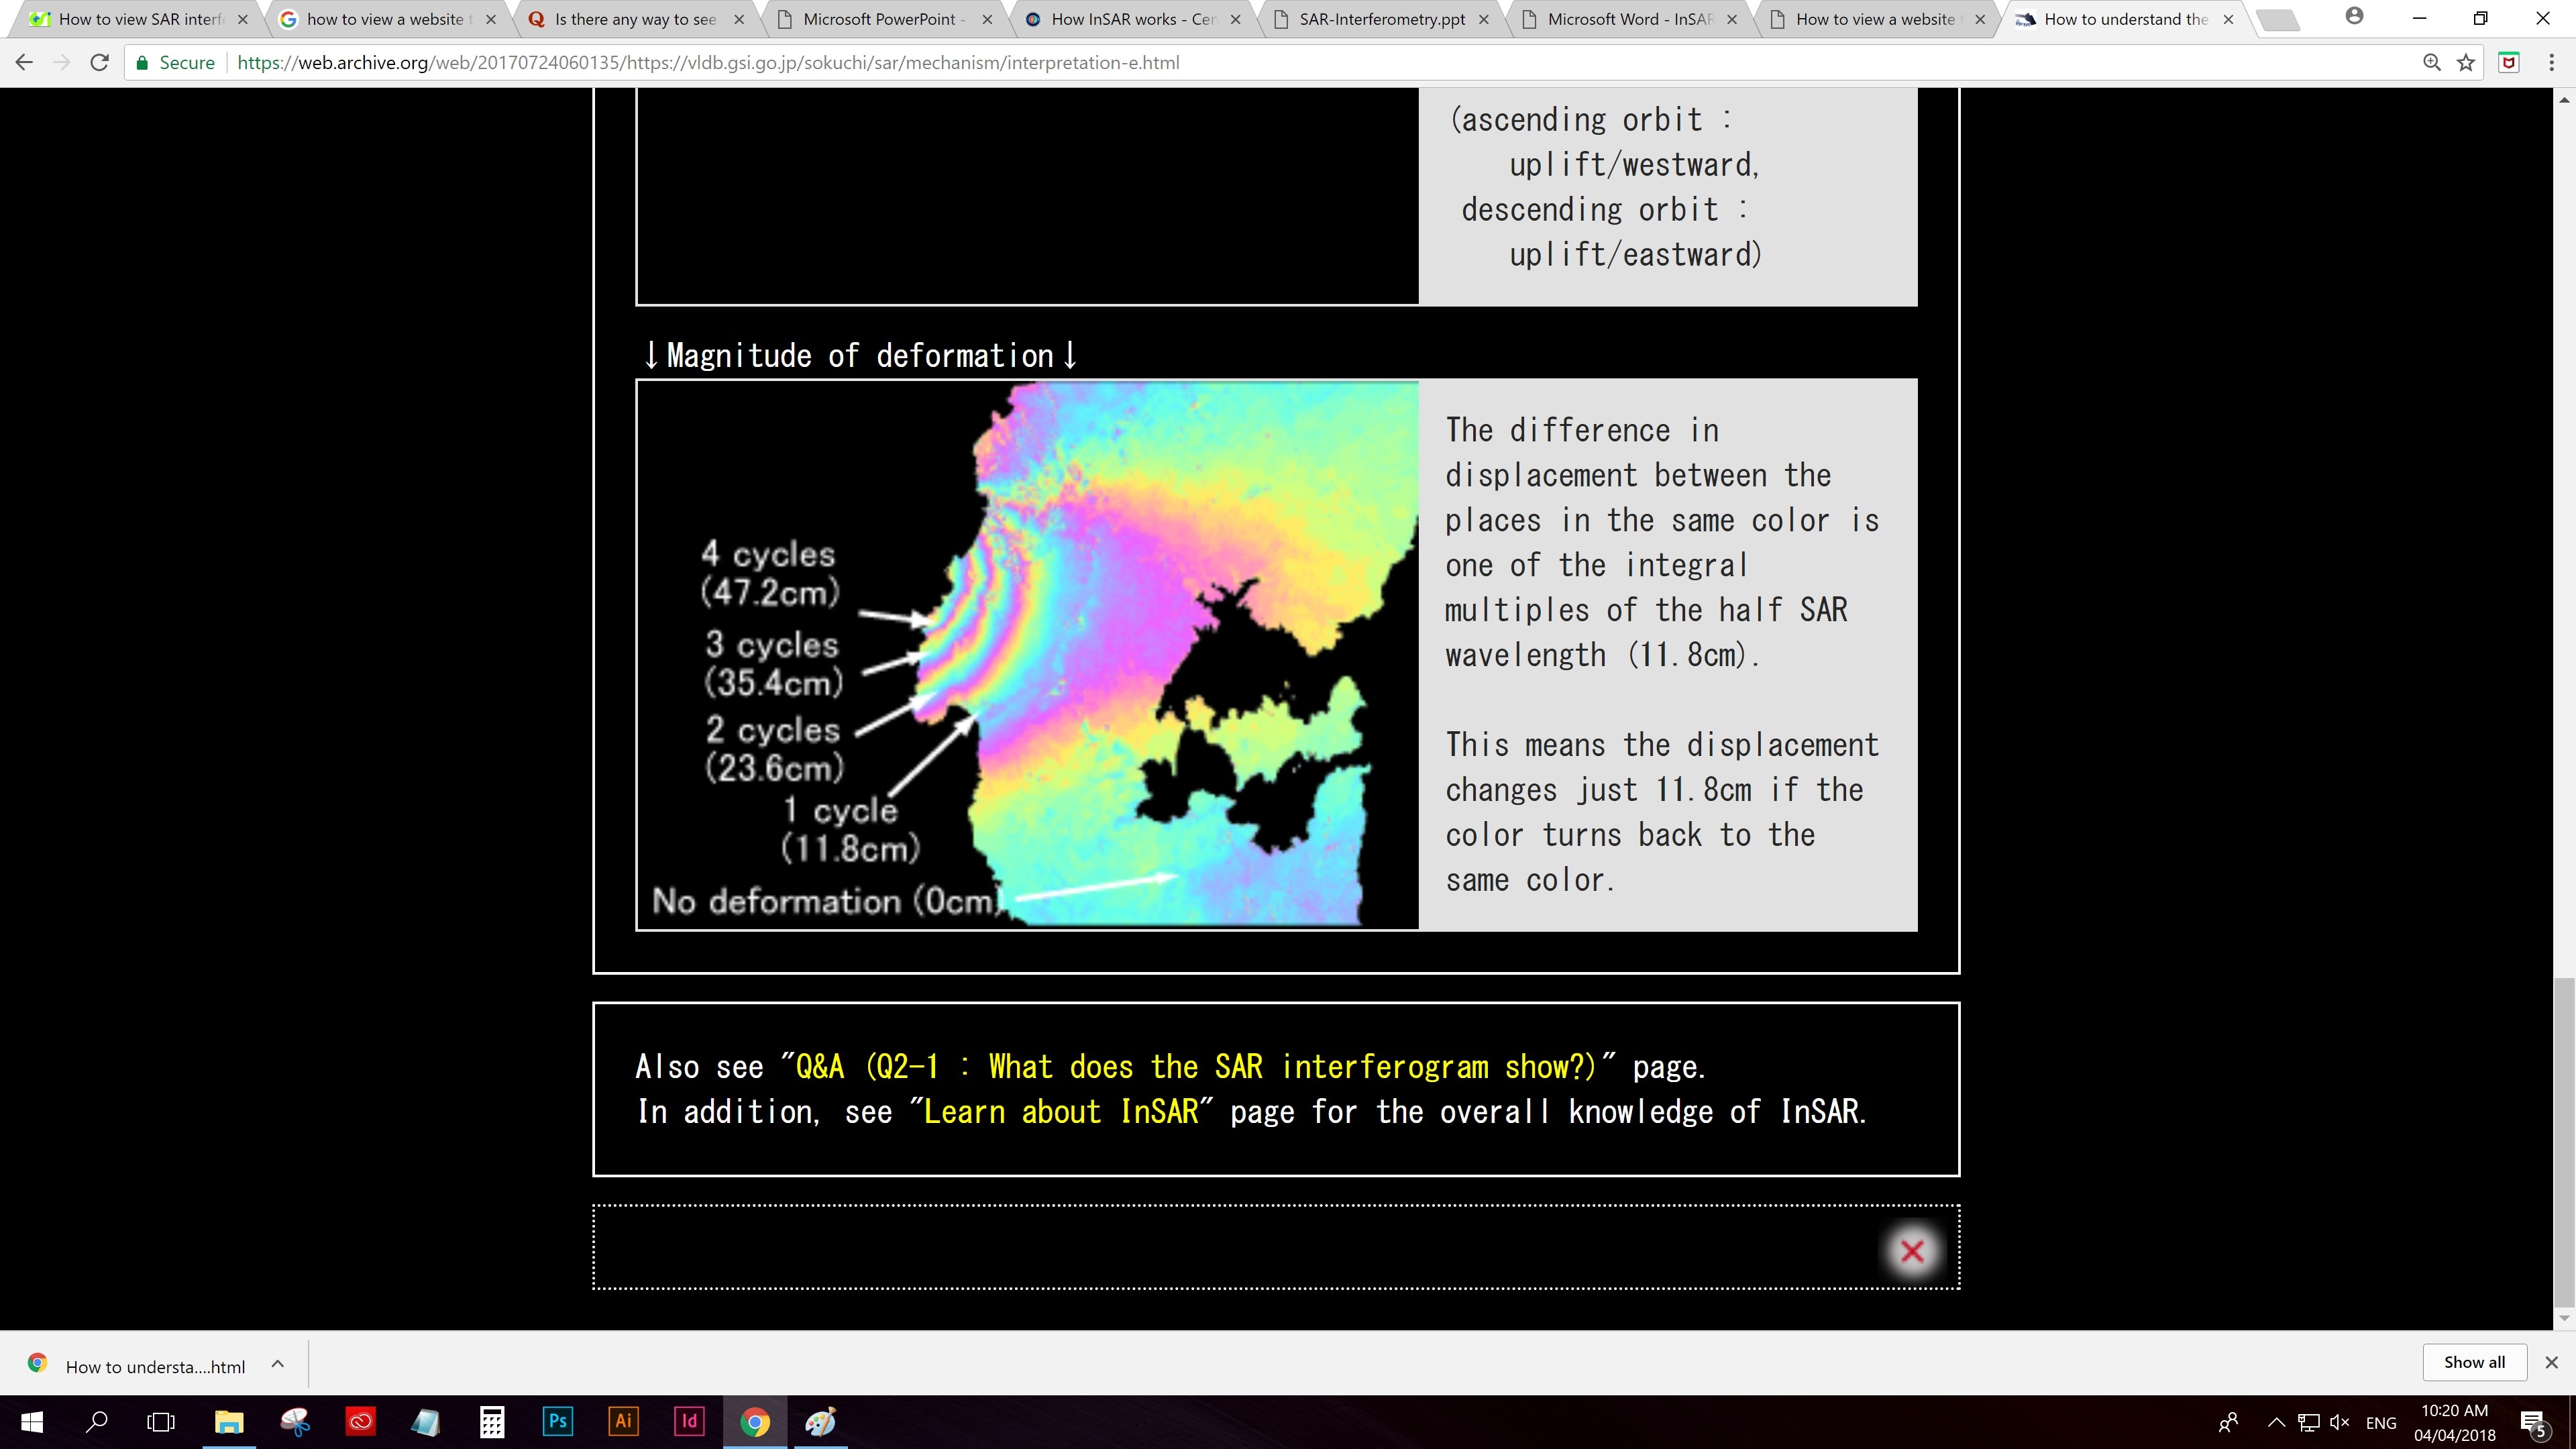
It can be shown that the displacement phase can be translated into a metric displacement in the line-of-sight direction by the relation
Where d is the displacement in cm if you write the wavelength in cm.
You noticed that I used the qualitative line-of-sight where talking about the displacement. It’s important to recall that you only measures the displacement in one direction. You can project this displacement from slant-range to ground-range for a better geophysical interpretation.
@qglaude, thank you for your response and yes you are right. I removed the topographic phase in my project since I am doing DInSAR (Differential Interferometry) to monitor volcanoes. With that, how can I interpret my results pasted in my previous reply?
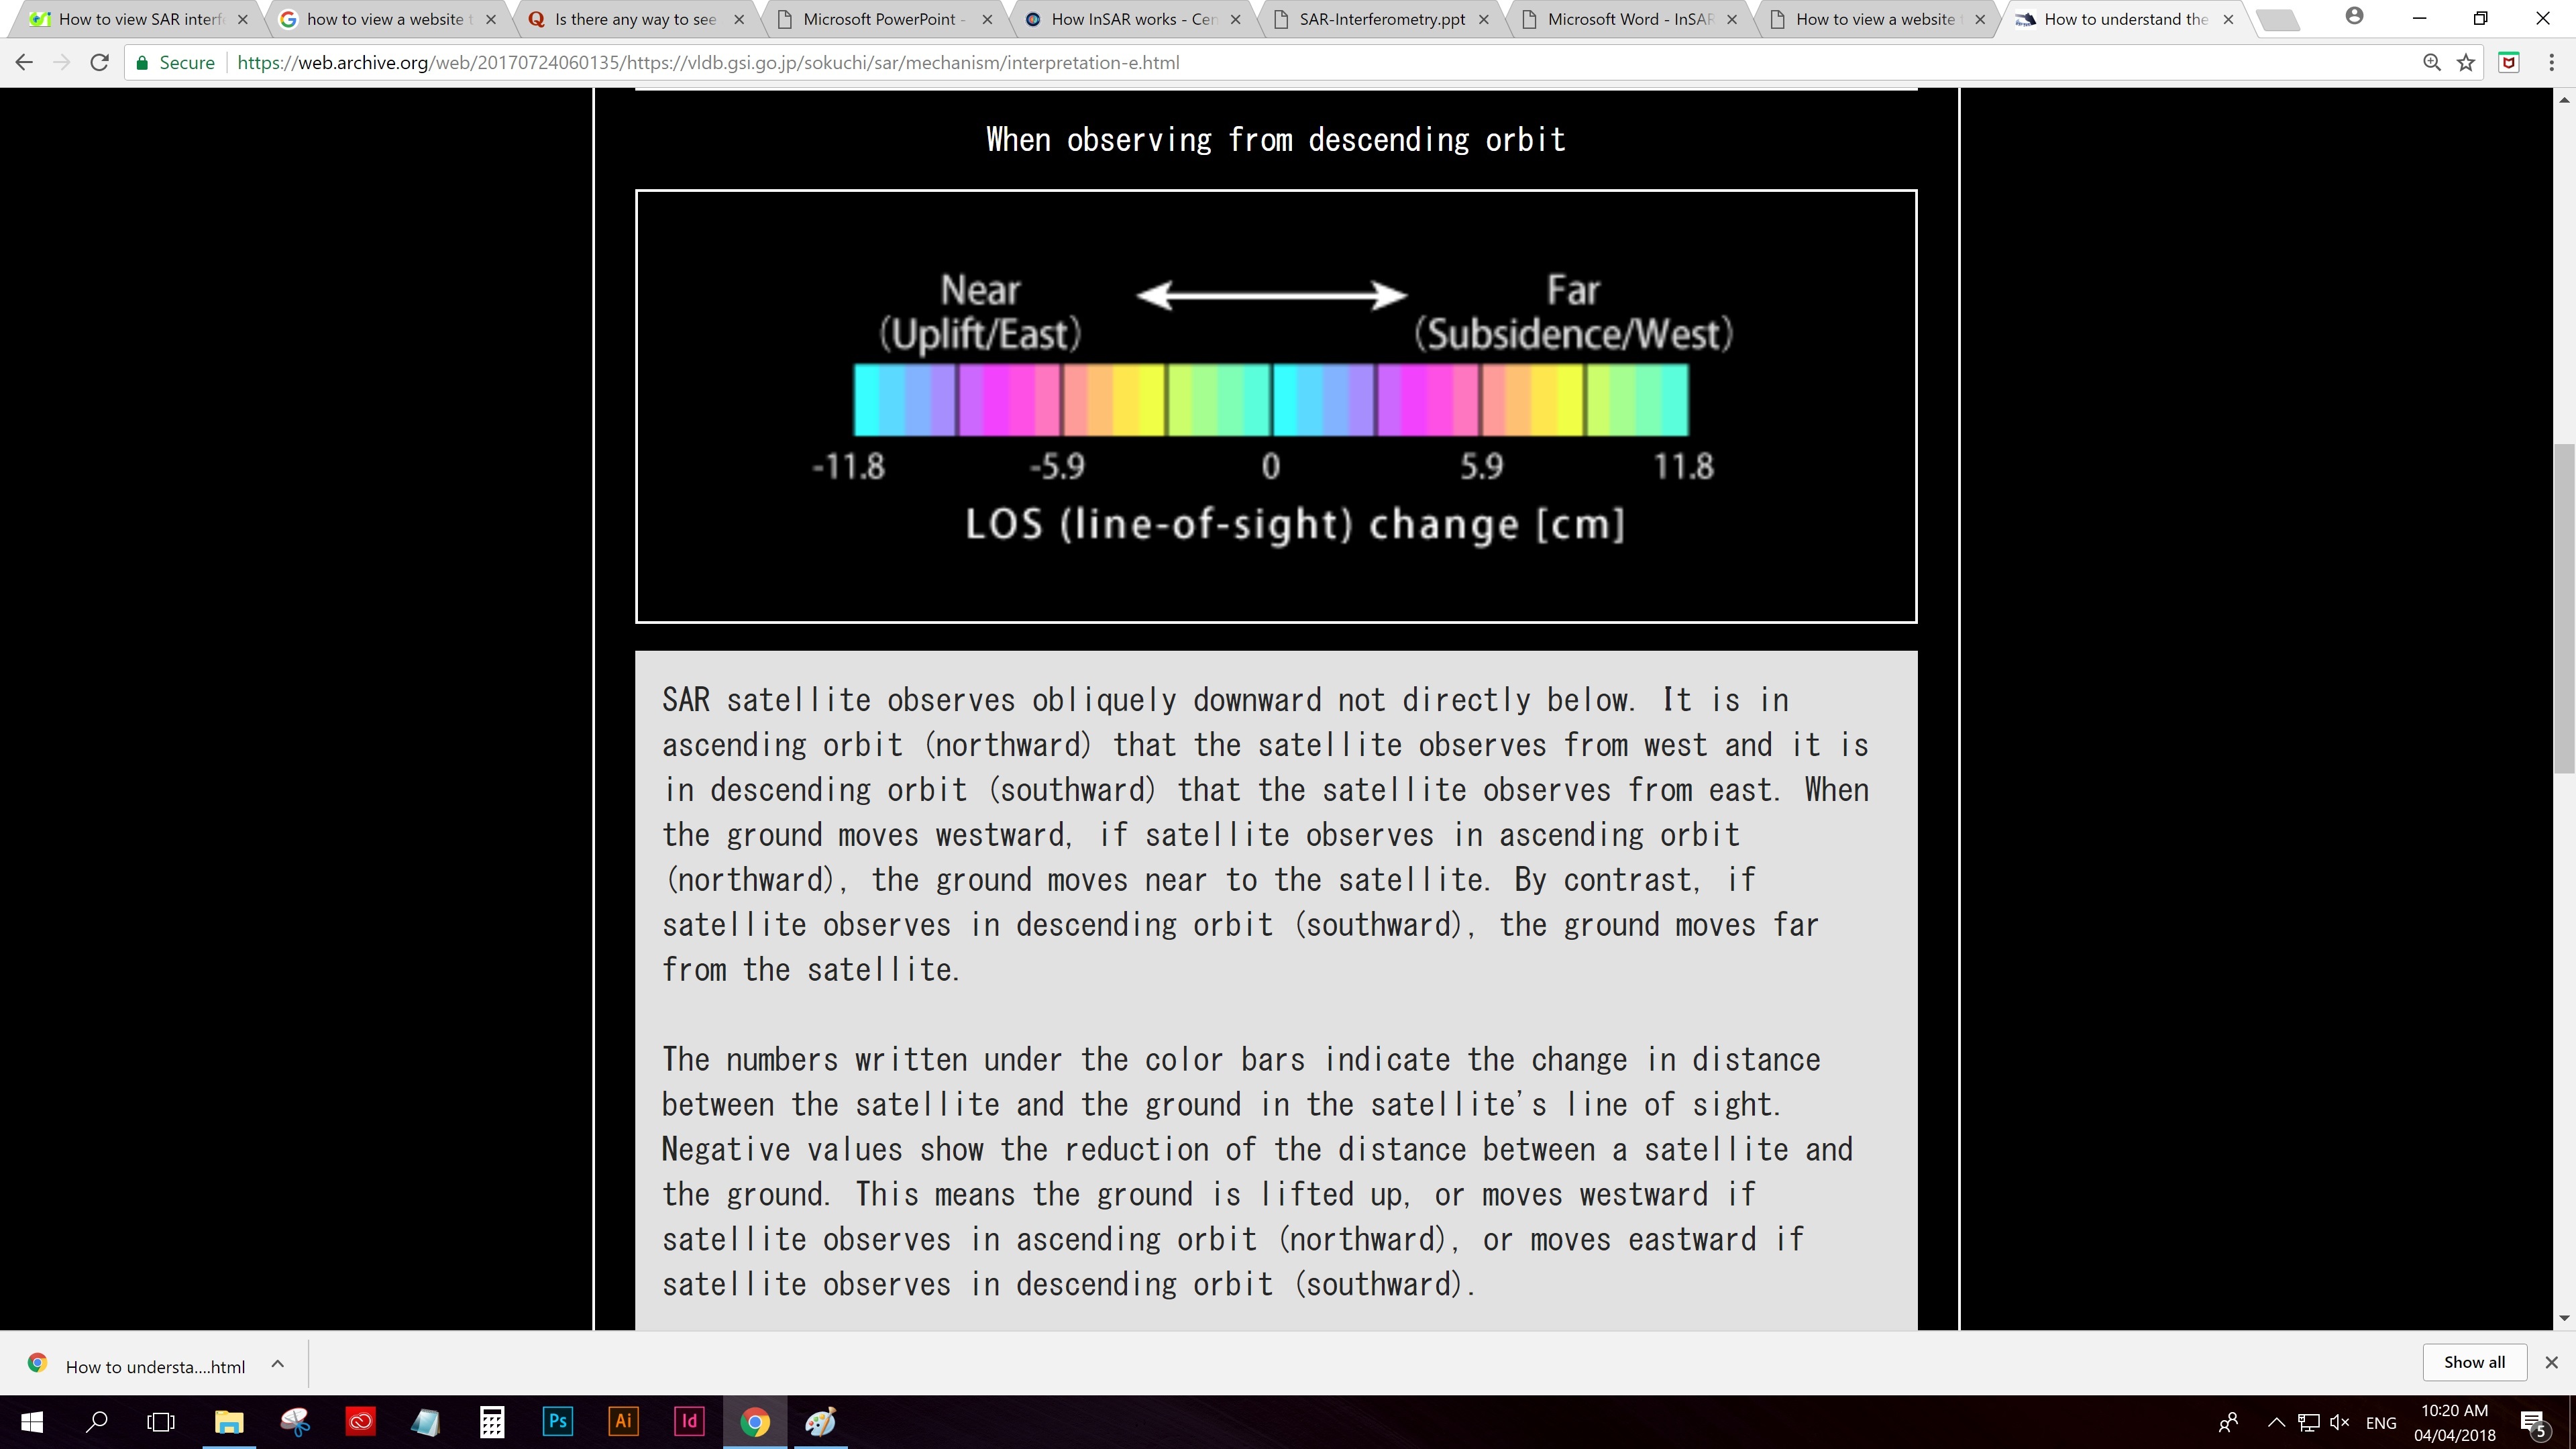
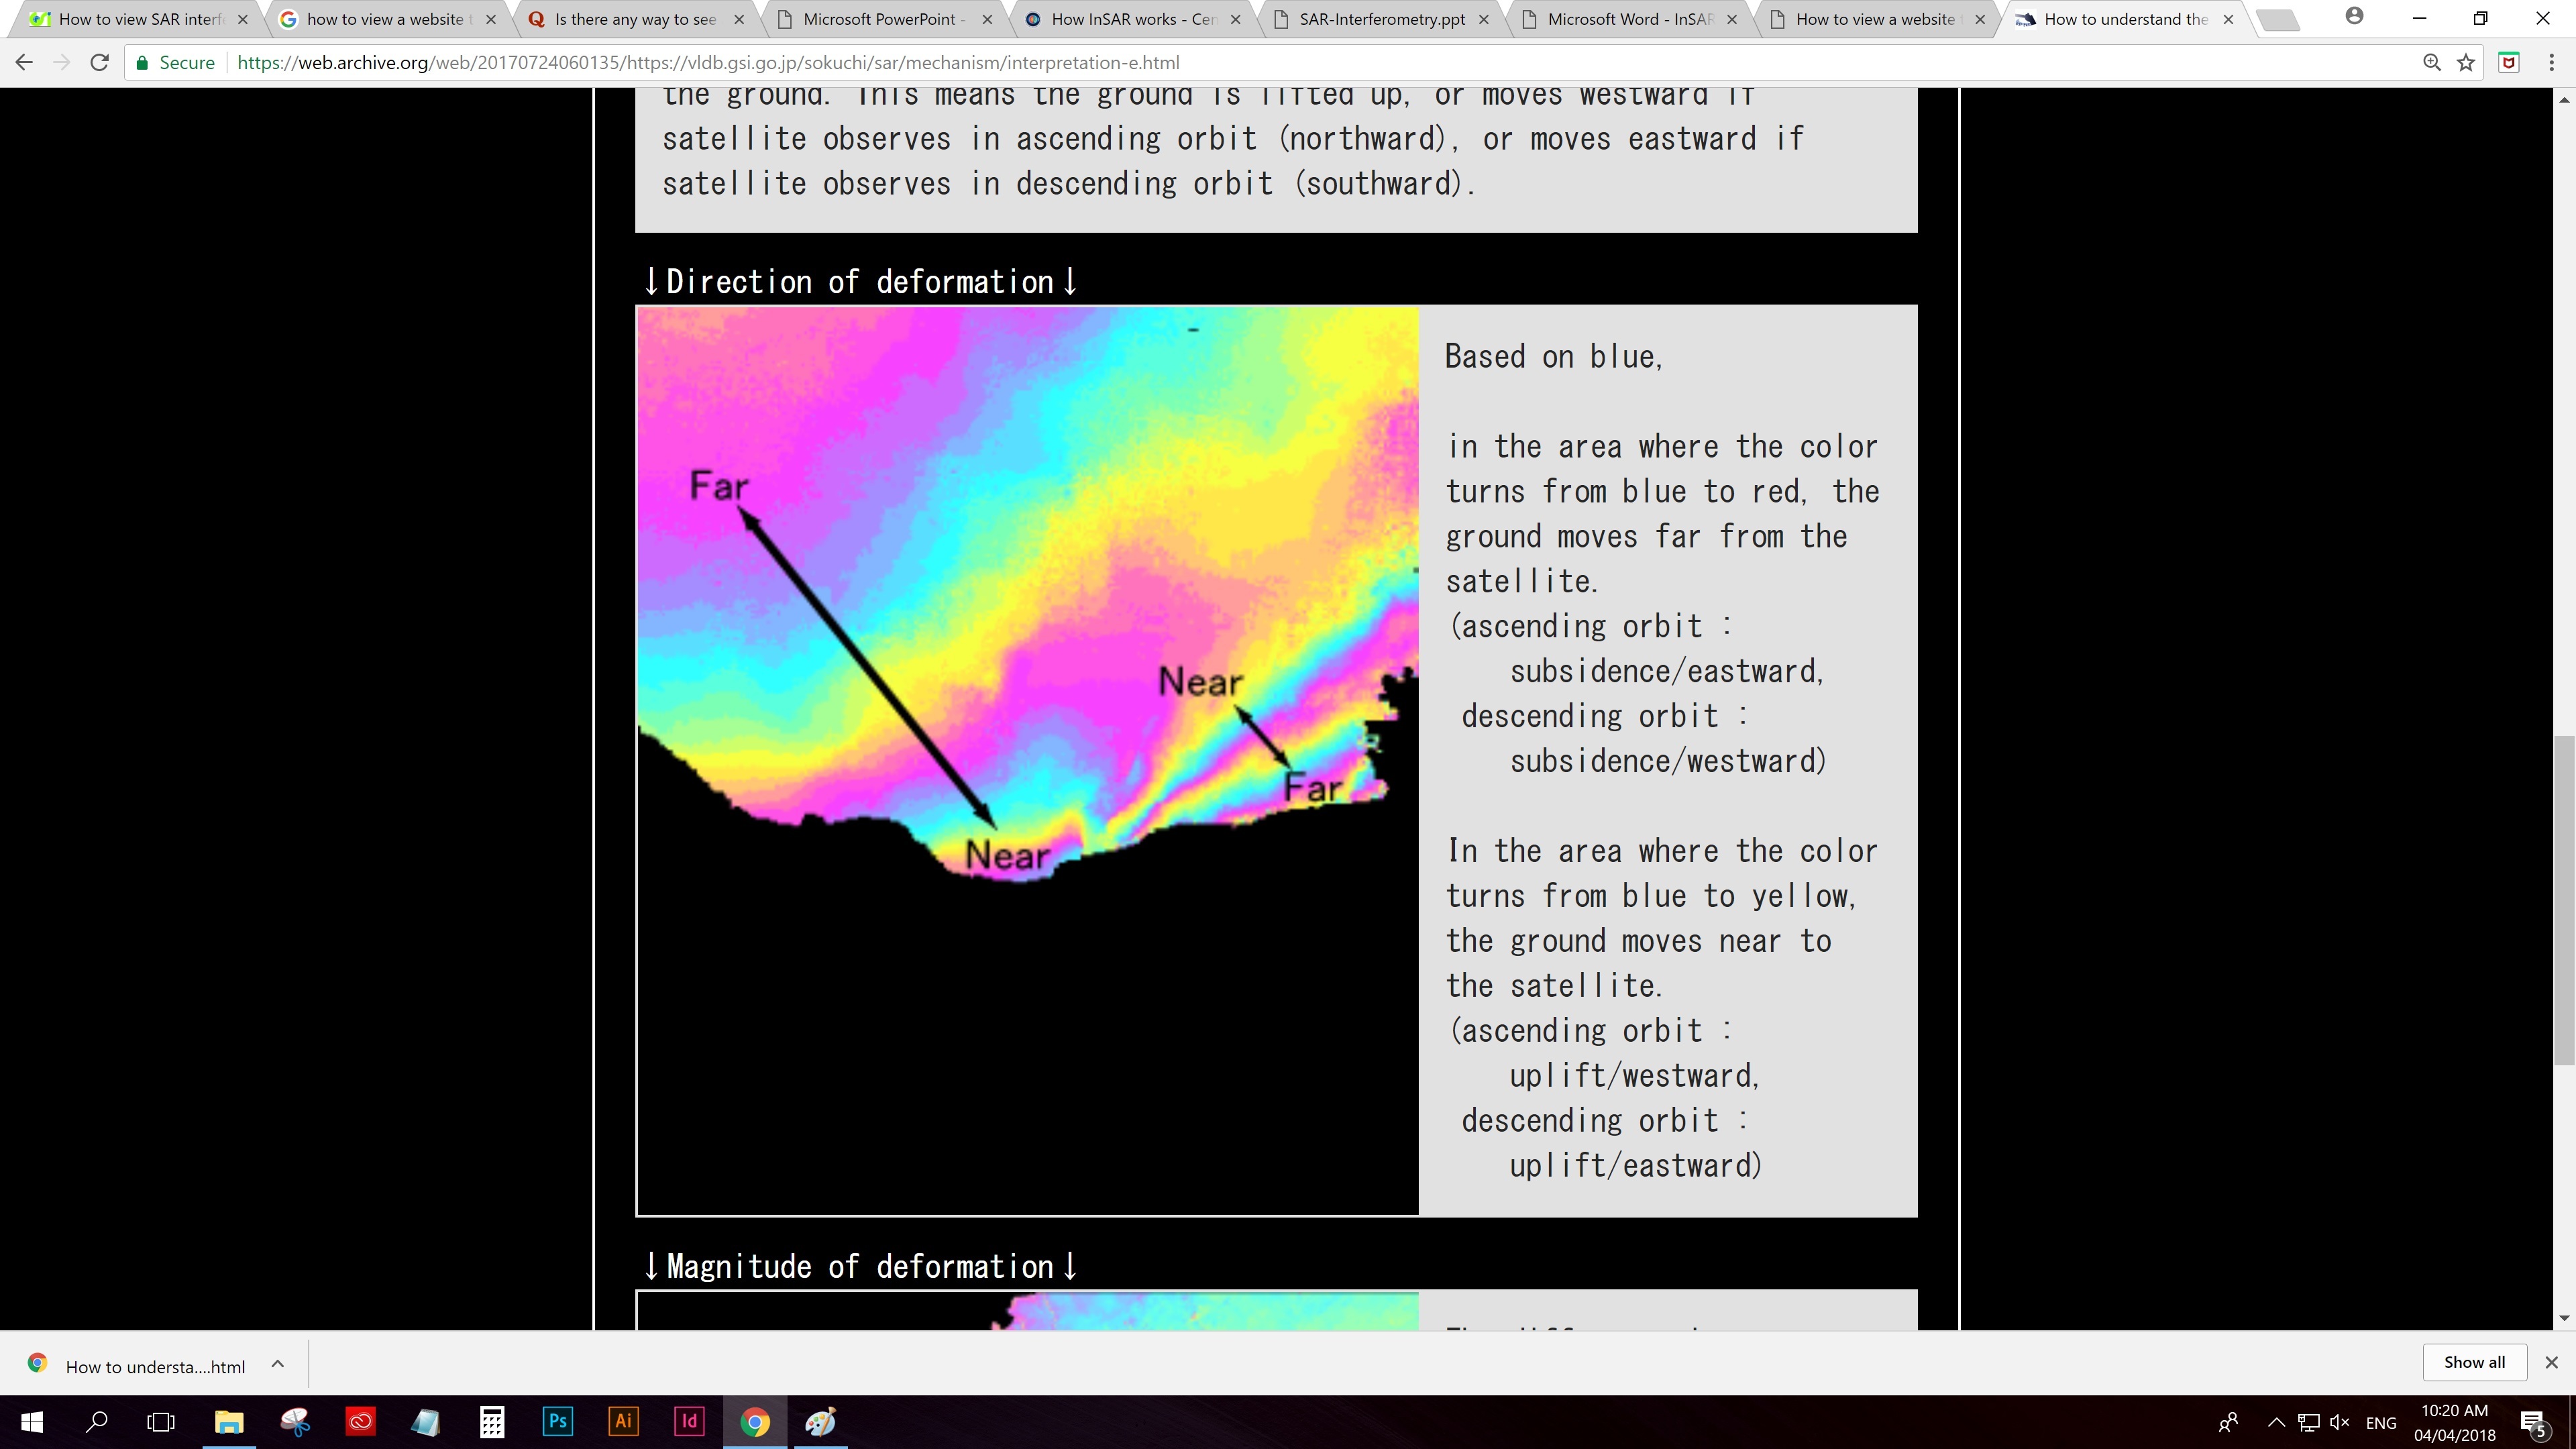
My knowledge about interpreting these results are only based with the following images:
When you say “You can project this displacement from slant-range to ground-range for a better geophysical interpretation.” How can I project my screen grabbed image from slant- to ground-range? Can you still elaborate?
I am really sorry if I have lots of question/clarification. Thank you so much!
Yes you were right, but the area of my interest is on the southern most part of the image which is Mt. Canlaon and fringes there are still not visible.
I am adding to this discussion late, but I think it is important that you consider the likely strong influence of the water vapor variations in the atmosphere affecting the InSAR measurements. This is the biggest source of errors, especially in tropical areas like the Philippines. I would not trust any apparent deformation signal that you see only in one interferogram as it could easily be atmosphere in one of the two SAR acquisitions.