Hi all,
With the release of SNAP 9 we can now perform ionospheric correction which is especially useful to prevent phase ramps for L-band SAR data such as ALOS.
During the typical InSAR workflow where do we apply ionosphere correction?
Hi all,
With the release of SNAP 9 we can now perform ionospheric correction which is especially useful to prevent phase ramps for L-band SAR data such as ALOS.
During the typical InSAR workflow where do we apply ionosphere correction?
InSAR Time Series Analysis of L-Band Wide-Swath SAR Data Acquired by ALOS-2
I hope the foregoing is clear and unveiled your query!
So we perform the ionospheric correction after SNAPHU import?
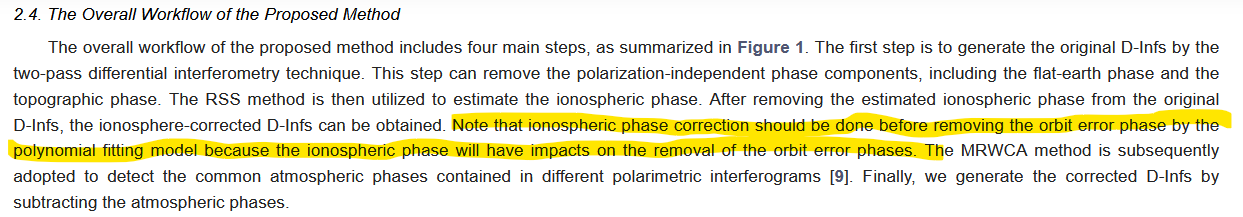
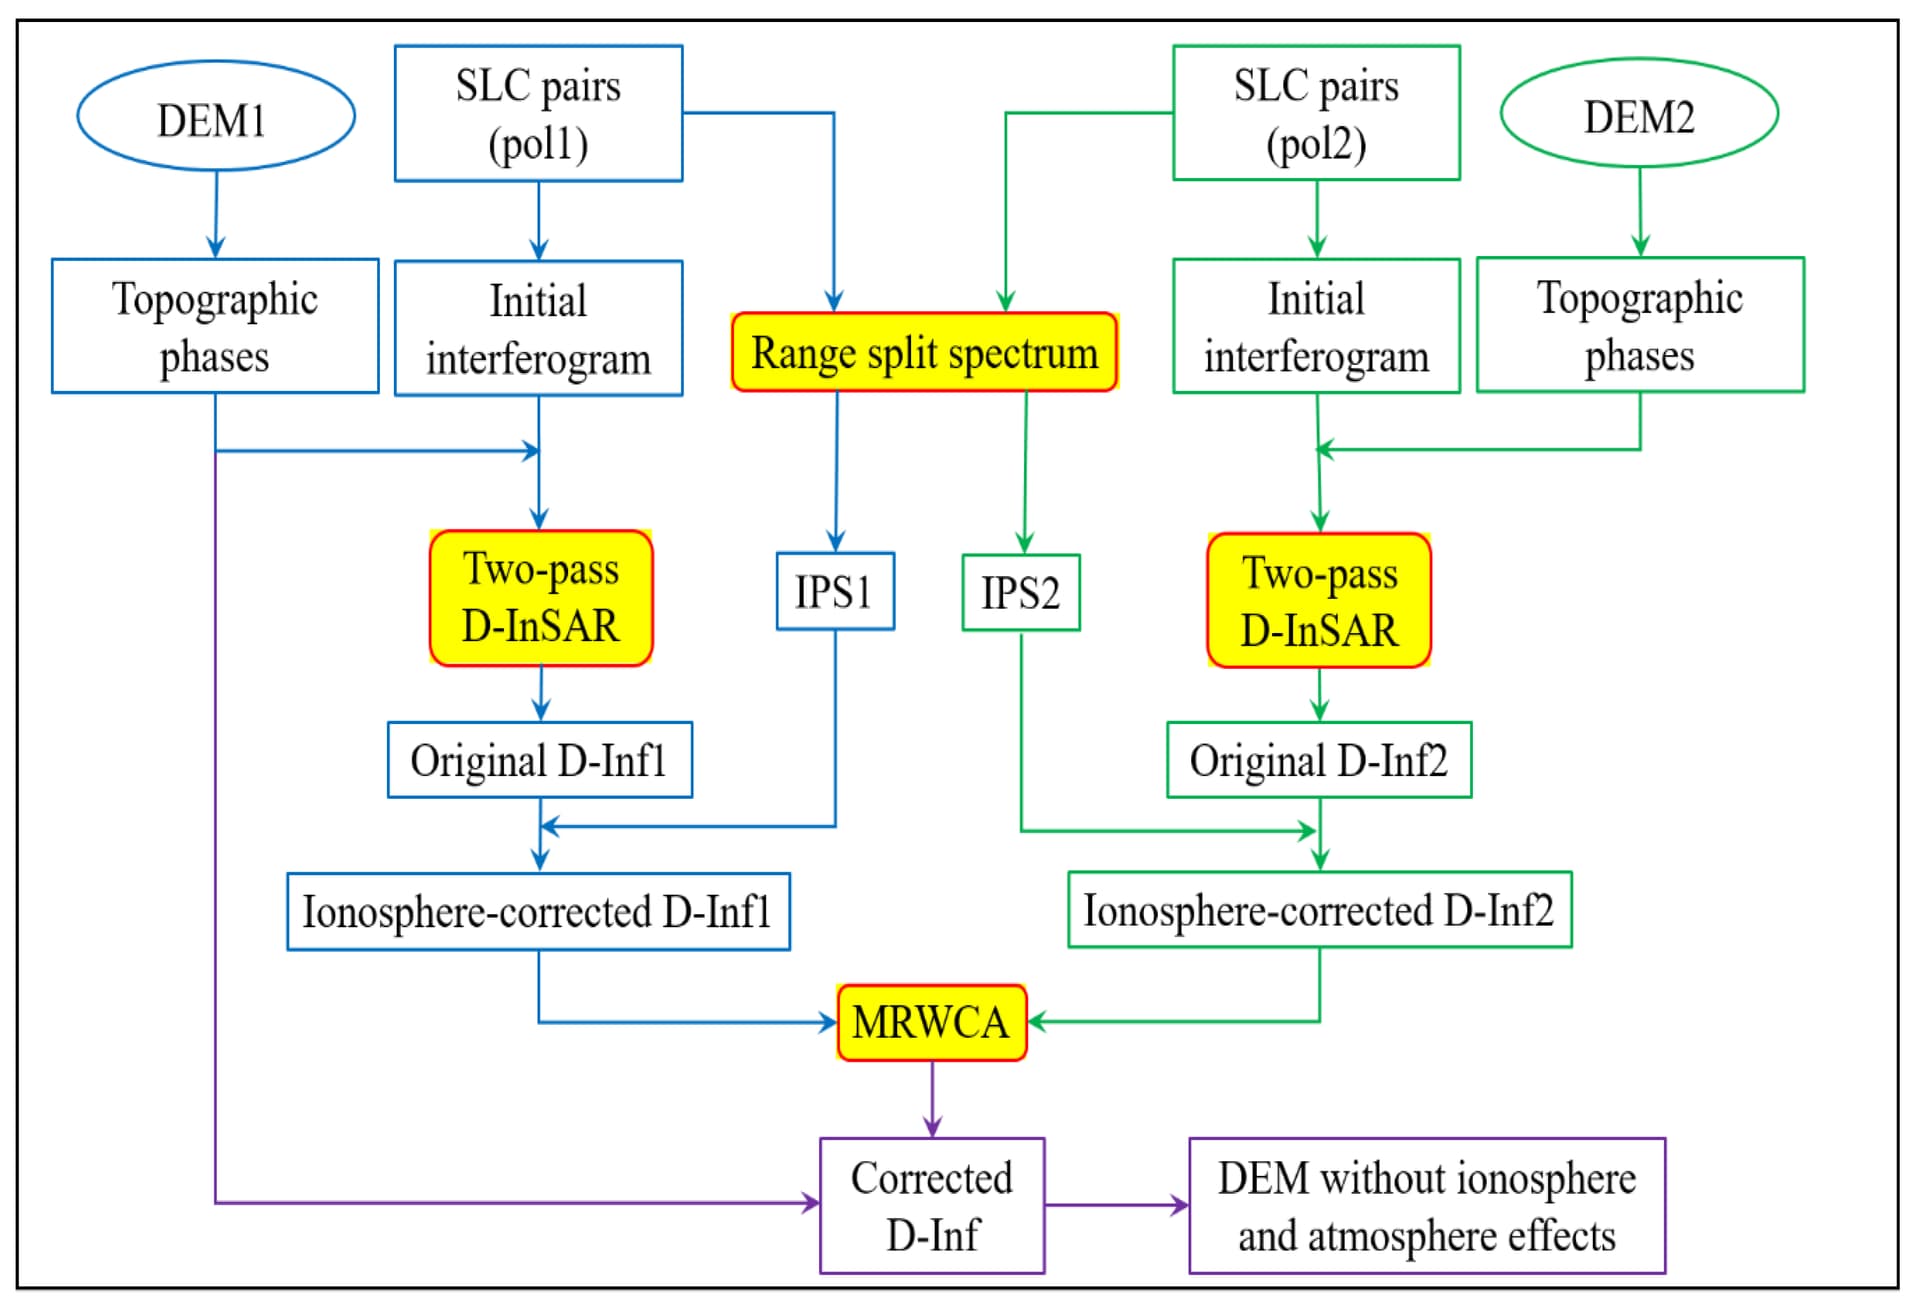
I mentioned two procedures, the fist one is even before removing orbit error phase or so-called orbit correction, and they mentioned their reasons, please have a look at the first highlighted screenshot, the other one, as you said after unwrapping step.
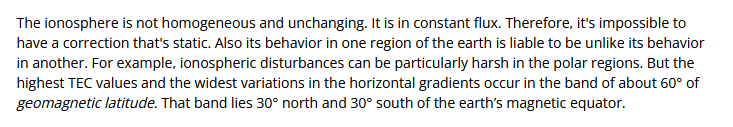
If you asked me of my personal decision, I would say before orbit correction and add up my voice to the first paper, Why, the answer is in the following screenshots and I copied the link for you as well you can go through yourself,
https://www.e-education.psu.edu/geog862/node/1715
It’s worth mentioning according to the inconstant effects of the ionosphere during the day, I’d suggest select all your data within the same time of acquisition as possible as you can,
I’d also suggest to ask the opinion of Mr. @EJFielding , would you please to have a look and say your opinion, because you already part of the InSAR Time Series Analysis of L-Band Wide-Swath SAR Data Acquired by ALOS-2
Hope the foregoing is helpful
Hmm okay, thank you for the clarification @falahfakhri. I will experiment with the procedure.
Hello everyone!
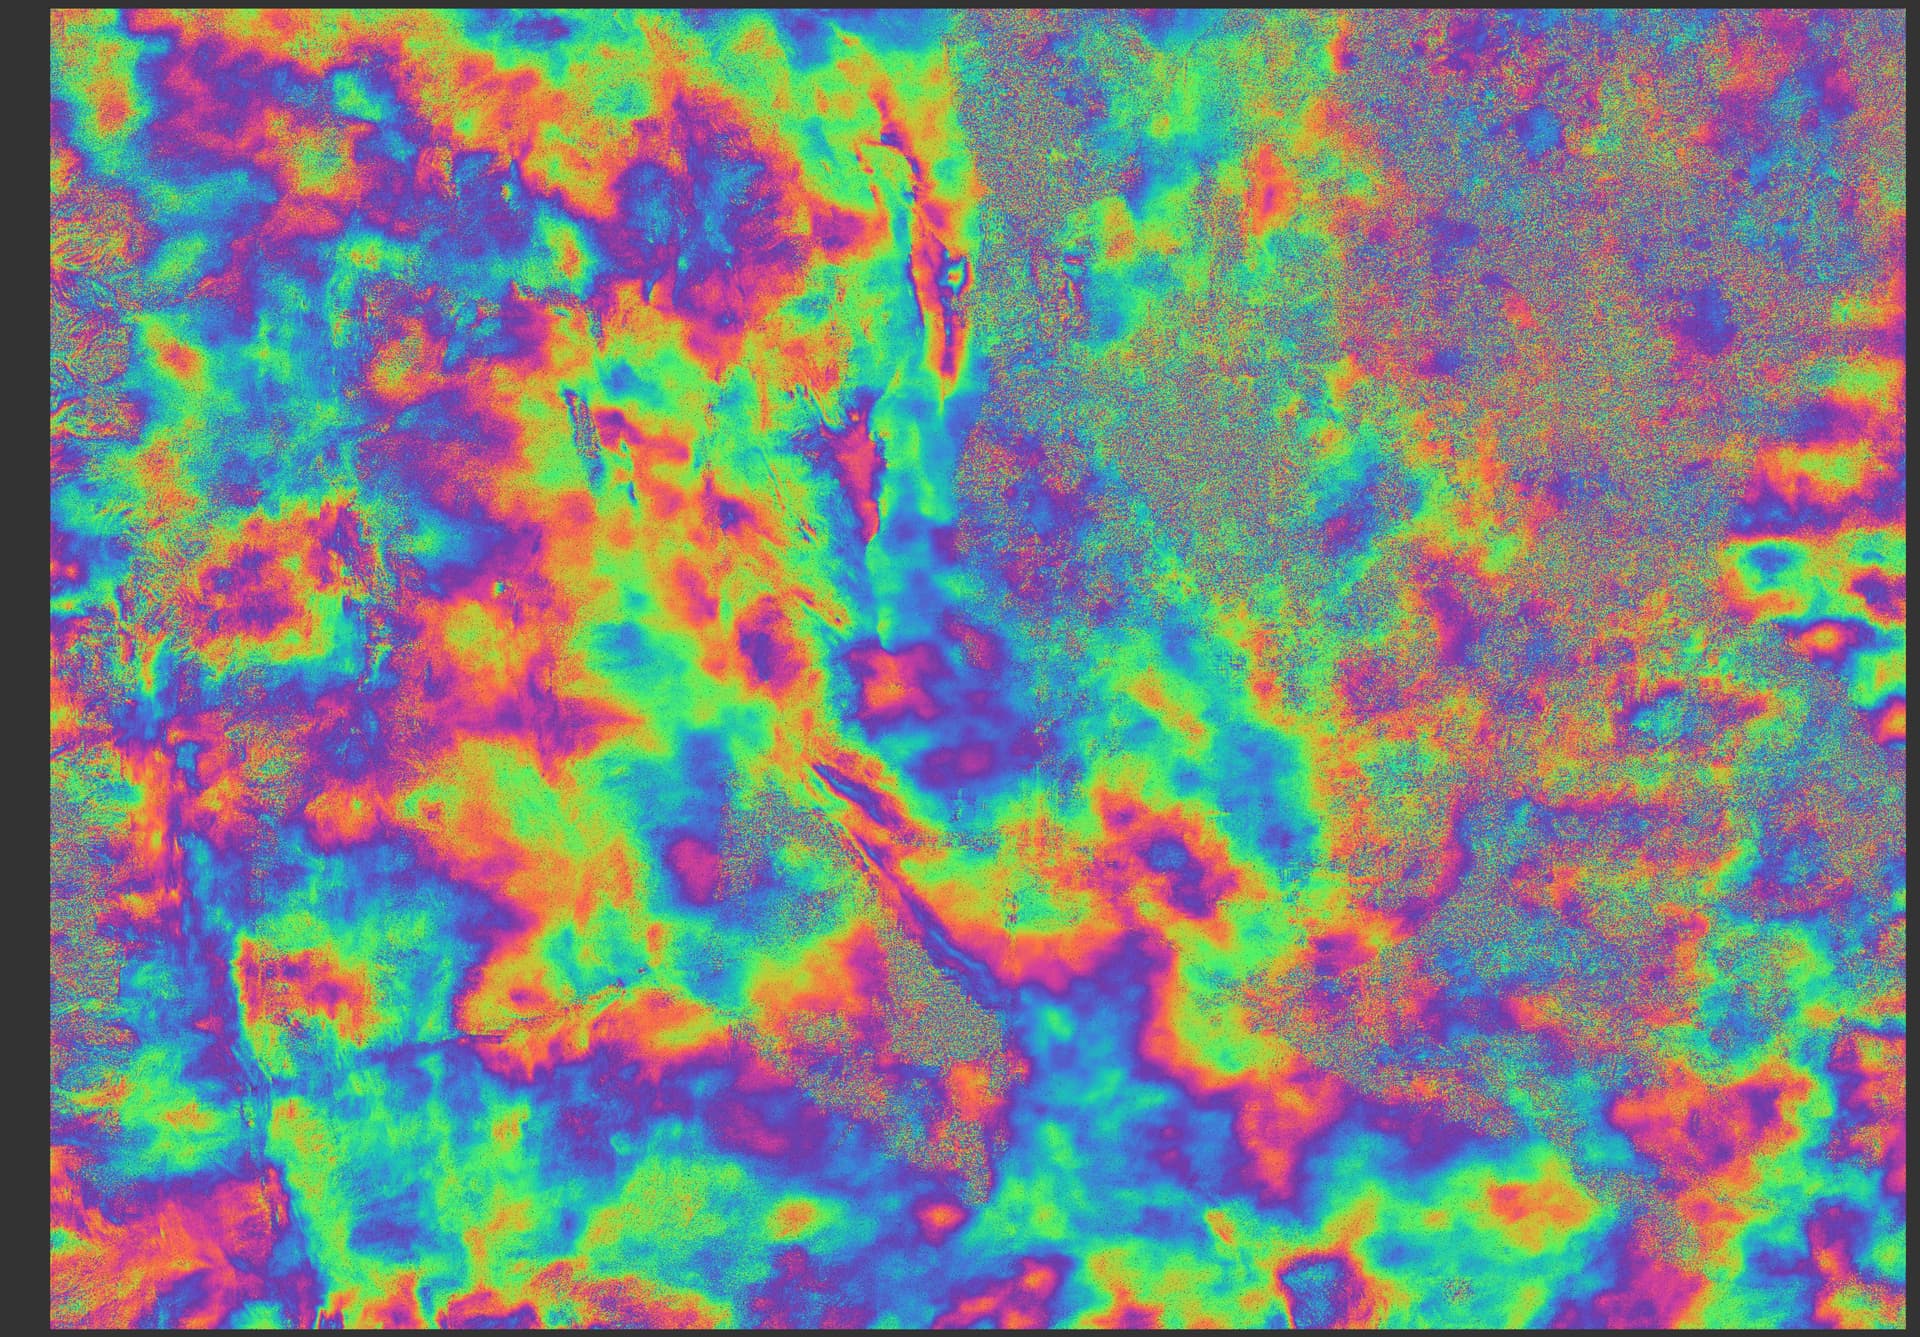
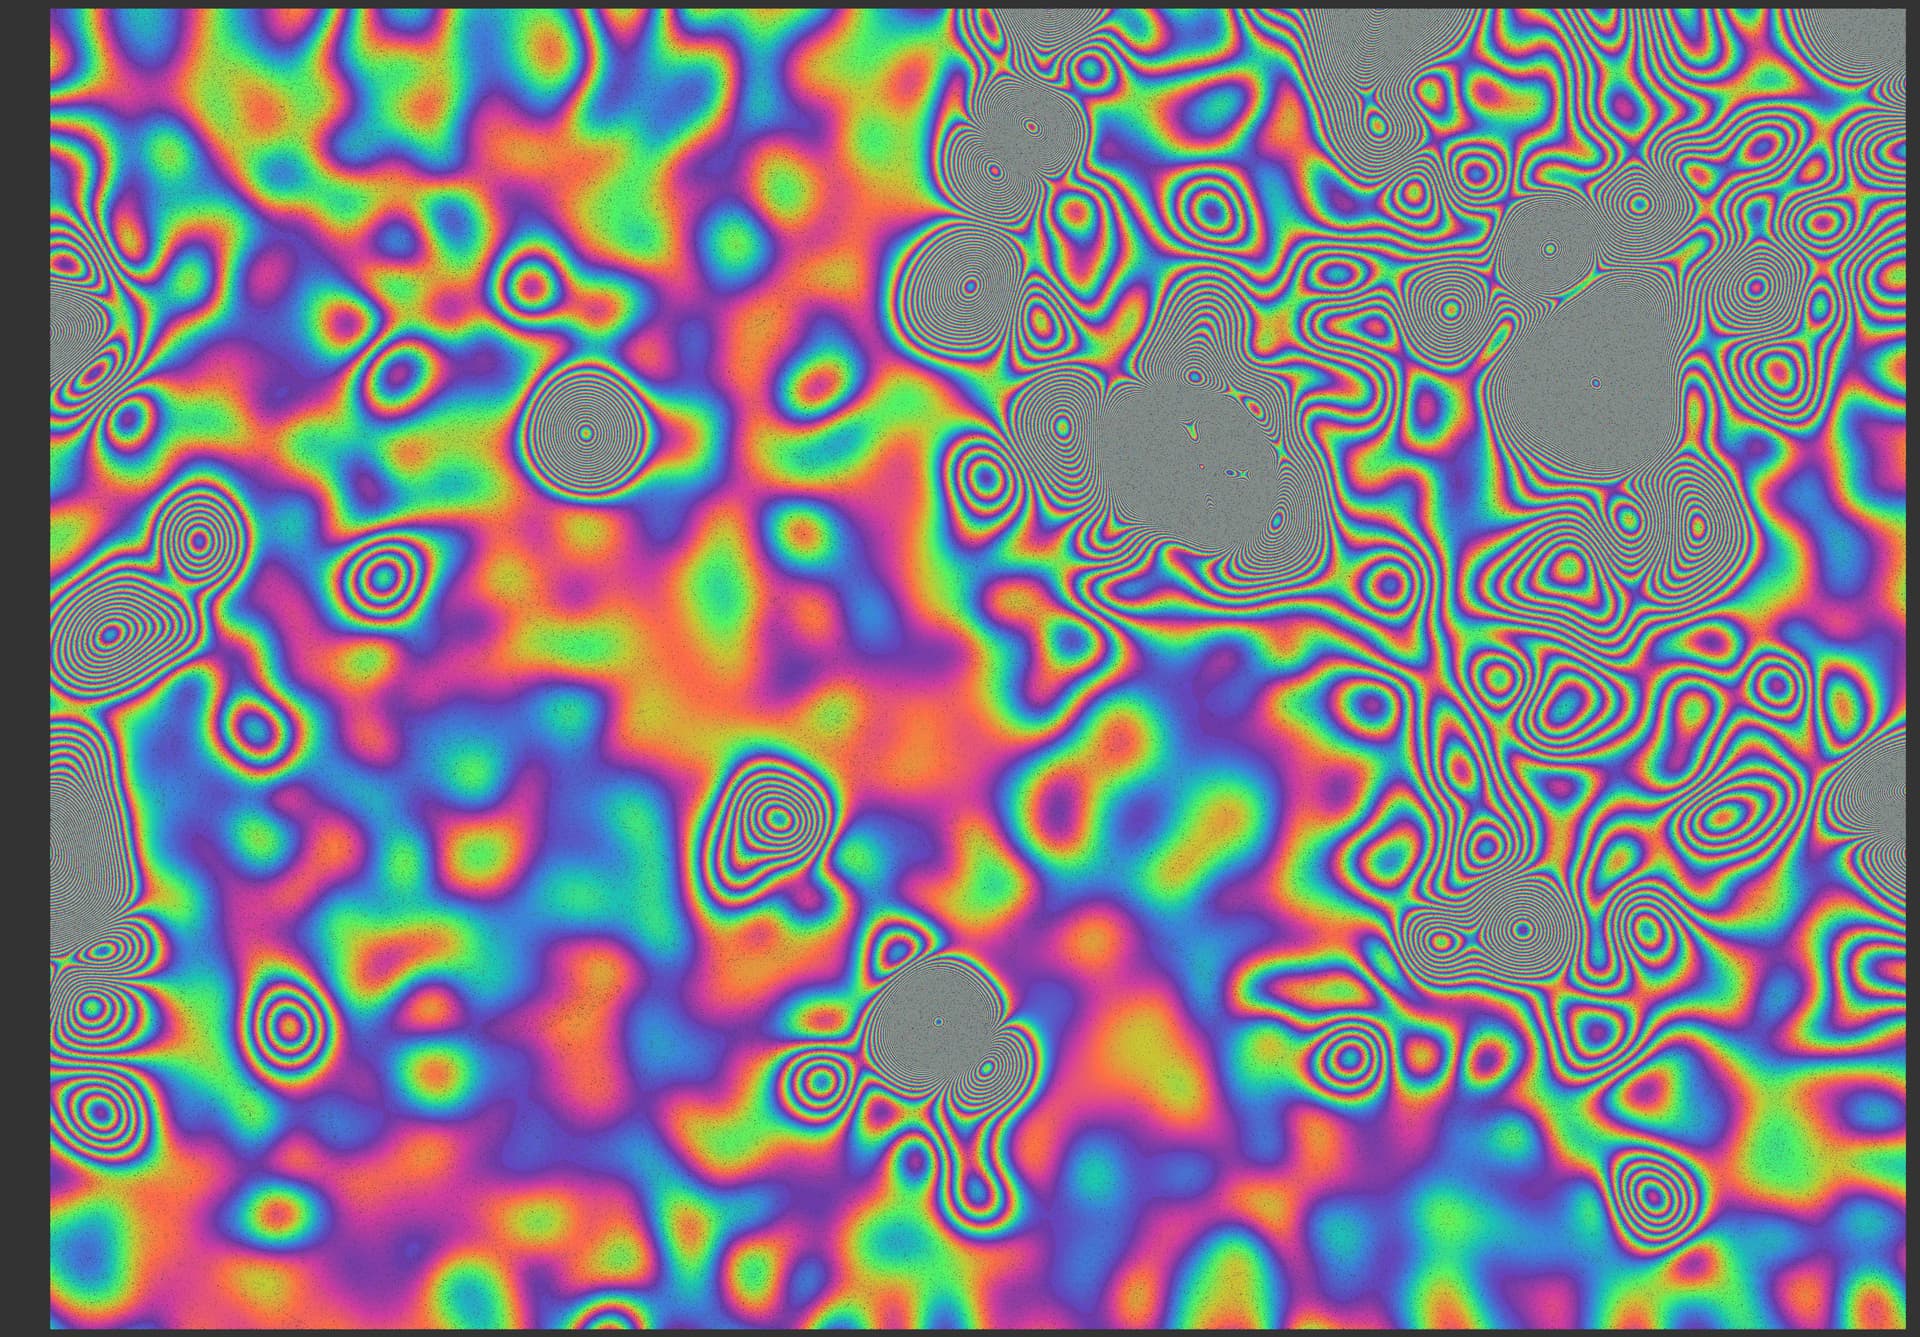
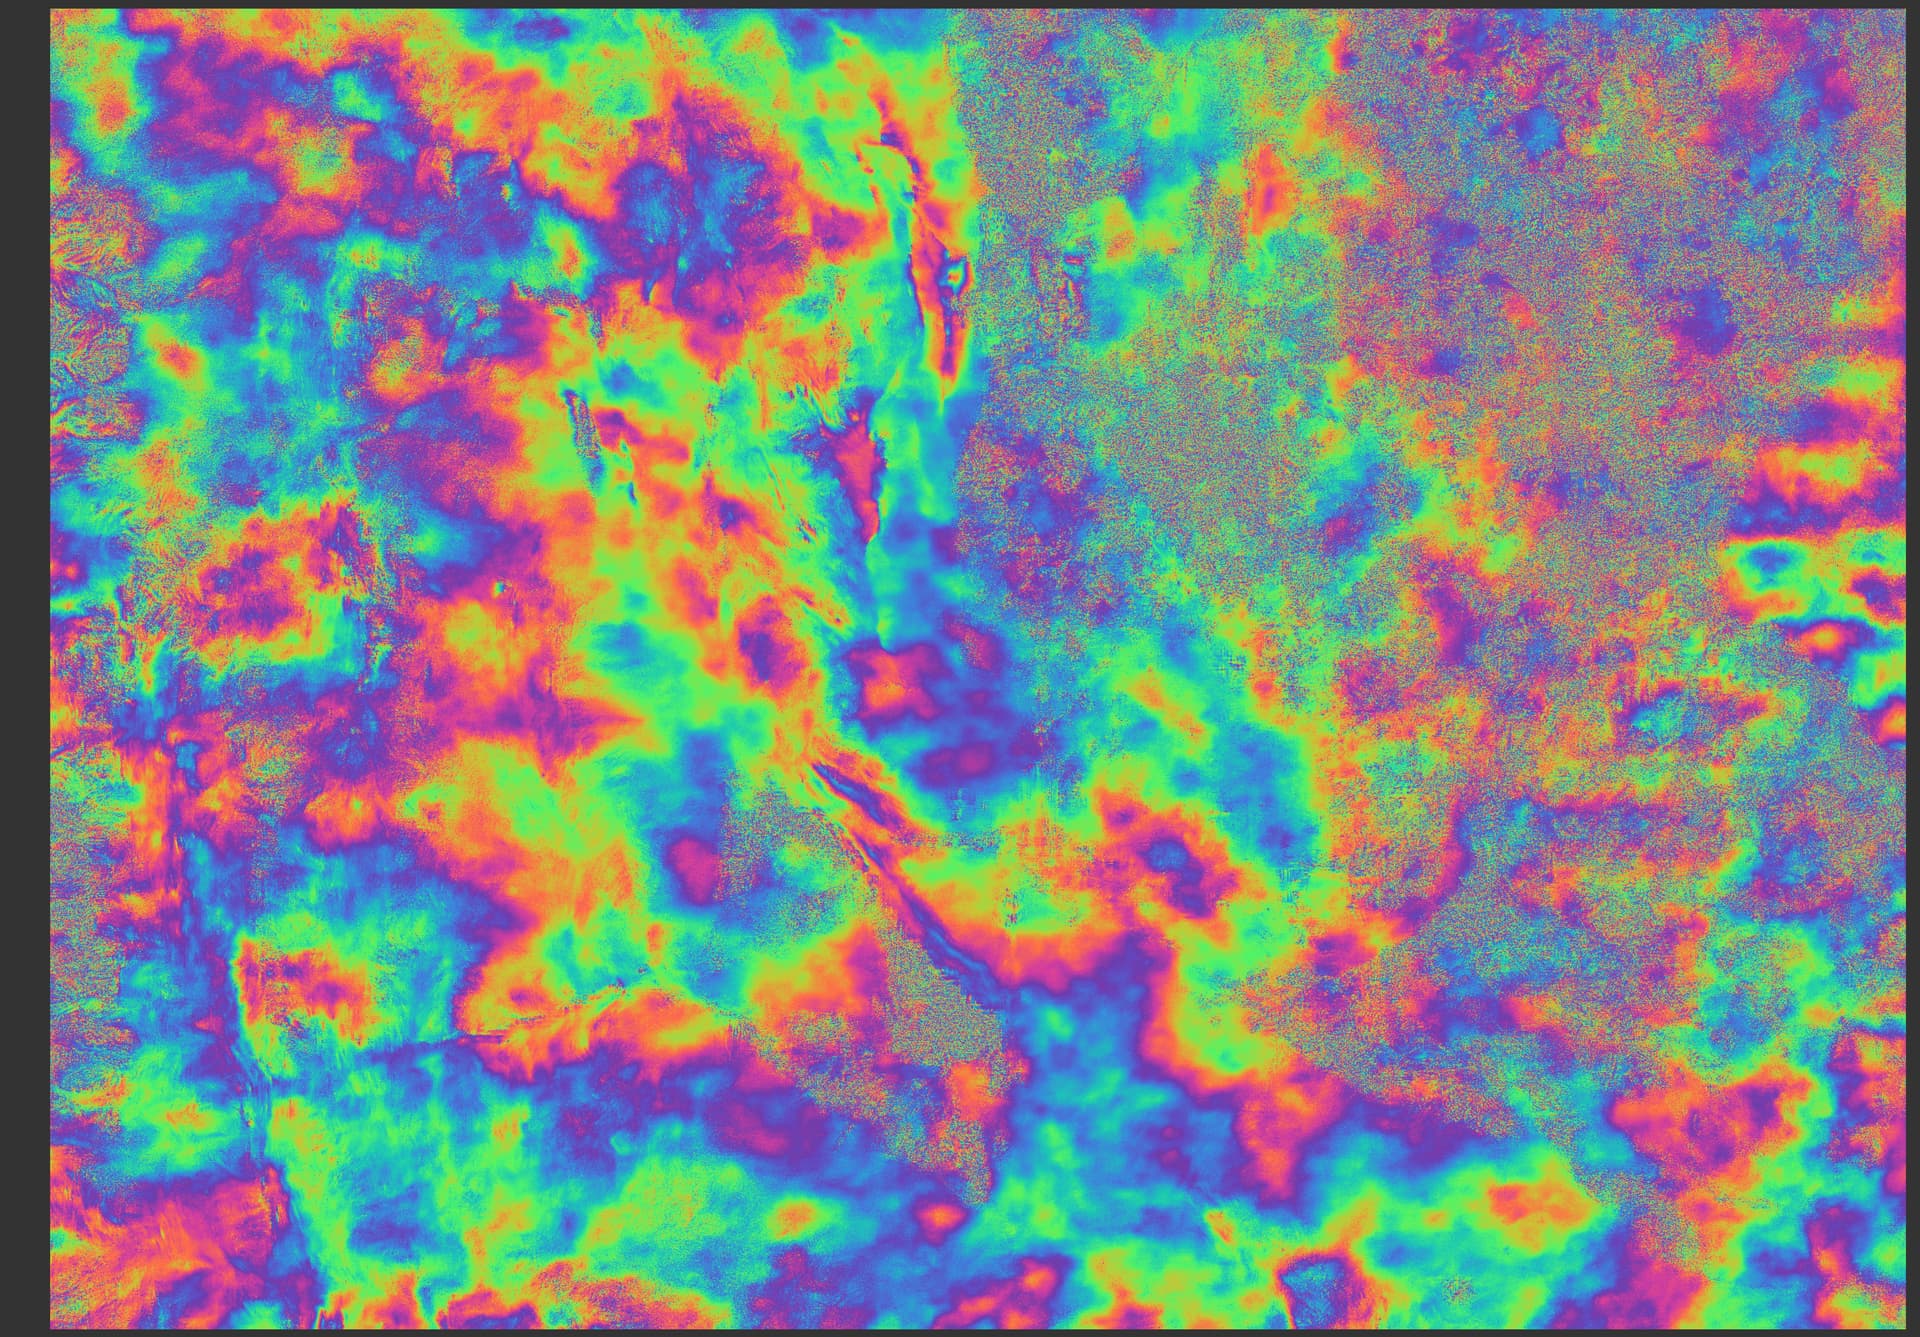
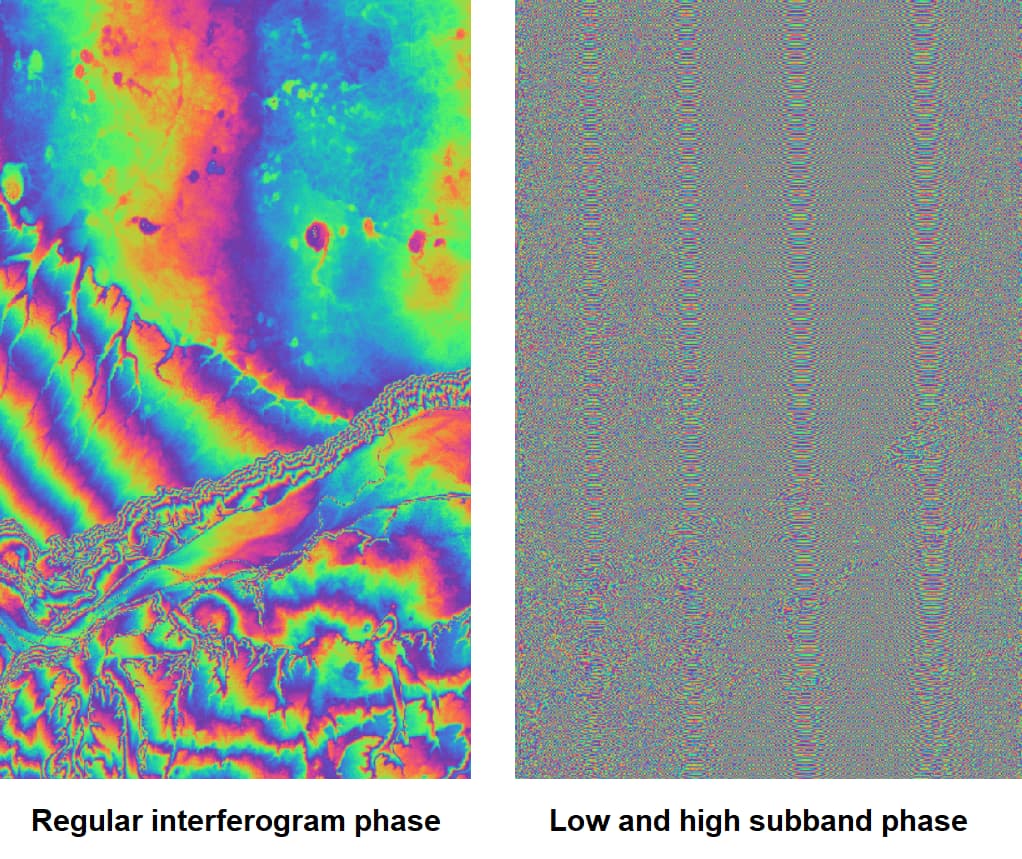
I tried out this new operator but got some extrange results. I used the same master and slave images for the unwrapped interferogram and for the low and high subbands unwrapped interferograms. This is what I got:
Original phase:
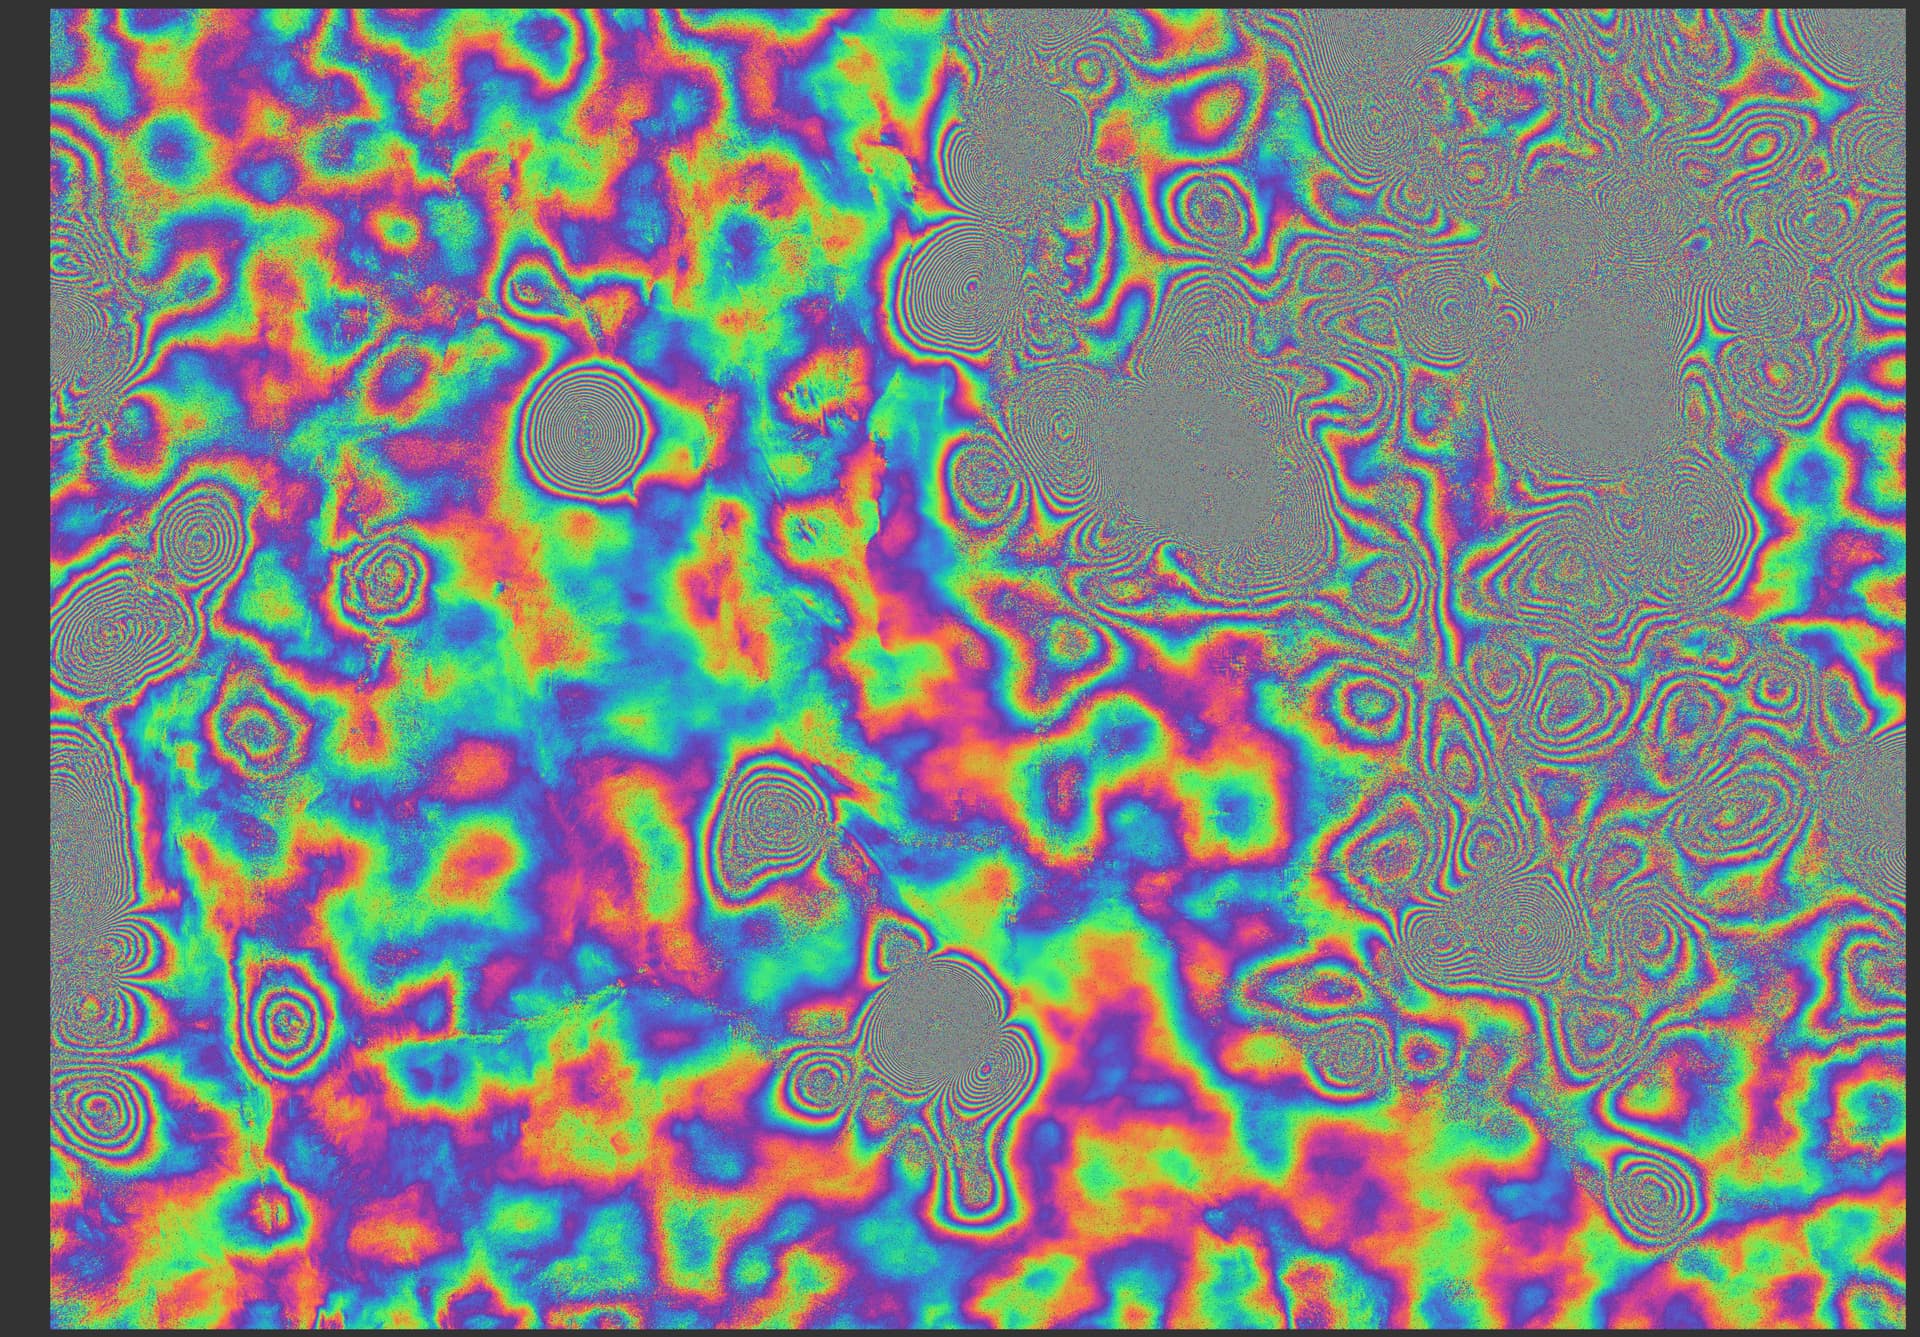
Impossible to know since you don’t provide details or graph but that ionospheric phace component is obviously wrong.
This is the graph used to create the unwrapped interferogram:
What do the sub-band interferograms look like?
I have not used the new SNAP 9 procedure for range split-spectrum estimation of ionospheric corrections. I have only used the ISCE2 software that has the split-spectrum calculation applied within several of the InSAR applications. The ISCE2 software does not estimate residual orbit errors with a polynomial, but I agree that you would want to remove the ionospheric correction first before looking at any residual ramps. If the ionospheric correction is accurate, the remaining phase ramps should be small.
Hello @mengdahl @ABraun @marpet
I have processed three descending sentinel-1 frames (frames are below each other, and I used the same processing resolution) and tried to apply ionospheric correction, but I got two errors on different tries:
Any idea how to solve it? I tried “subset” but still got the same errors.
Thanks!
Is it possible to use the Ionospheric Correction Operator with data other than Sentinel-1? I wanted to use this tool to try to improve the quality of DEMs I am working on, made using SAOCOM Stripmap data.
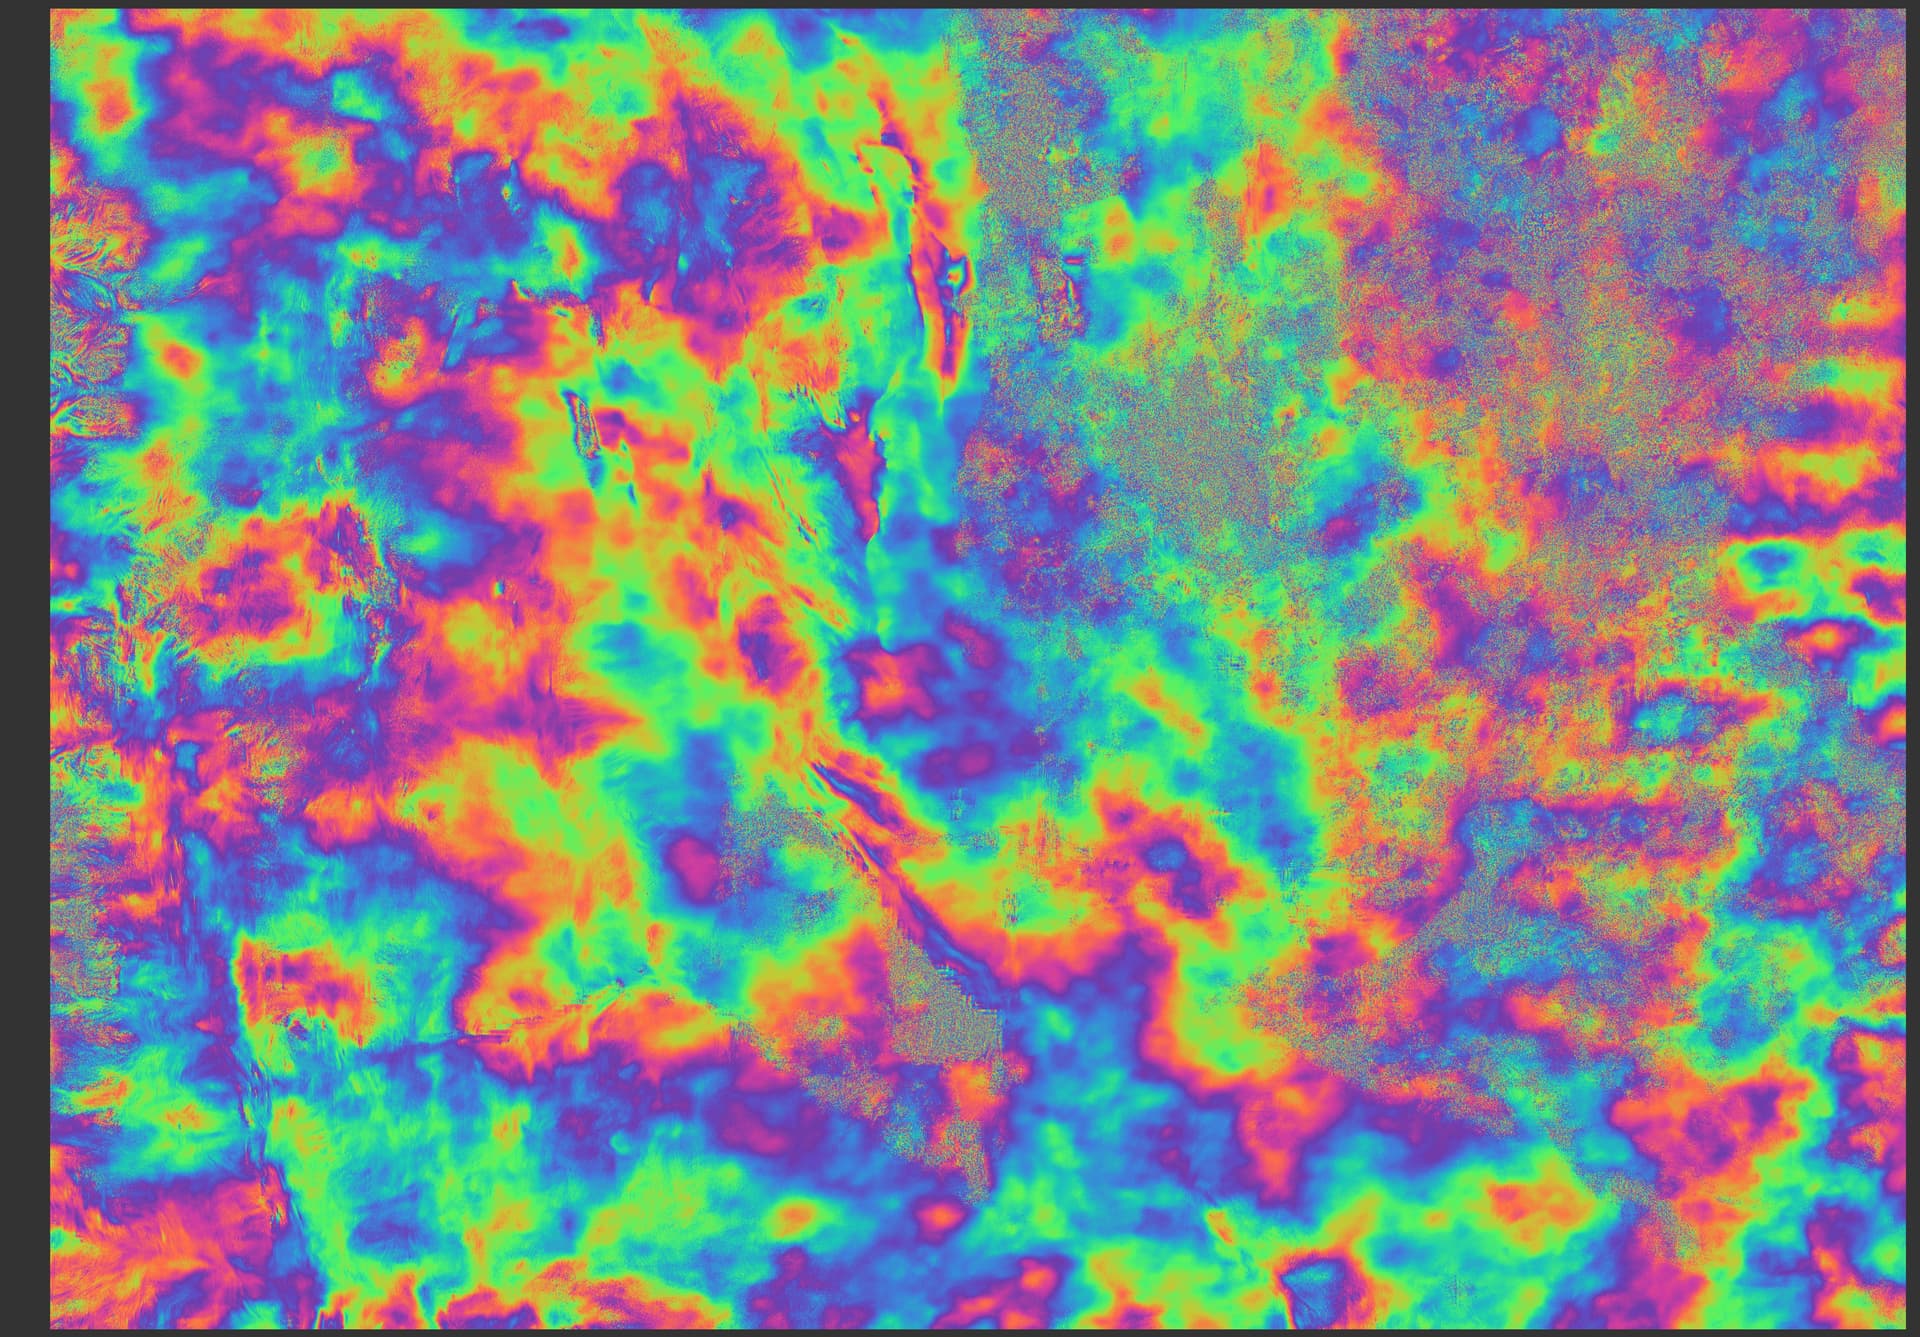
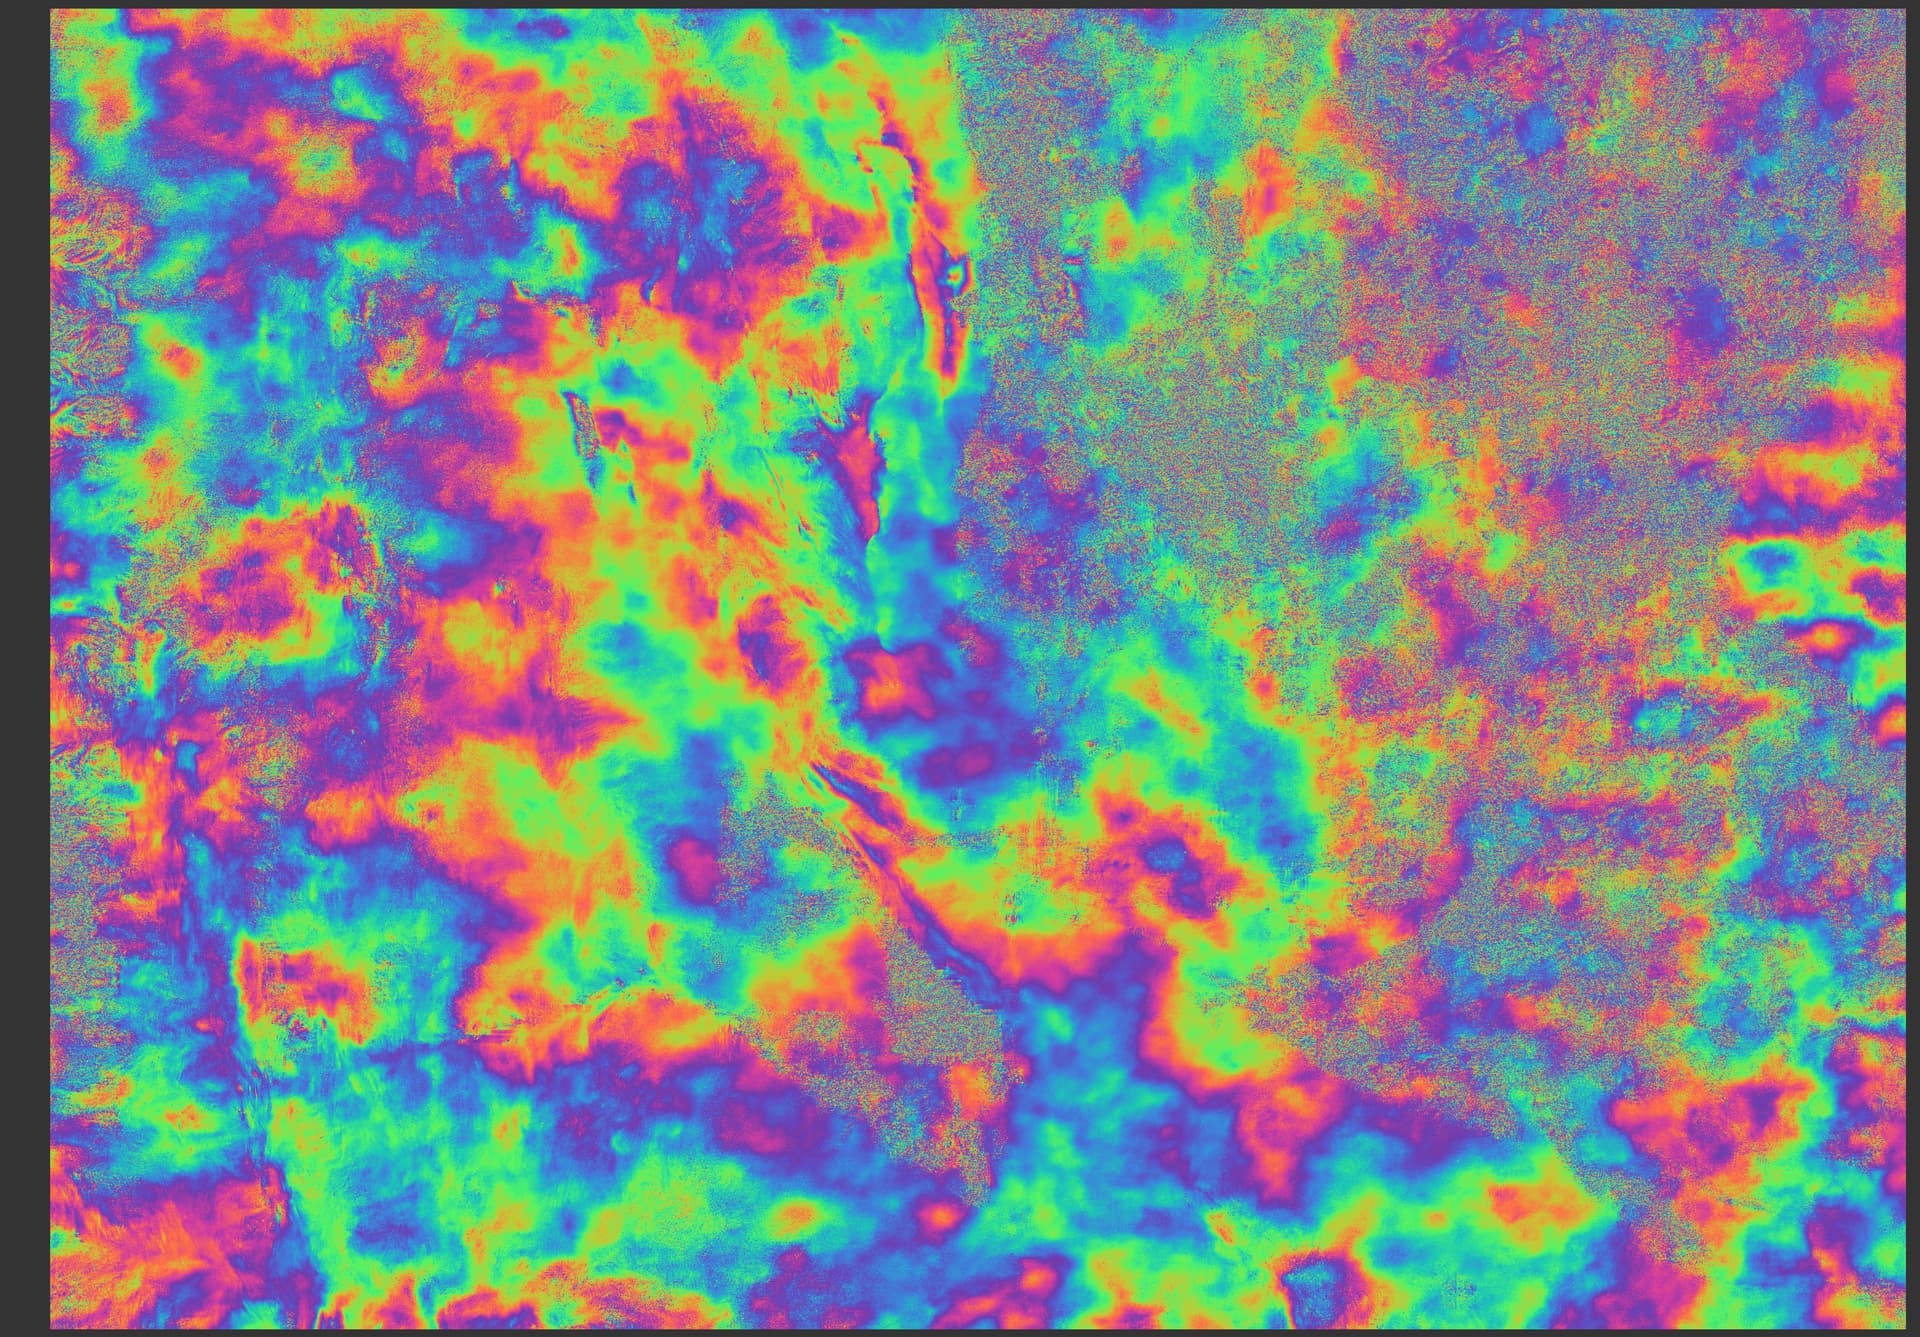
However, when I make the interferograms for the low and high subbands required in the process, the coherence is extremely low and resulting phase is just noise.
What is the perpendicular baseline in your case?
@mengdahl For the interferometric pair illustrated in my earlier post, the Stack Overview Tool shows the following parameters:
Bperp: -531.91 m
Btemp: -16 days
Height amb: 59.34 m
Modeled Coherence: 0.55
Delta fDC: 0.07 Hz
The interferogram is made with a pair of SAOCOM Stripmap, Dual-Pol, S1 (Beam Position) images.
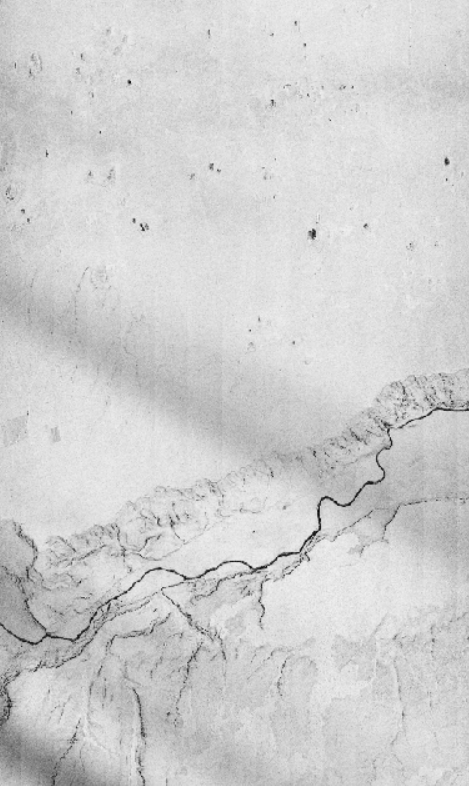
This is the coherence image of the pair.
@AlejandroDInSAR Dear colleague, did you succeed in making ionosphere corrections using SNAP and the workflow depicted in your graphs? You wrote unwrapped interferogram, but on the graph steps are for creating wrapped interferogram
Also please make clear how did you correct the original interferogram and at which step.
Thank you.
Any other comments are welcome.