Dear all
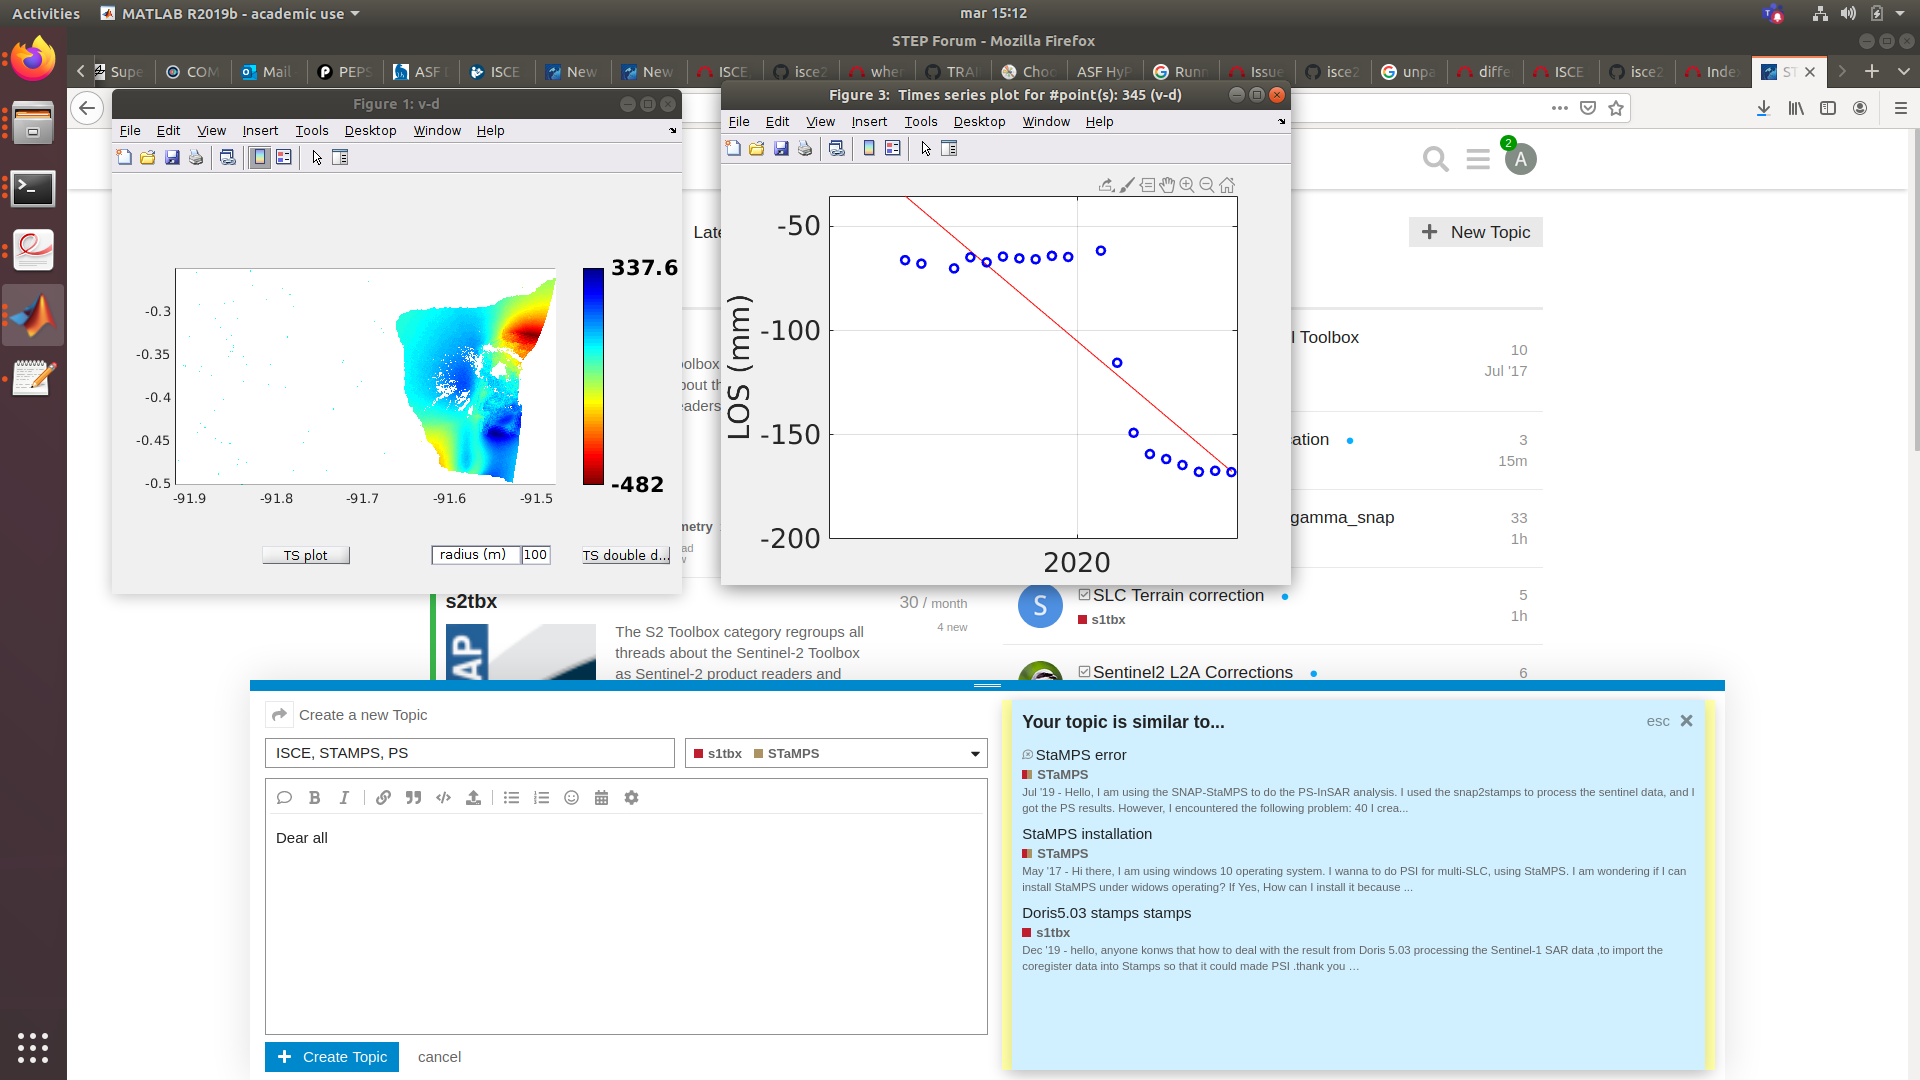
I’m using STAMPS to create the time series, at the moment of graphing with TS PLOT I get the series graph but only graph 19 points and reviewing uses 28 dates
Someone can help me ??
Use the command ps_plot(‘v-d’,1,0,0, [1:20,7:8],‘ts’)
Dear all
I’m using STAMPS to create the time series, at the moment of graphing with TS PLOT I get the series graph but only graph 19 points and reviewing uses 28 dates
Someone can help me ??
Use the command ps_plot(‘v-d’,1,0,0, [1:20,7:8],‘ts’)
by adding [1:20] in your command you define the IFG_LIST variable, so that you only display the interferograms #1 to #20 so you only get 19.
Please see a description of all variables here: https://github.com/dbekaert/StaMPS/blob/master/matlab/ps_plot.m
Just remove the […] from the command to plot all available interferograms.
Or did I misunderstand your point?
Thanks for your help
Hello there,
I am getting following error while processing ISCEtoStaMPS
stamps(1,1)
STAMPS: ########################################
STAMPS: ####### StaMPS/MTI Version 4.0b6 #######
STAMPS: ####### Beta version, Jun 2018 #######
STAMPS: ########################################
STAMPS: Will process patch subdirectories
STAMPS: ########################################
STAMPS: ################ Step 1 ################
STAMPS: ########################################
STAMPS: Directory is PATCH_1
Found inc angle file, will load the data
Loading data into matlab…
SETPARM: heading = -169.2403
SETPARM: lambda = 0.056
Error using ~=
Arrays have incompatible sizes for this operation.
Error in ps_load_initial_isce (line 129)
not_master_ix=caldate~=master_day_yyyymmdd;
Error in stamps (line 281)
ps_load_initial_isce(data_inc)
Related documentation
Hello, has your problem been solved
Hello, I’ve encountered the same problem,has your problem been solved