Hello Everyone.
I have completed the stamps processing and here i got some results but i think results are not so fine can any one guide me about how to refine my results??
thankyou
did you have a look at the mean displacement? Even if some interferograms are biased, you can still retrieve an average pattern which makes more sense.
ps_plot('v-do')
Also, you can exclude the interferograms which are of bad quality by adding a list to this command:
ps_plot('v-do', 4, 0, -1, [1,2,3,4,7,8,9]
Or you drop the bad interferograms from the scla estimation:
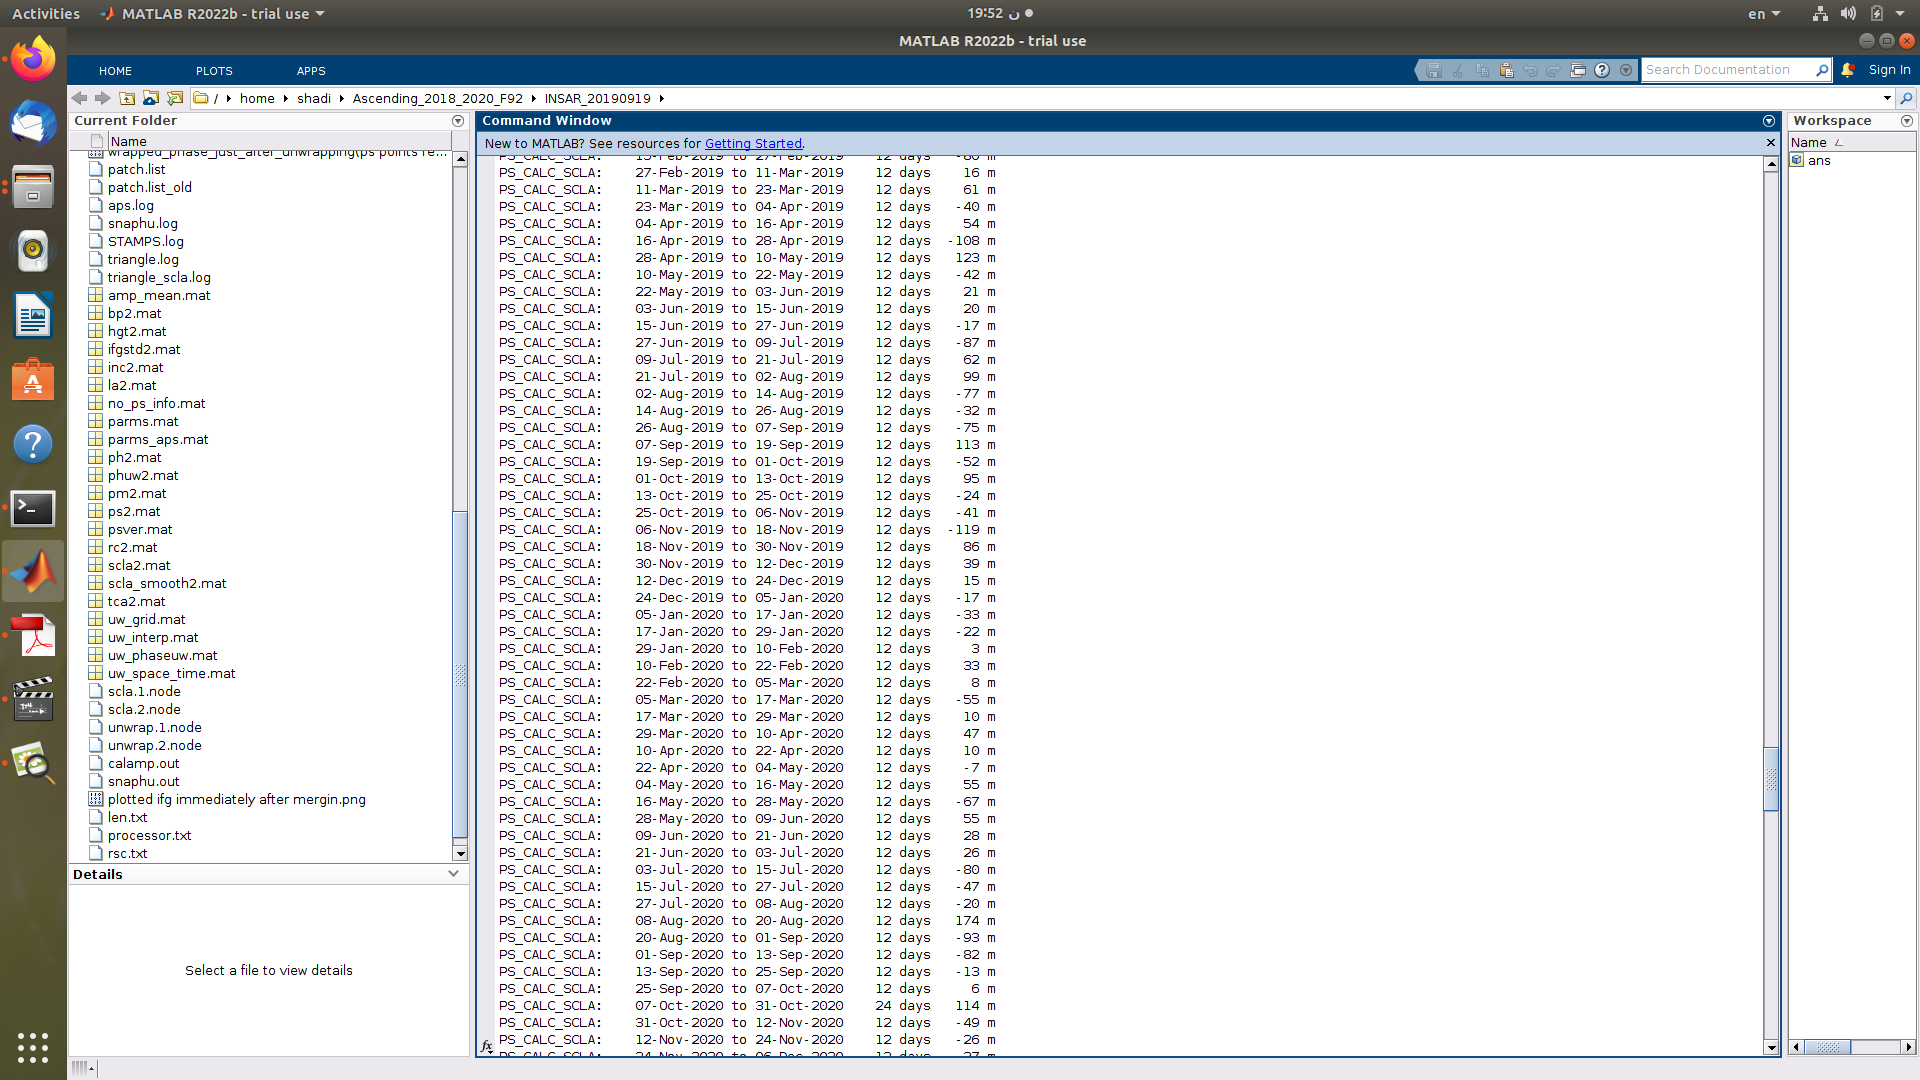
setparm(‘scla_drop_index’,[17,18])
source: http://eoscience.esa.int/landtraining2018/files/materials/D3B2_Stamps_S1_PS_Exercise_2018.pdf
1 Like
Thank you so much for your quick response …no i did not try these steps… i will try this first… thank you once again @ABraun
Based on what observations should I make the decision to drop certain interferograms and re-run unwrapping process?
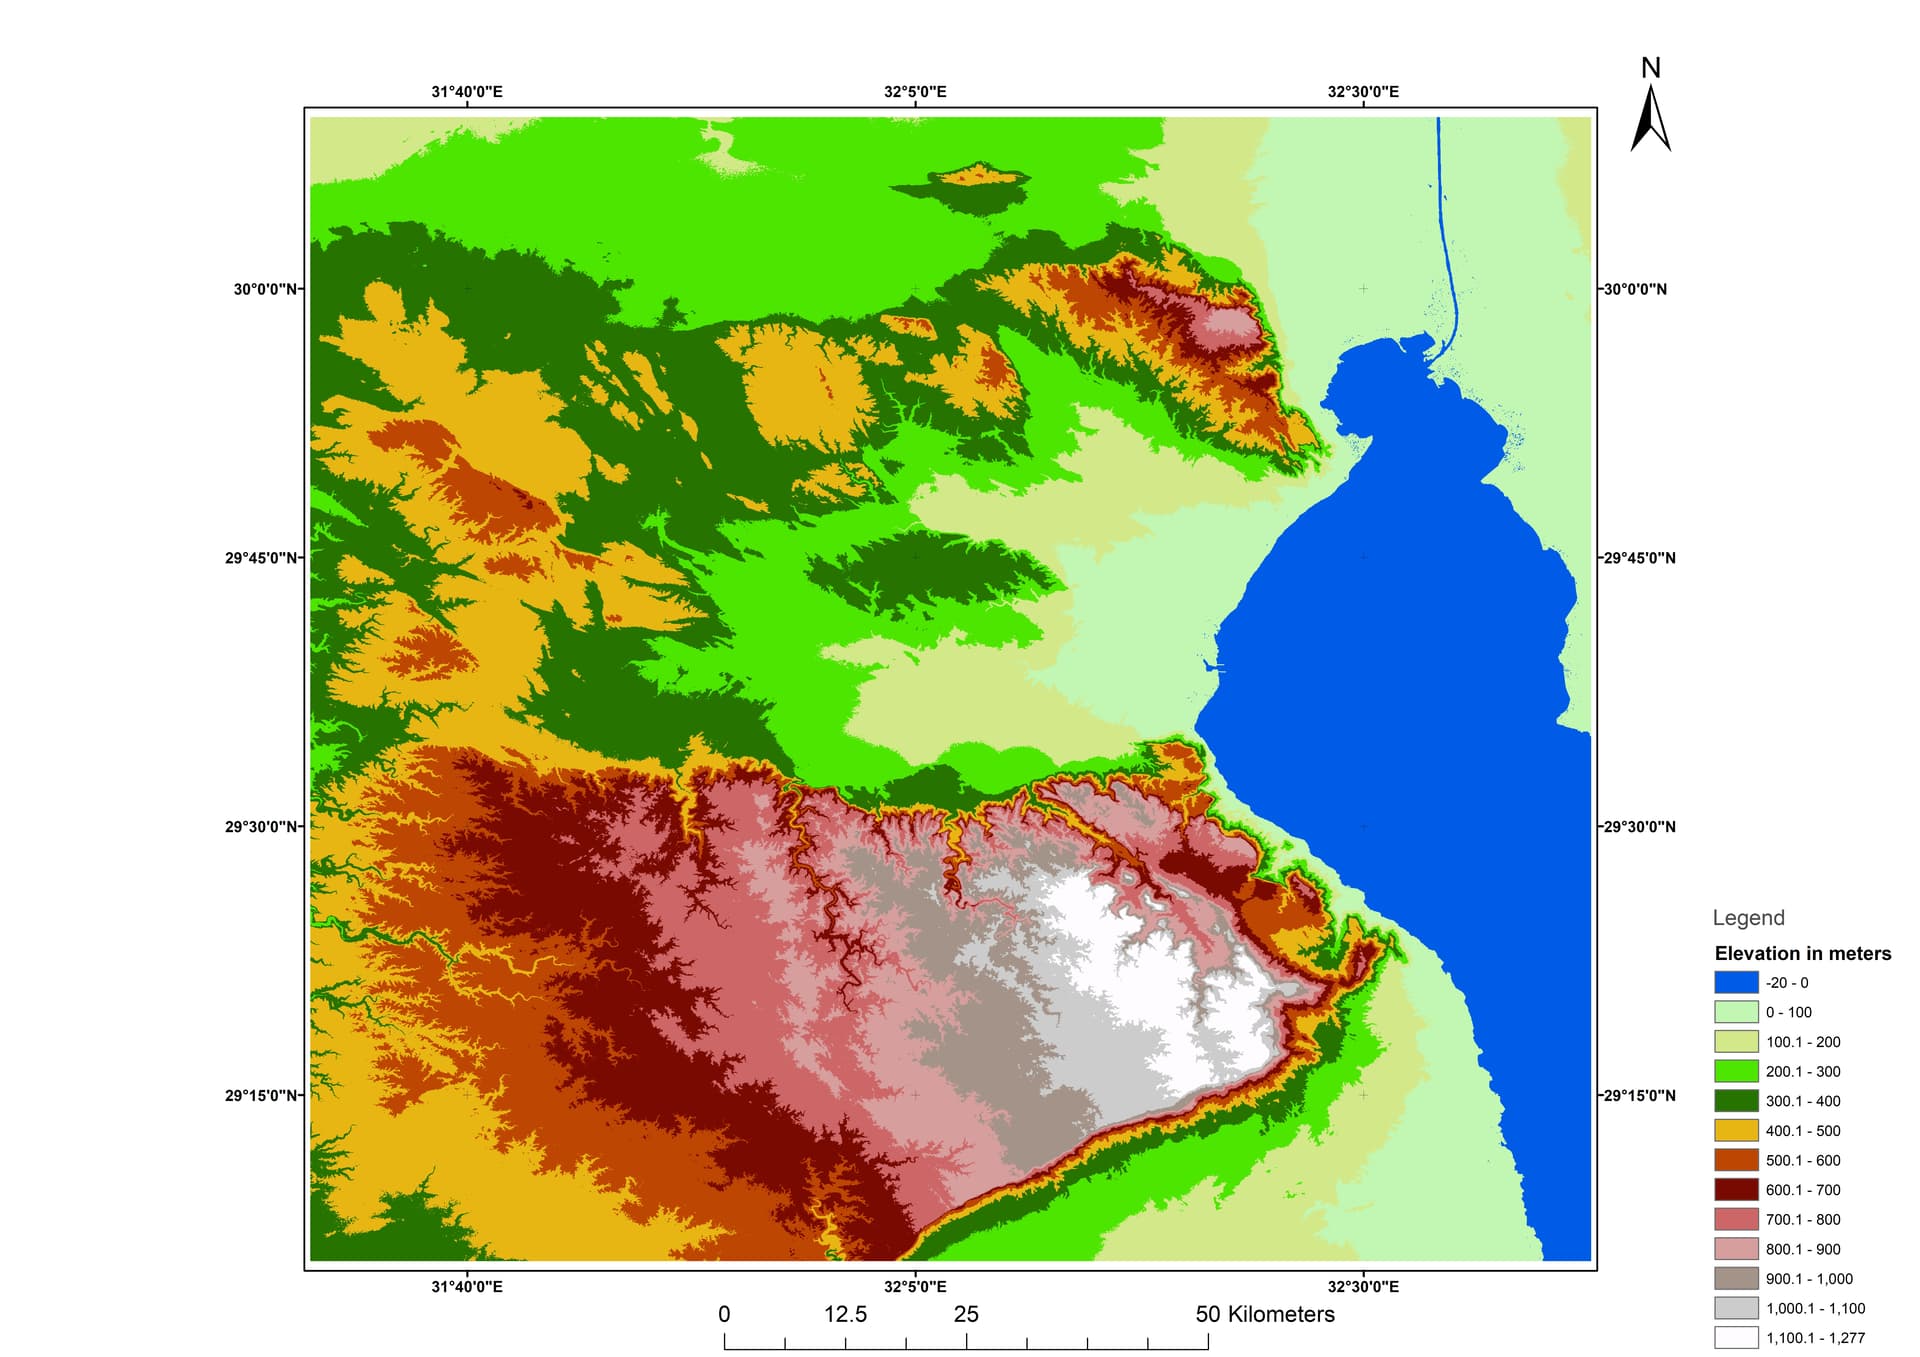
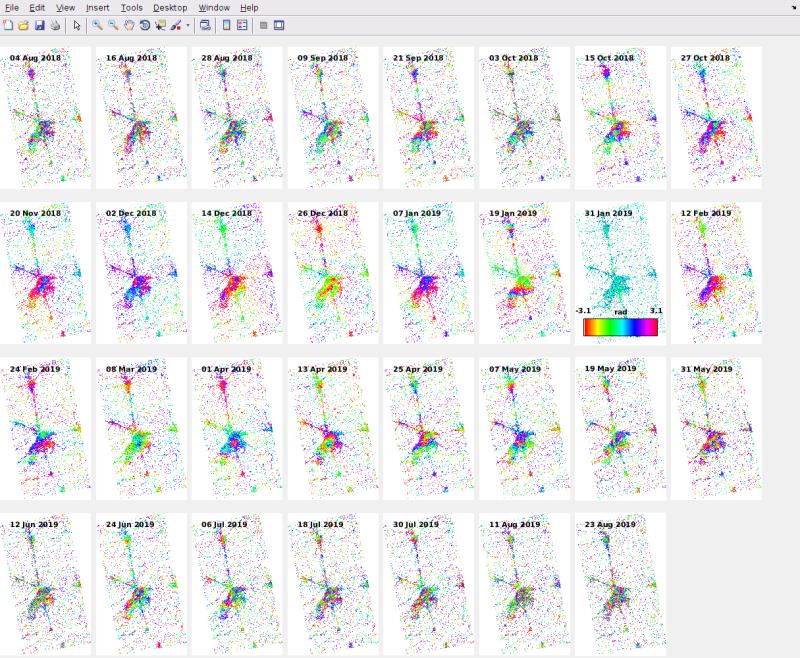
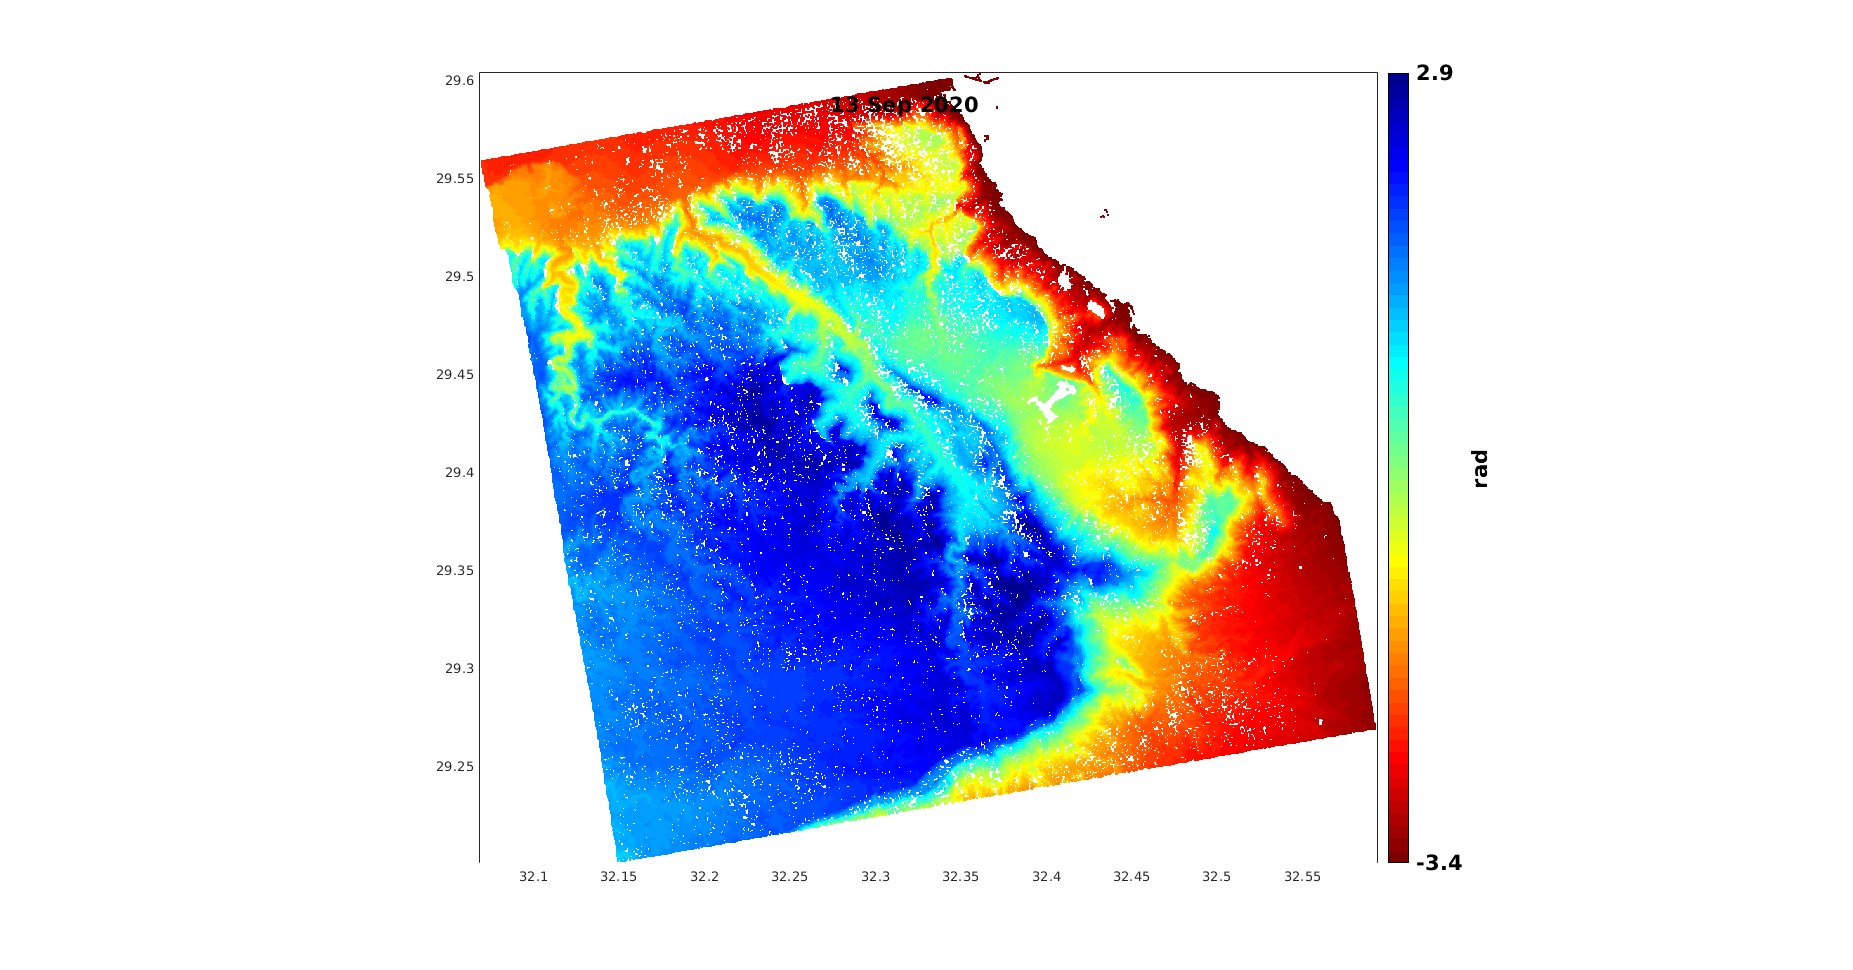
because based on those interferograms, they are all dominated by atmospheric noise and the cyclic interferometric fringes are not present however there’s a gradational pattern from south-west to northeast (while the study area is dominated by high plateau and plain areas near the eastern and north-eastern margin that terminates with a water body (the blank white areas)
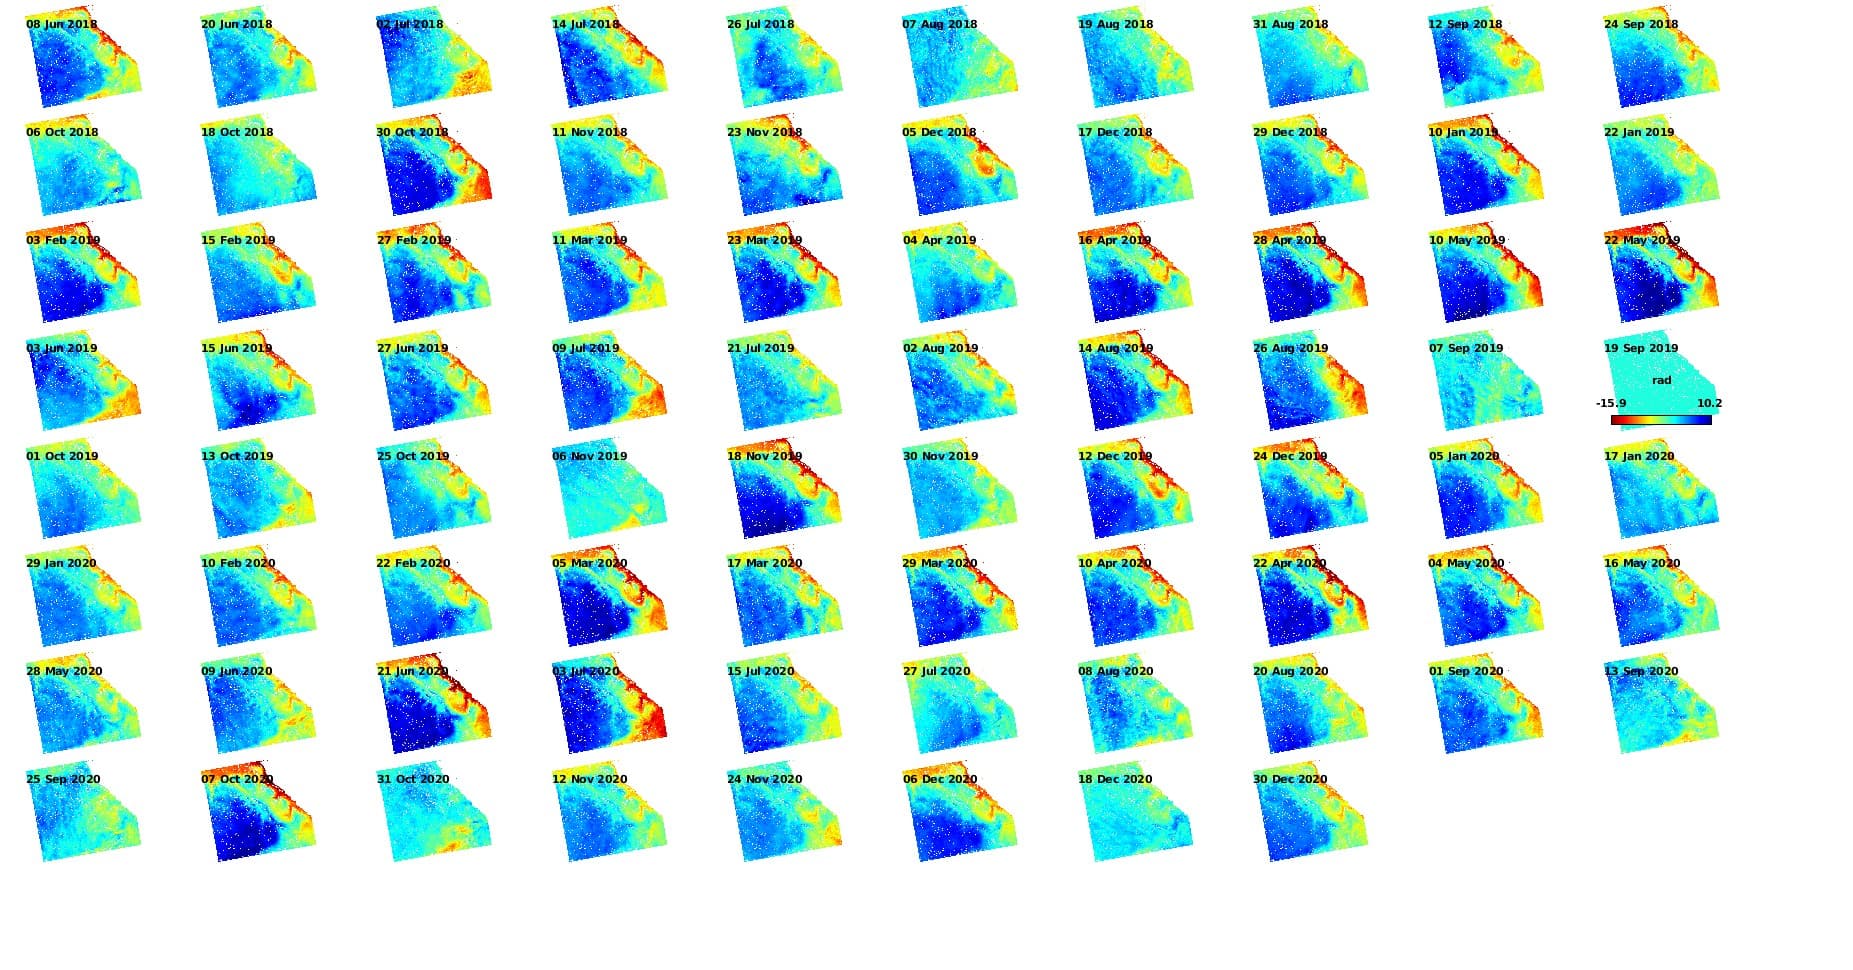
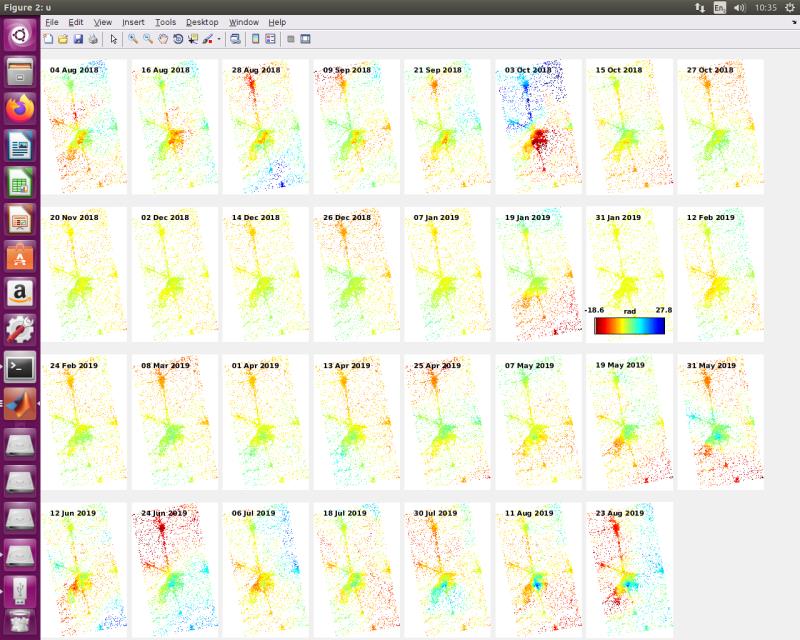
those are the results of the calculated SCLA
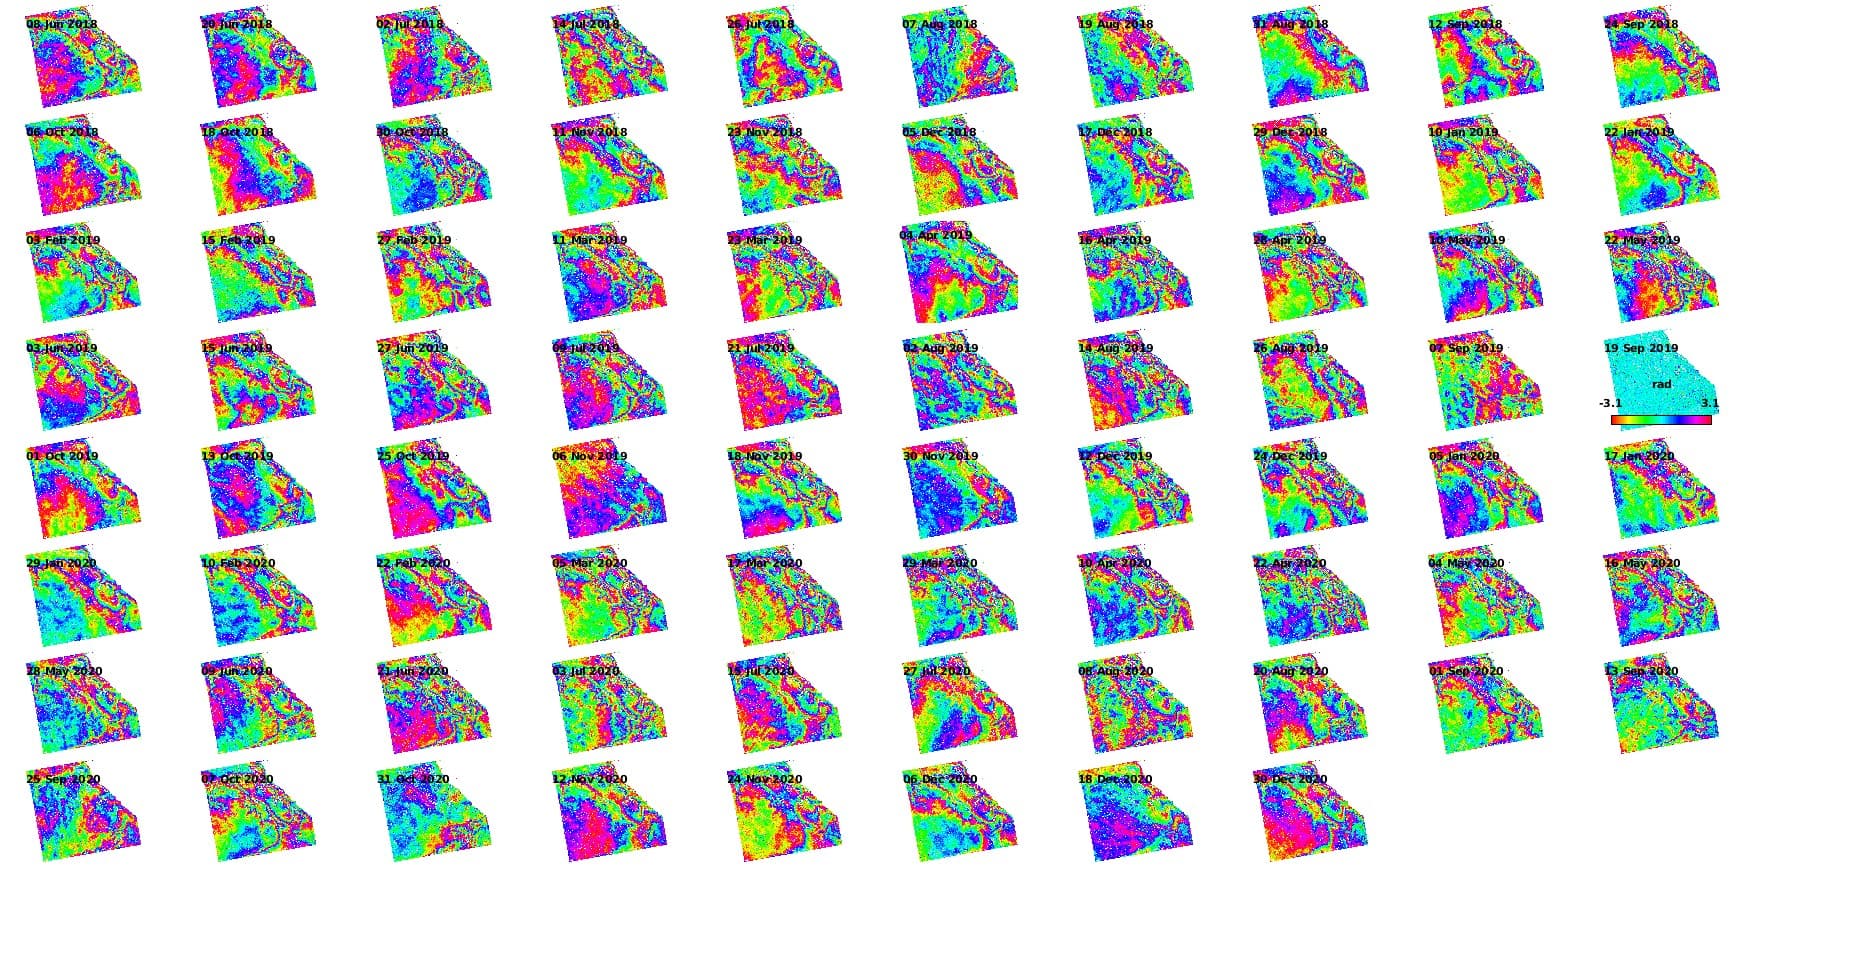
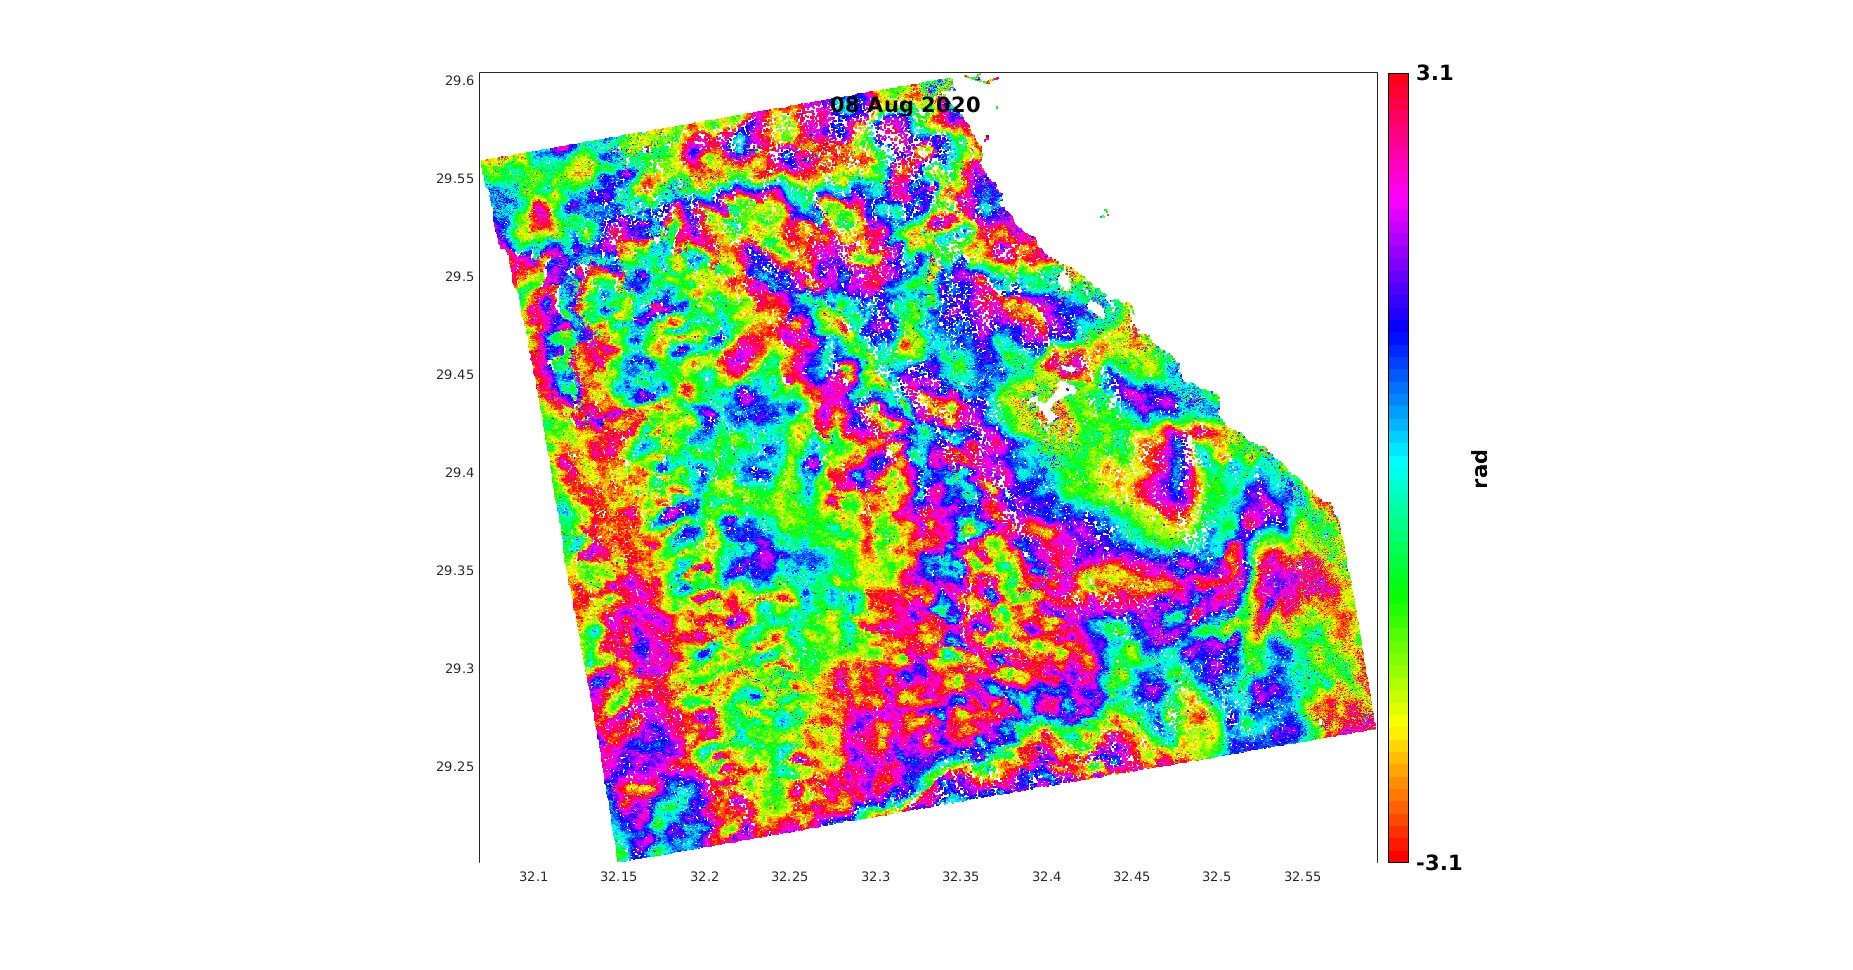
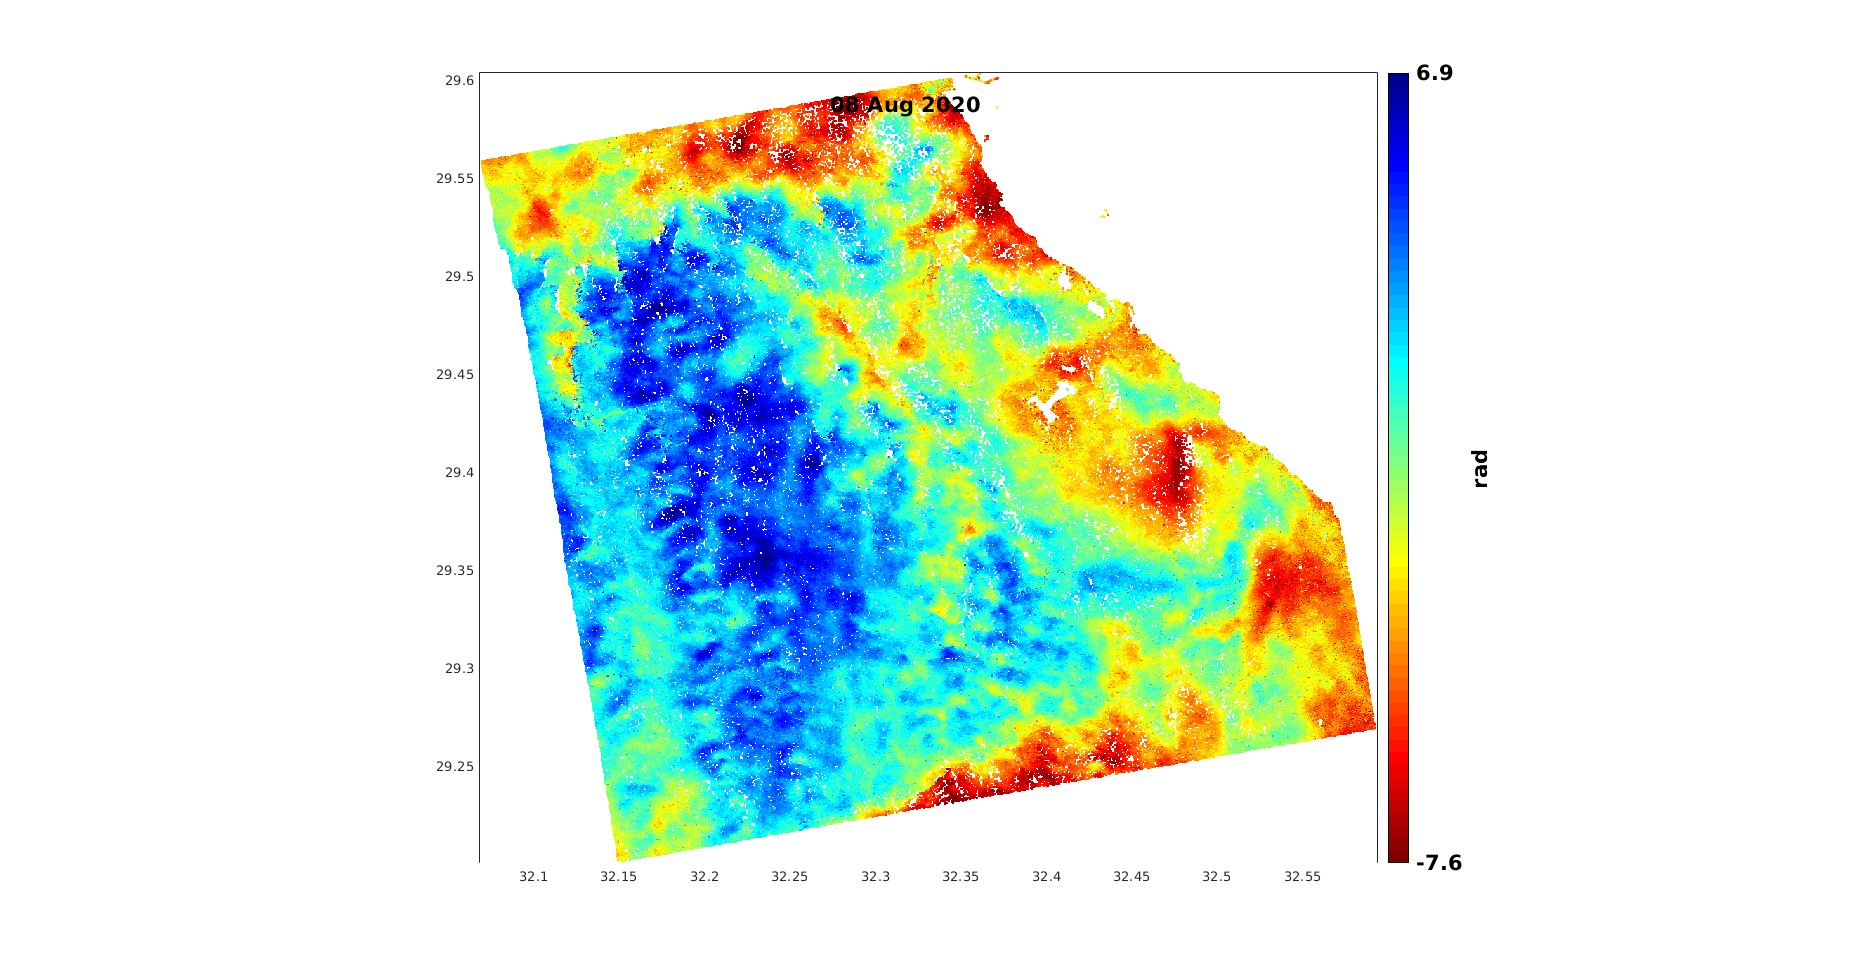
Here’s an example of a wrapped phase of the interferogram with highest calculated SCLA (174m) and its equivalent unwrapped phase
And here’s what the aps linear-based atmospheric contribution for the same interferogram,
calculated based on the obsolete get_modis.py script from TRAIN
And this is an example of GACOS ZTD map of the area
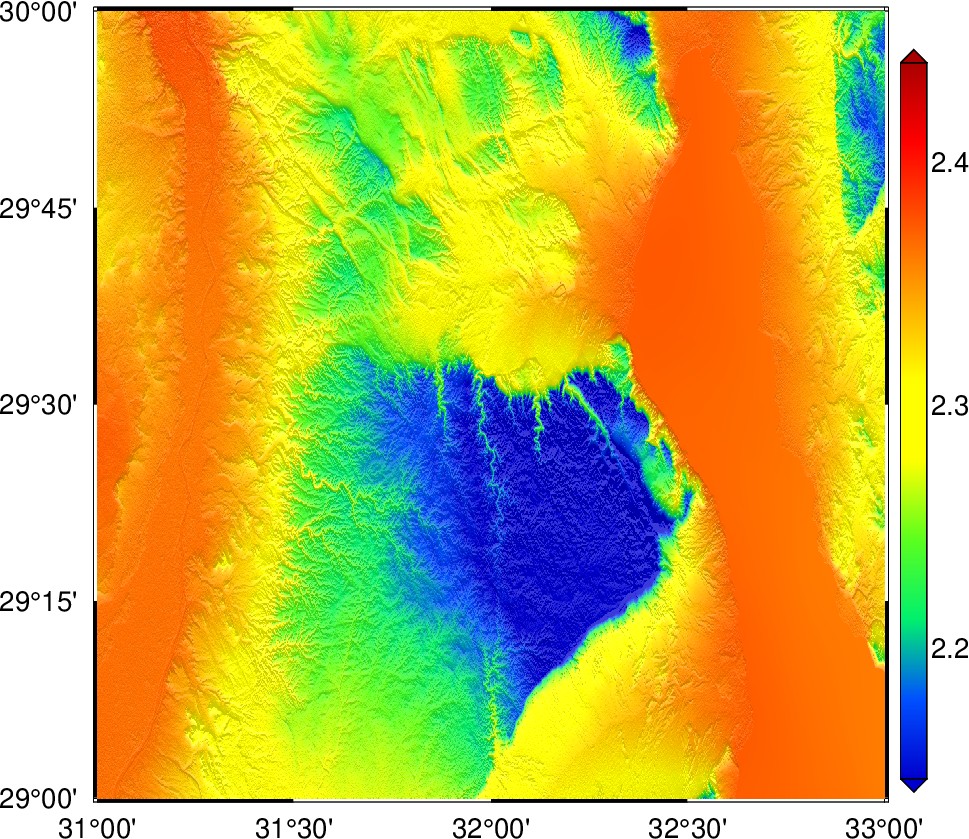
And here’s a dgital elevation model of the area color-ramp-modified from the original ALOS PALSAR High resolution terrain corrected DEM