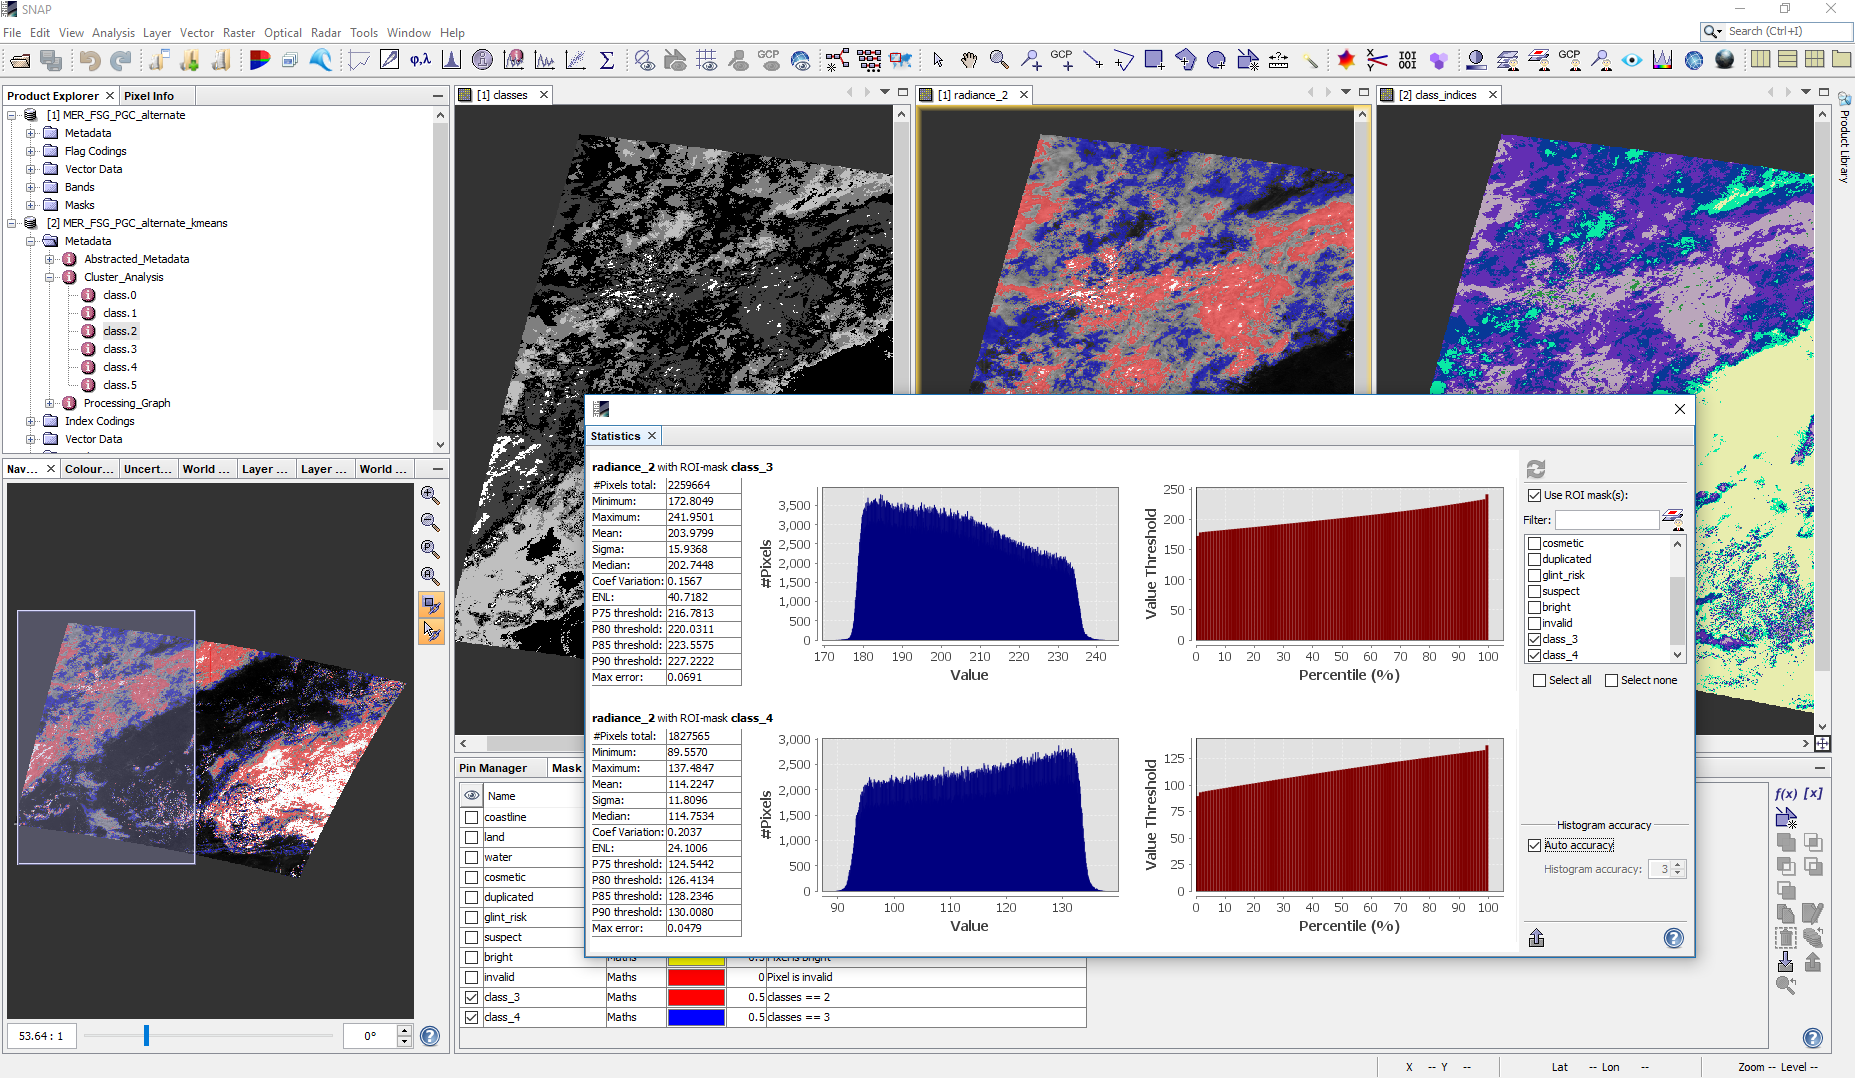
I’ve done a k-means classification in SNAP based on one band SAR image. However, I would like to know the min and max values of each class or other details which will give me more information than Center and Frequency visible in Colour Manipulation. Is it possible to find this kind of information?
This information is not directly provided by the K-Means, but you can compüute it yourself.
Copy the band ‘class_indices’ back into the source product via the Band Math. Then you can create masks based on the class index values. These masks can be used in the statistics window.
Hi - are you able to elaborate on this further ? I have conducted a K means classification on one of the outputs (contrast) of the GLCM and have good classifications which I would then like to use as a mask over the original data? Is this possible and if so can you please point me in the right direction. I do not understand in your post above how to use Band Math to copy the class indices into the source product.
Many thanks
Nicola
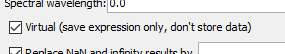
in the Band Math, select your source product as the target for the new band. In the Expression Editor you can select the product with the classification as the source. Then simply use the band as the expression. Disable the Virtual option, so that the data is copied.
In the mask Manager you can then create masks, based on this band.
I’m trying the same, but am unable to succeed with k-means classification.
What’s the way u succeeded?
I used GLCM 4-bands, trying to use one-band as an i/p for k-means, it gives blank data.
Hello,
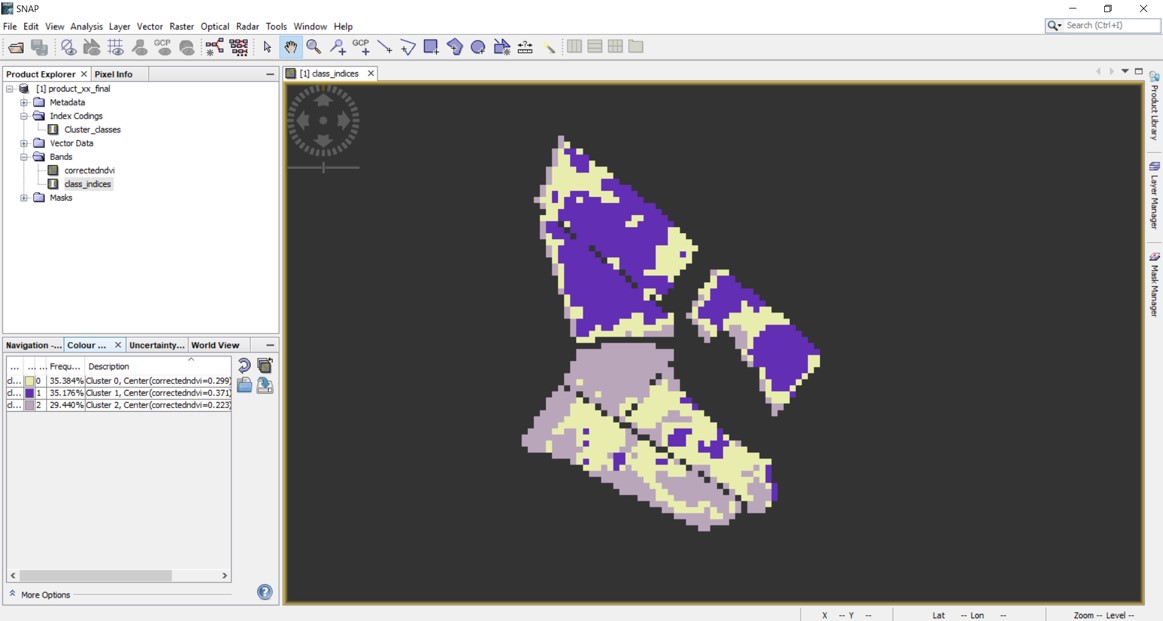
I’ve performed a k-means classification using gpt. I would like to know if it is possible to extract the information in the colour manipulation as in the attached picture using gpt or snappy.
Thanks in advance,
Claudio
Yes, you can invoke the kmeans operator also from the command line via gpt.
type gpt -h KMeansClusterAnalysis
This will show you how you can configure the operator.
But the information of the colour information is only stored with the product.
I guess you want to have it in a text file, or so?
You can open the *.dim file in a text editor when you have saved the data to BEAM-DIMAP. Within this XML file should find the textual information.