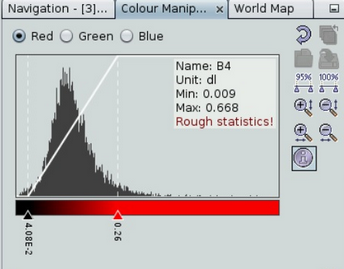
I’ve applied a land/sea mask to the original S2 image because i don’t need the sea in my classification and i want to speed up the elaboration, but after the masking process i found that the pixel values are modified as you can see in the RGB image attached.
Is there something i’m doing wrong or there is a problem with masking?
I think the second image is just visually stretched according to the new image statistics (less blue).
You have to make sure that the min/max values in the Color Manipulation tab of red, green and blue are the same.
SNAP selects min/max values based on the image statistics (which have changed) to stretch the colors over the a suitable feature space for good contrasts. But this does not affect the actual value of the pixels.
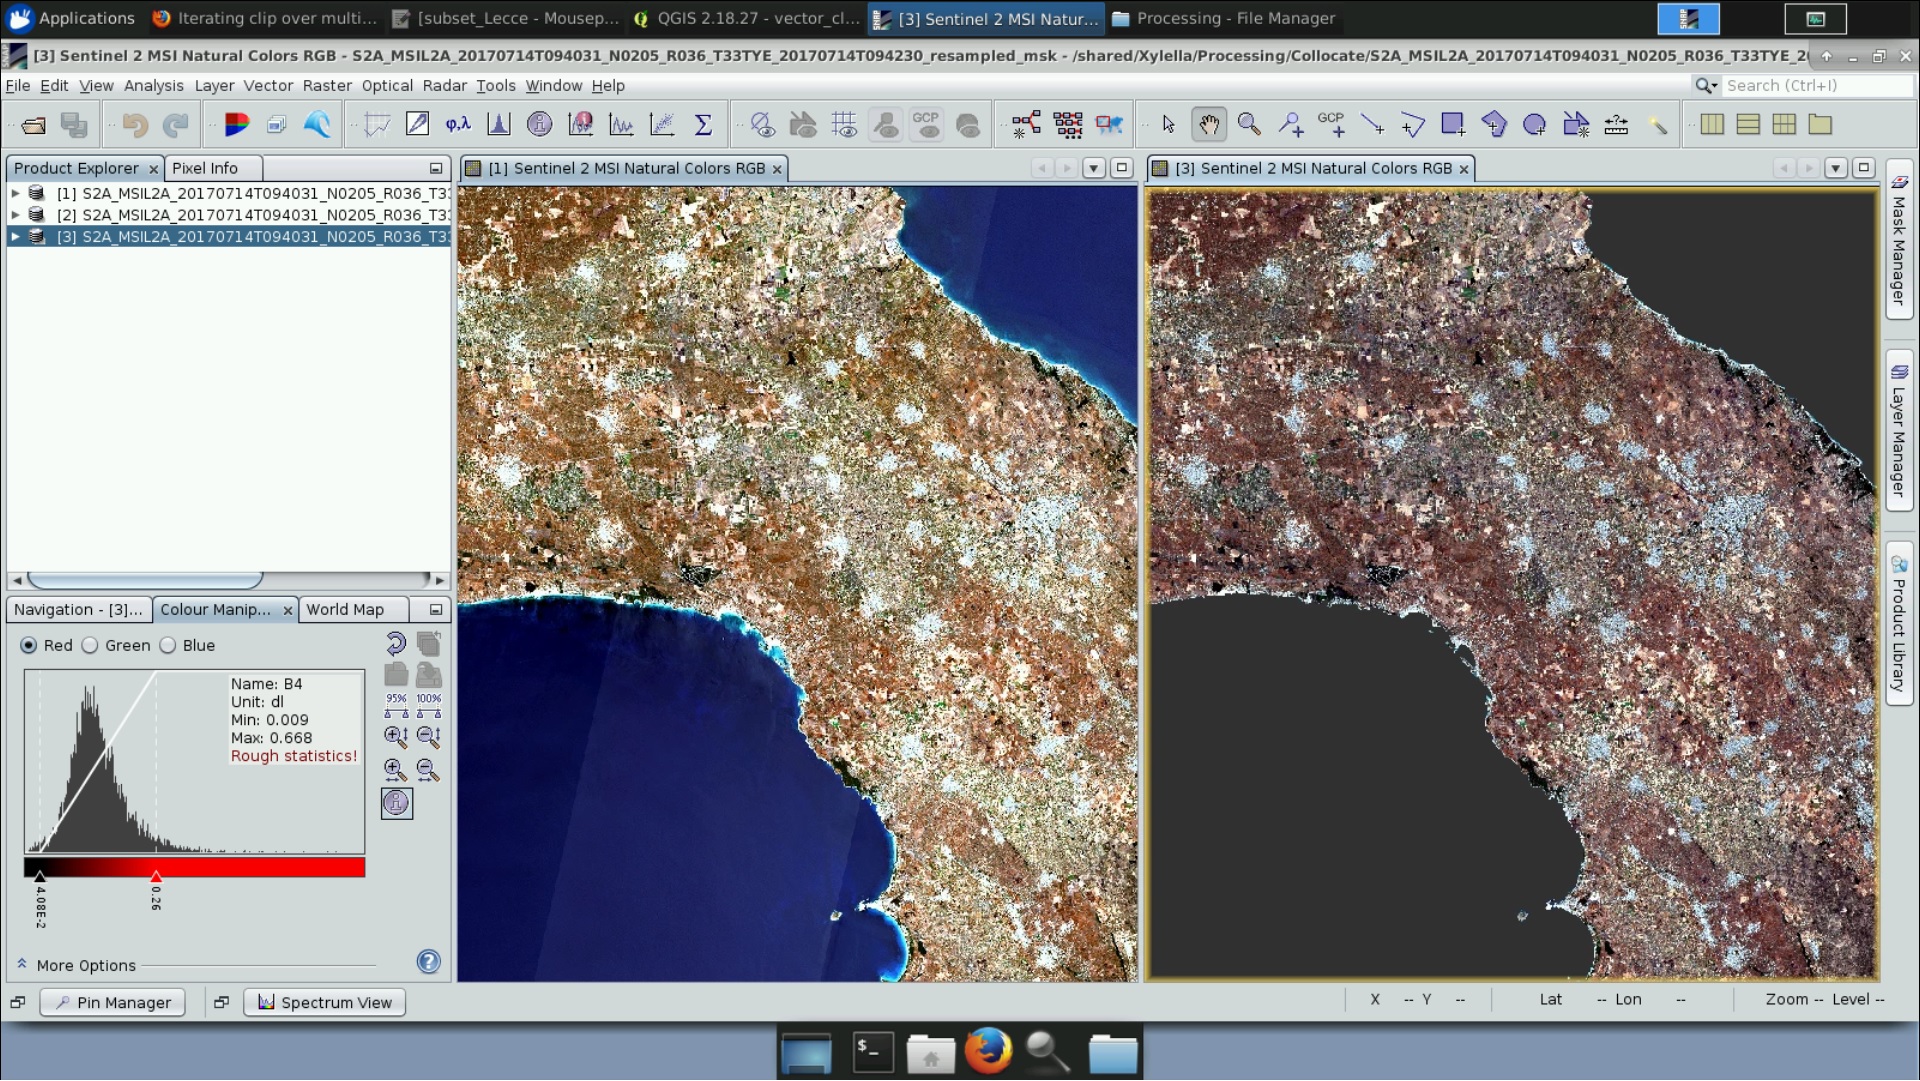
I’ve checked the bands’s value for both the images, here i post only the red one, but the behaviour is similar in all bands.
As you can see min-max values are also changed (i’ve stretched the histogram on 100% range’s values).
So do you mean that SNAP simply “cuts” those values for a visualization purpose, but the true values are saved in the file for classification?
I would like also to highlight the distribution is also changed, is it correct?
yes. The values are not altered but the histogram changes because the frequency of values is now different. This, in turn, leads to different color stretching.
100% is different for both images (because the water areas are missing). Accordingly, your max is 0.93 in the first image and 0.668 in the second. This inevitably generates different contrasts and tones in the additive color mixing.
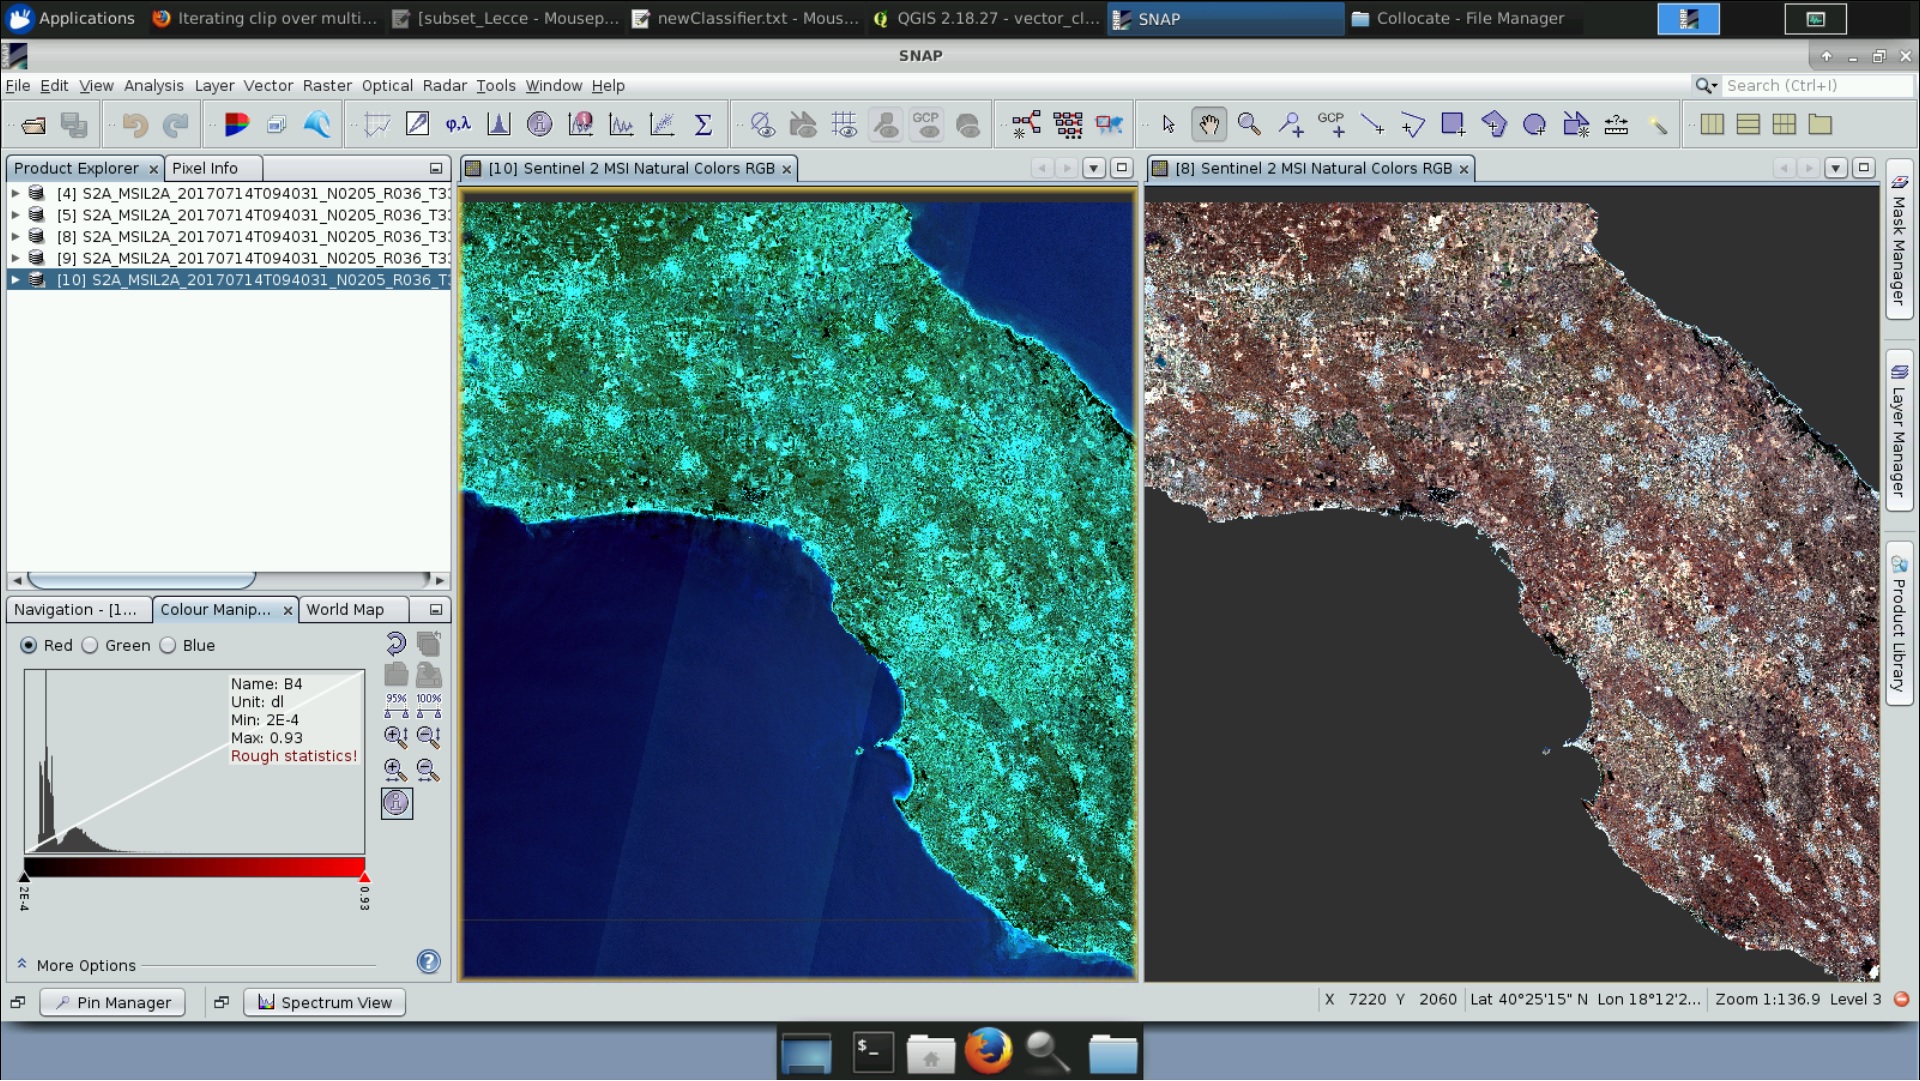
Please click on the numbers and set 0 as min and 0.5 as max for all three colors in both images. Only then you can compare the images visually.
Thanks for your help!
I see what you mean.