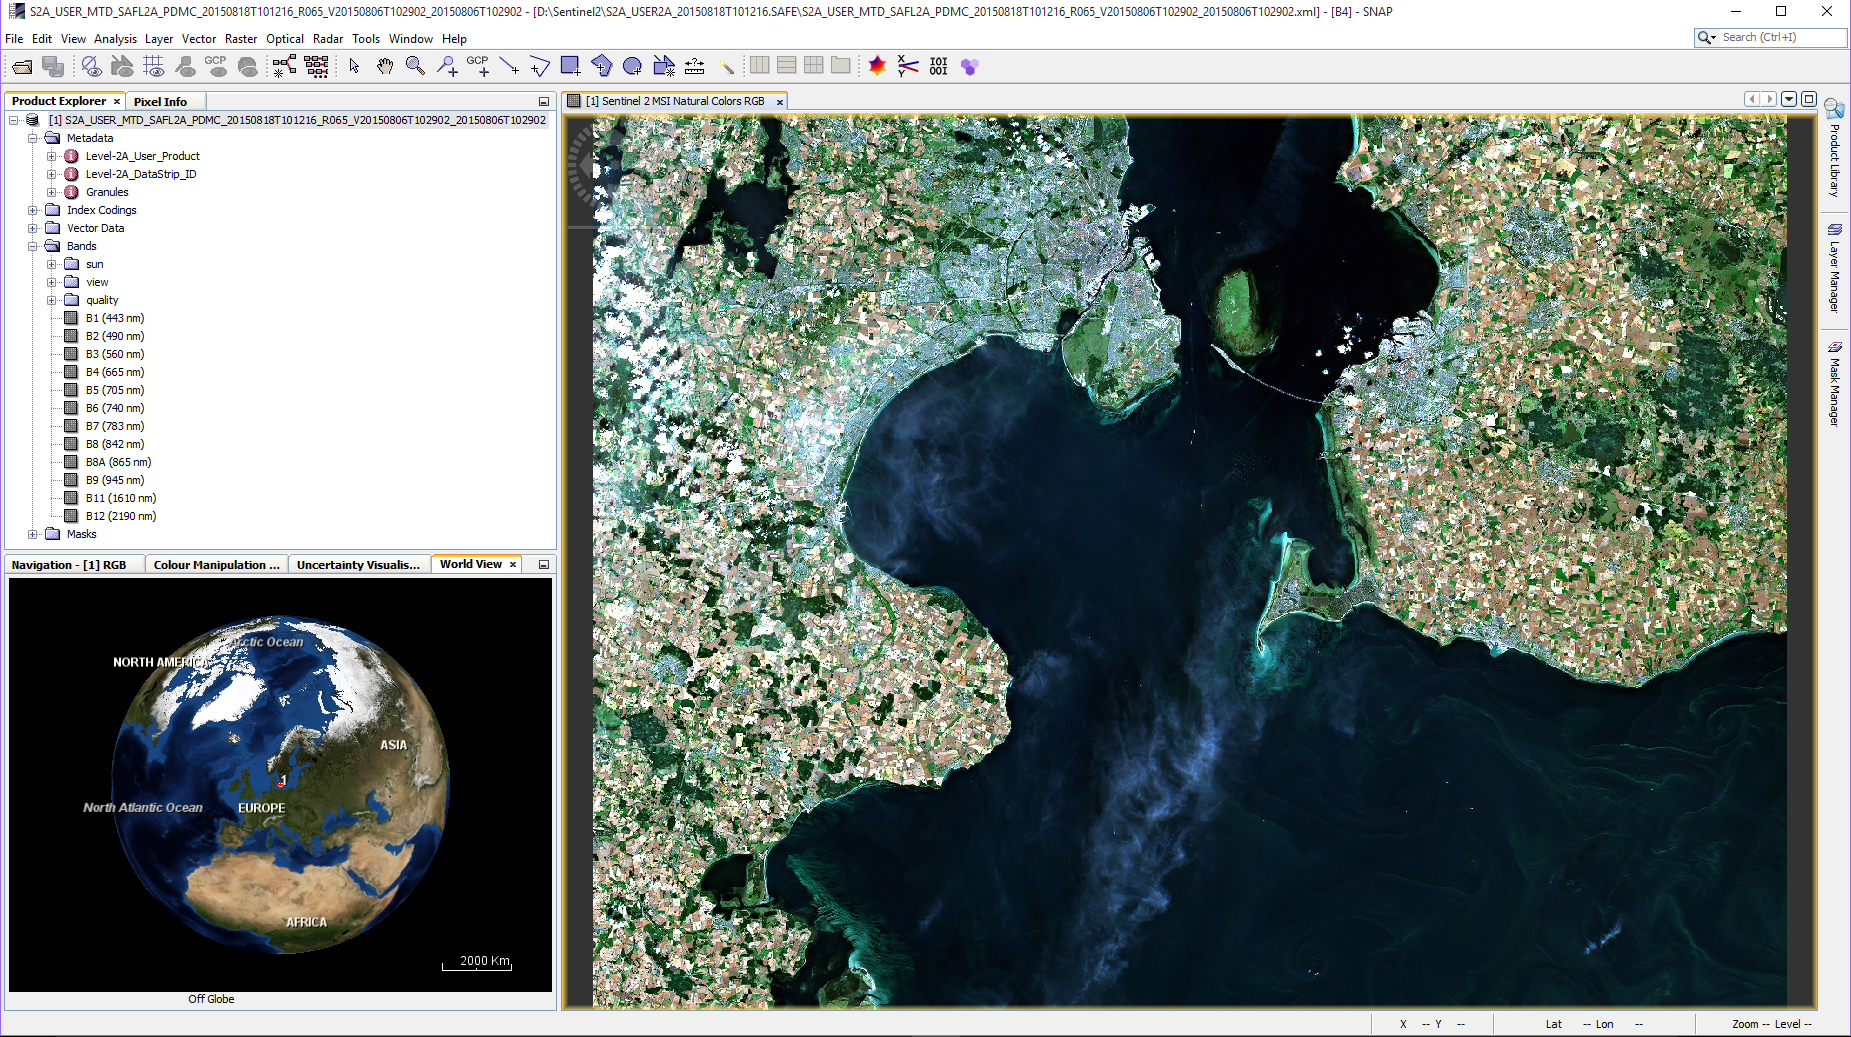
I processed sentinel-2 MSIL1C product using the sen2cor processor in the SNAP 2 toolbox and I can load the processed data package and see a RGB views. My question is visually I don’t see any difference with the Level-1C product and I am not sure if I have to do any farther processing to get BOA reflectance for all the bands in the L2A.
I am wondering if there is any mathematical procedure that I should do to get the reflectance values in each band between 0 and 1.
If I see values in the pixel information they are in dI units I want to convert them to reflectance units (sr2), please help if there is any mathematical relationship for doing that.
I am here attaching the processed sentinel data, I can see in the Meta data that I have the L2A data product but if I see the image in different color combination its similar to the L1C product. In the generated L1A product package I have all the quality indicator maps like AOT, WV and Scene classification maps. Any information if I have missed a step to get the BOA reflectance for each band. Thank you in advance.