How can I perform linear regression analysis between backscatter coffecient and local incidence angle?
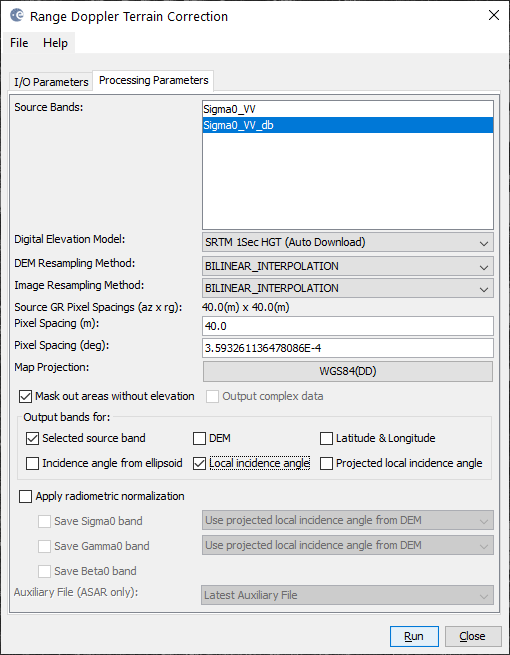
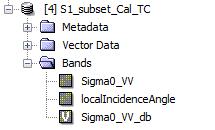
the local incidence angle can be selected as one output of the range doppler terrain correction
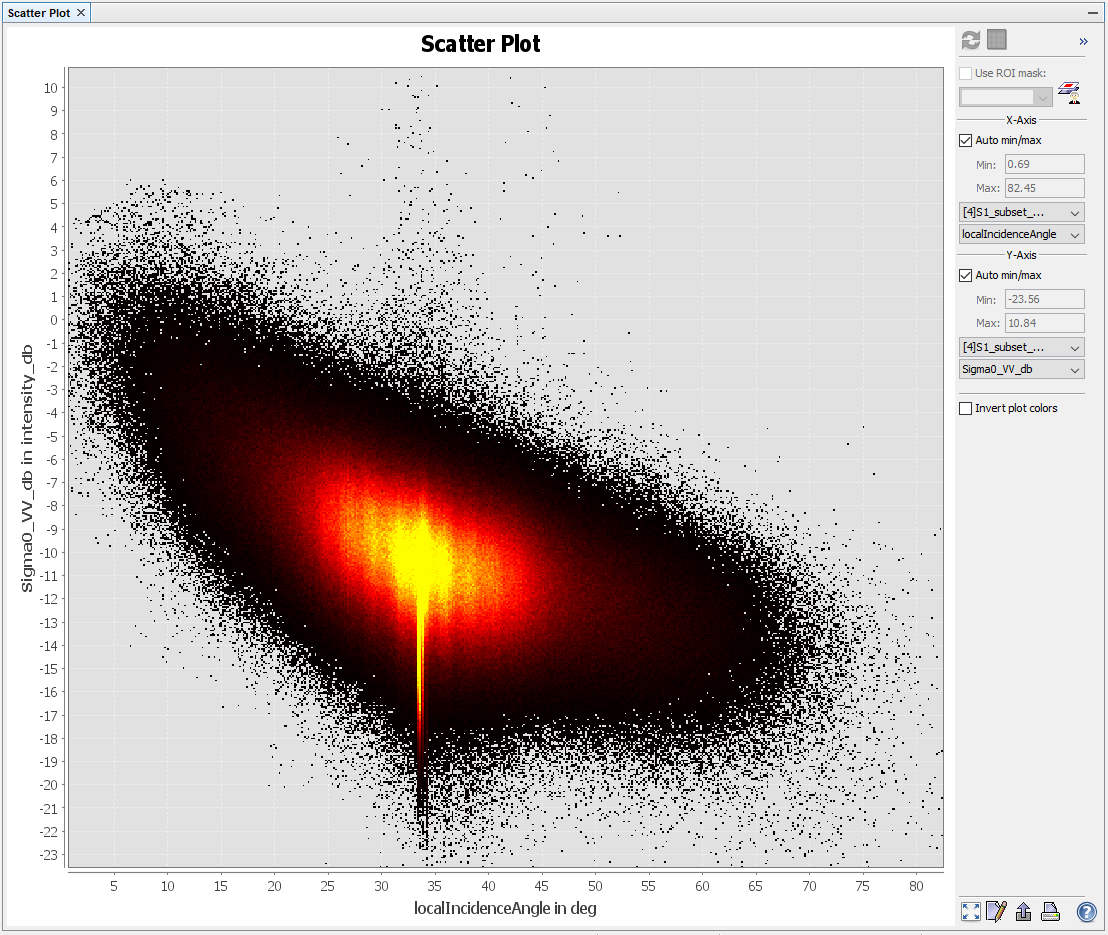
You can then create a scatter plot from the output product ![]()
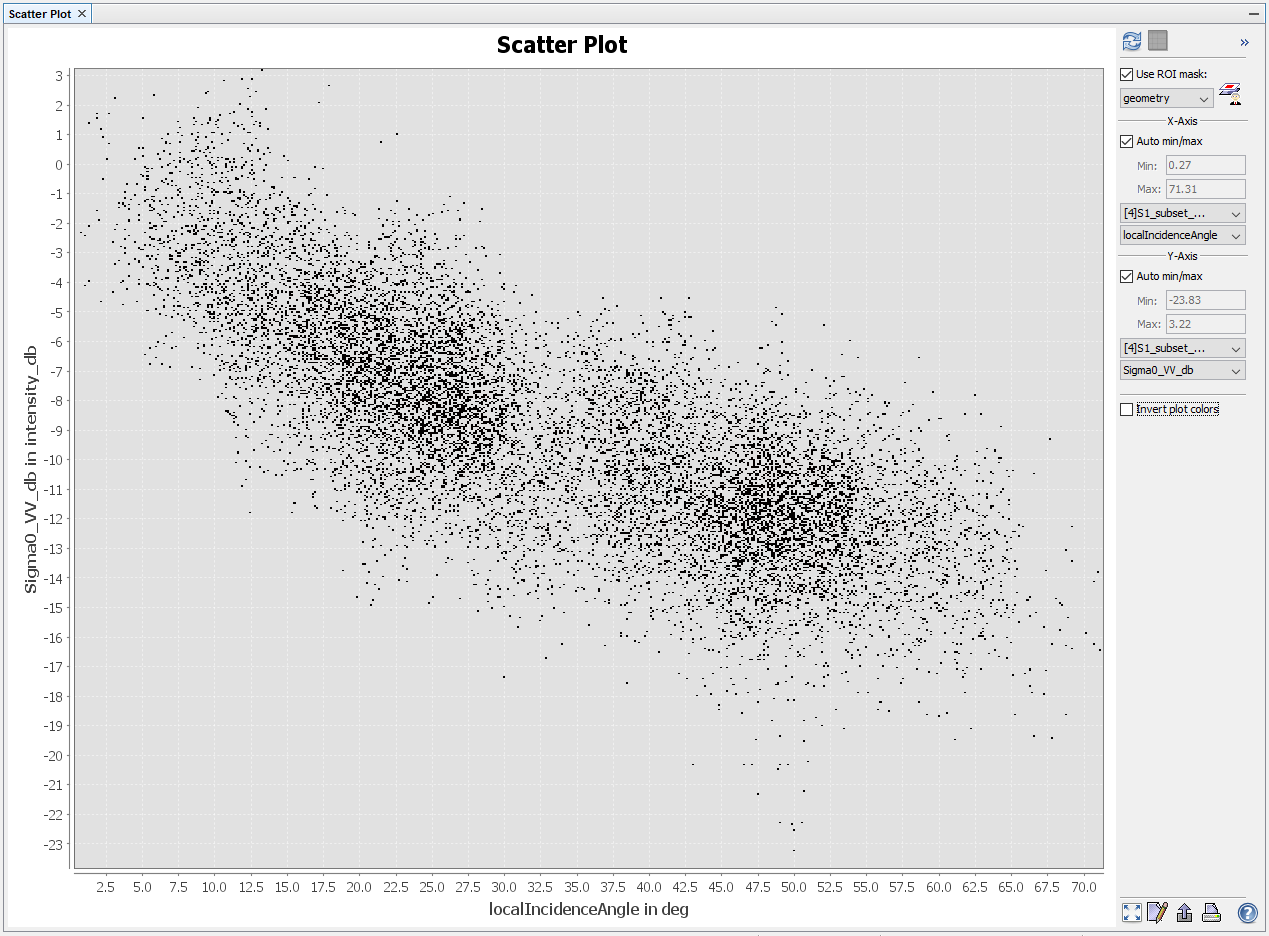
Or you can even select single areas using the digitizing tool
How can we interpret these scatterplot and how they differ from each other?
the scatter plot tells you how the values of the first raster are related to the values of the second. The one at the top is the full image, the one at the bottom was only a small area.
what are those colours represents?
the density of values
Is it possible to find the regression equation from the scatterplot?
this is only possible with the correlative plot view at the moment which takes points as input which have one of both variables already stored as an attribute.
I didn’t get you. 
How can we know about the correlation between these variables?
Please check how it is done in this tutorial: SAR Polarimetry and Analyses
It correlates radar values with building density imported as points (page 17-18) to retrieve a regression.
In your case you need either the incidence angle or the backscatter extracted at these points to plot it against the other raster variable.