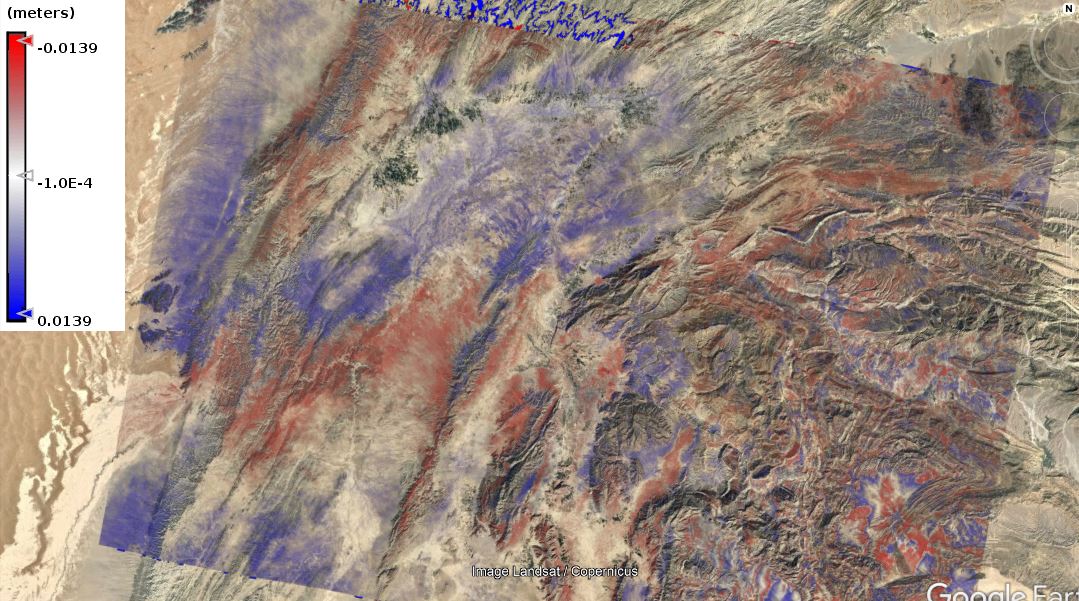
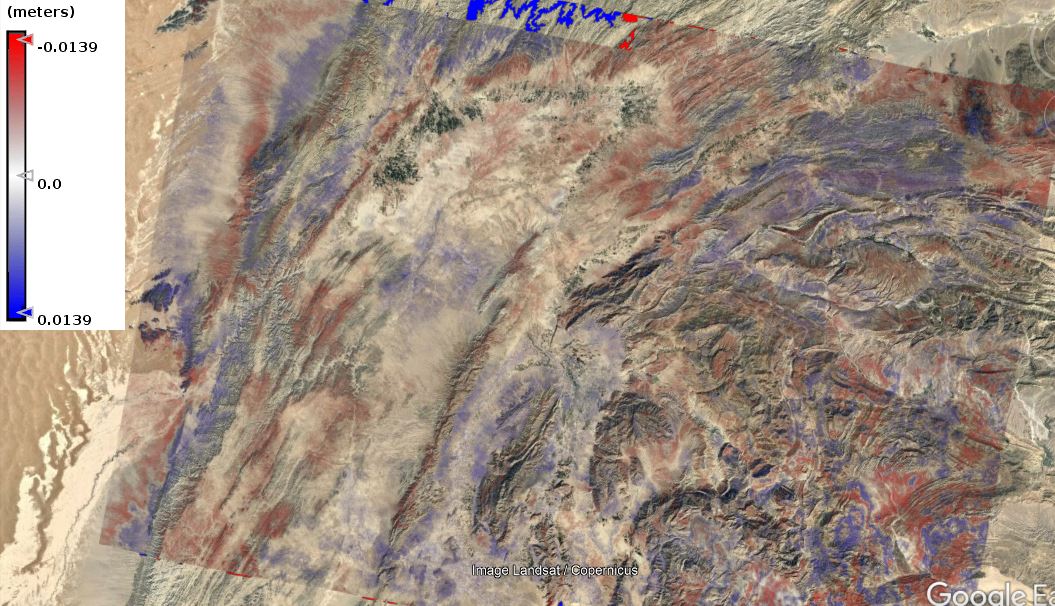
Assuming the topographic phase removal worked, you are seeing atmospheric effects, some of which is topography-related. The displacement-signal is usually smaller than the atmospheric-signal, except in the case of large-enough rapid displacements caused by earthquakes for example.
There is no earthquake event in the used 12 days Temporal Baseline.
How can I reduce or remove the atmospheric Effects?
Even i used Multilook and all other basic steps.
You can try another image pair, at best from a period without rain events.
Sir I have used two other pairs with 12 days temporal baseline, both results have been attached. Kindly guide me.
The process used are, Apply-Orbite-File, Back-Geocoding, ESD, Interferogram, TOPSAR-Deburst, TOPS-Merge, TopoPhaseRemoval, Multilook, GoldsteinPhaseFiltering, SanaphuExport, SnaphuImport, PhaseToDisplacement, TC.
(2019_05_23-2019_06_04)
(2019_06_04-2019_06_16)
good to have a comparison. As you see, the patterns are quite random.
To minimize the effect of atmospheric contributions, you could calculated this about 10 times and then create an average.
Please have a look at the last part of this tutorial: Sentinel-1 TOPS interferometry (suggestions for further analysis).
I also found the compilation for InSAR in ASF nice source for understanding the results
https://asf.alaska.edu/how-to/data-recipes/data-recipes-further-reading/
it is a nice reference.
Sir,
Firstly i have to mention that the above uploaded displacement maps are two different 12 days temporal baselines displacement maps.
Secondly that what did you mean by 10 time process. Either you mean that i have to process one 12 days temporal baseline data 10 times? or you mean 10 other 12 days temporal baseline data 10 times?
Thank you.
yes, you select 10 different pairs with 12-day baseline and individually compute the displacement and then calculate an average out of all. This reduces the impact of atmospheric contributions of single pairs, hopefully leading to a clearer pattern of actual displacement.
It is demonstrated in the mentioned tutorial.
Thank you Sir.
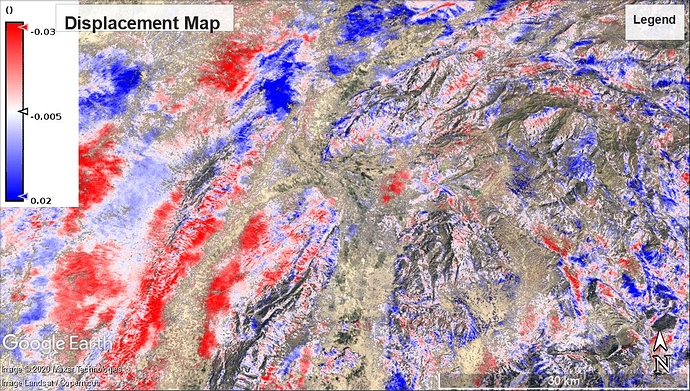
Dear @ABraun i have used 10 pairs of 12 temporal baseline. kindly look at this either these results are trust-able? thank you.
oh, that seems to be quite random and I see no clear sign of deformation to be honest. All patterns are still pretty much related to topography.
So can it be that there is no displacement in this area? Based on this result (n=10) I would not relate any of these patterns to real deformation to be honest.
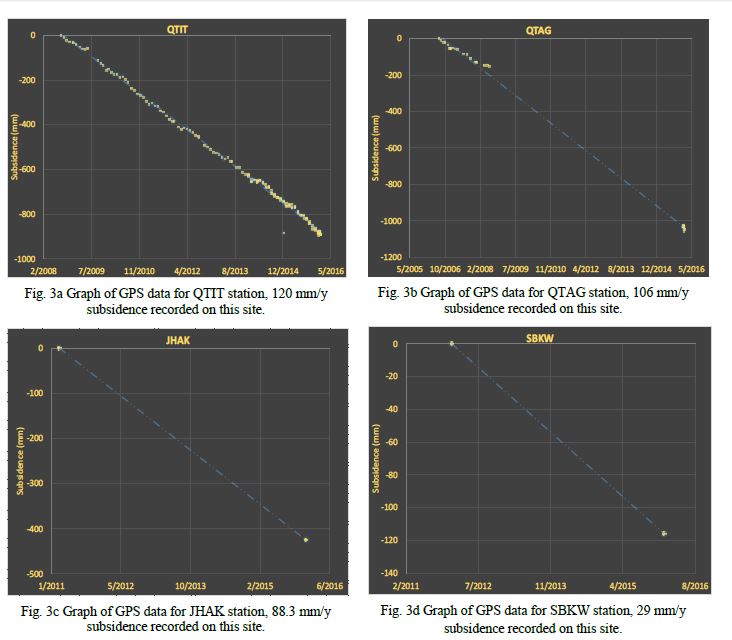
Dear Sir the research article reference have been attached. Kindly read this paper. There is much subsidence in the area and this area lies along the Transform Boundary as well. Here is a screen shot attached of GPS results of the mentioned research article.
Kindly help me.
if its possible prepare a tutorial with all steps for displacement map. it will help all other user as well.
thank you
Kakar, N., Kakar, D. M., Khan, A. S., & Khan, S. D. (2019). Land subsidence caused by groundwater exploitation in Quetta Valley, Pakistan. International Journal of Economic and Environmental Geology , 10-19.
There are numerous subsidence maps for Quetta, maybe it is good to localize their displacement and compare it to your patterns.
Thr measurements from the reference show subsidence of to to 10 cm per year while yours largely range between +1 and -1 cm per year. I think the atmospheric disturbance superimposes these displacements in most image pairs. Did you select images from the dry seasons?
Otherwise you might get more stable results with persistent scatterer interferometry StaMPS - Detailled instructions
I will conform the season from Pakistan Meteorological Department. But I am sure these pairs are of dry season’s.
If there is some pairs that have rain or snow, so can i use some other pairs instead of those to complete one year data? I mean can we use any 29 pairs from 2015 to 2020 that have dry season and we suppose these 29 pair of one year data?
the shorter the temporal baseline, the lower is the impact of temporal decorrelation. In turn, if there is no notable deformation within 12 days, the interval might be to short.
Any 12-day image pair can only represent the deformation rate within this time. It does not show you if the subsidence accelerates or slows down over time. So if you want to observe long-term (maybe non-linear) displacements, you have to calculate suitable image paris from different years and compare their results.
But this only works if there interferogram is not affected by atmospheric contributions too much.
This coherence and phase are of a pair of 12 days Temporal baseline. The acquisition dates have zero % clouds.
Sir kindly look at this.
I used this method
S1A_IW_SLC__1SDV_20200118_20200130_IW1_Orb_Stack_Ifg_Deb_mrg_dinsar_ML_flt_Disp_coherence.bmp (1.8 MB)
Are you sure that you have remove topographic phase (at best with the checkbox in the interferogram generation tool)?
These are quite large fringes for an area with only local subsidence.
You can also compare with the in interferogram provided here: https://comet.nerc.ac.uk/comet-lics-portal/
Edit: looks similar: http://gws-access.ceda.ac.uk/public/nceo_geohazards/LiCSAR_products/151/151D_06038_131313/interferograms/20171211_20180104/20171211_20180104.geo.diff.png
here i removed
Really strange patterns for a differential interferogram, I don’t know…


