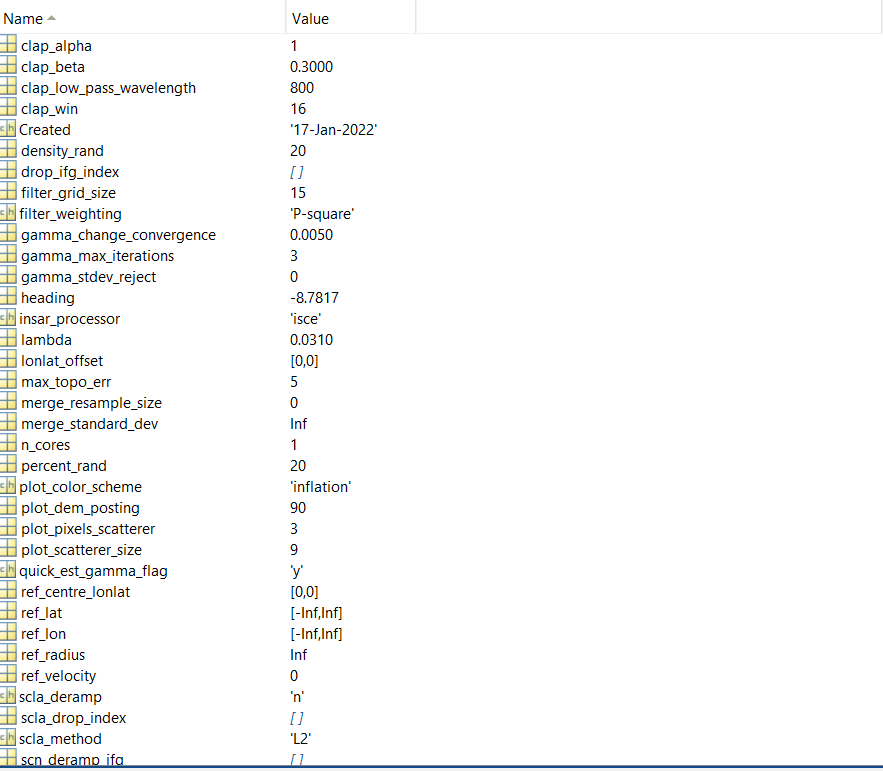
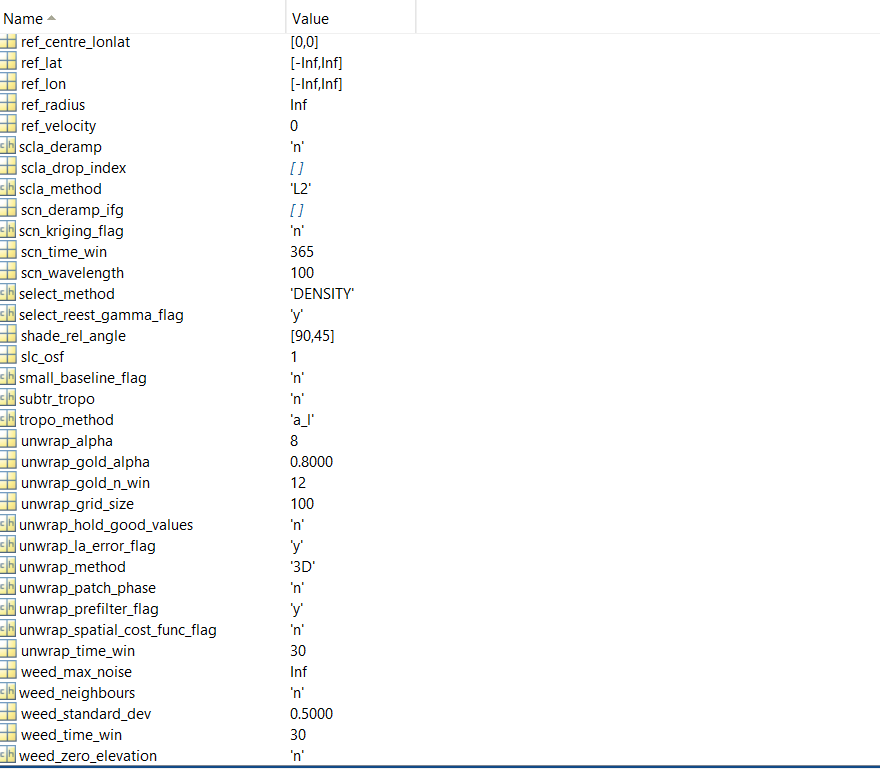
I am trying to figure out why StaMPS default params sets SBAS processing density_rand to 2% and weed_standard_dev to inf while default params for PS is 20% for density_rand and 1 for weed_standard_dev…
Is it preferable for SBAS to have low random phase (high temporal coherence ?) and no weeding based on standard deviation? I get a lot of points this way but I’m not confident they aren’t just noisy pixels. I am not performing resampling as I want to analyse small contexts.
My objective is to identify slope stability in motorways.
I’m also trying to identify slope stability but in my experience with StaMPS the data seems to be noisy even in urban centers where the coherence is surely very high. Though I can identify a downward trend with StaMPS the data is noisy. Maybe it’s the atmosphere. My study areas tend to be in Southeast Asia where it’s humid. Maybe that might have an affect. I didn’t use TRAIN to correct for atmospheric delay.
When i use SBAS (using MintPy, not StaMPS) the data is very stable and the downward trend is easier to interpret. The data is also atmospherically corrected using ERA5 data.
Nowadays I tend to use SBAS for my final outputs but I still try to use StaMPS PSI methods to see if it can work since it is a popular algorithm. Just sharing my experience.
Any ideas how to reduce the noise in PS results? What parameters should I pay attention to? I have a similar problem attempting to repeat StaMPs PS processing results but mines are much noisier.
Technically, noise is handled with the amplitude dispersion threshold at the beginning, the grid size and filter in step 2, the density of random phase candidates in step 3 and most importantly the standard deviation in the weeding of staff step 4.
But generally, PS is designed to mainly keep the stable scatterers, so it also depends on your case where the phase comes from and what is the best choice to deal with it. Maybe you can share some screenshots of your results.
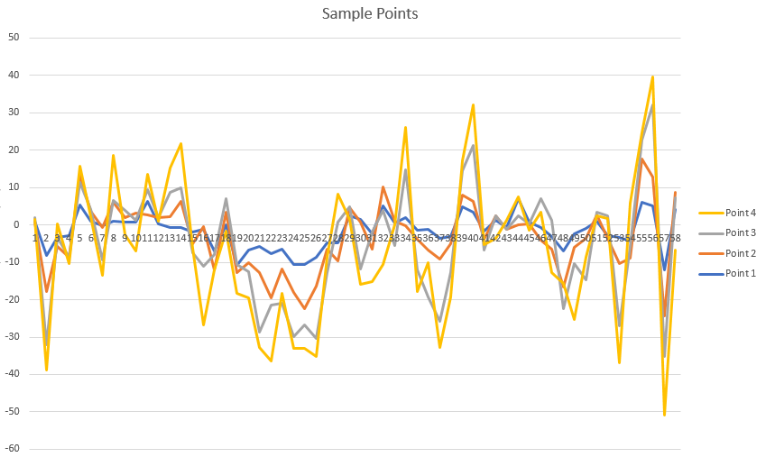
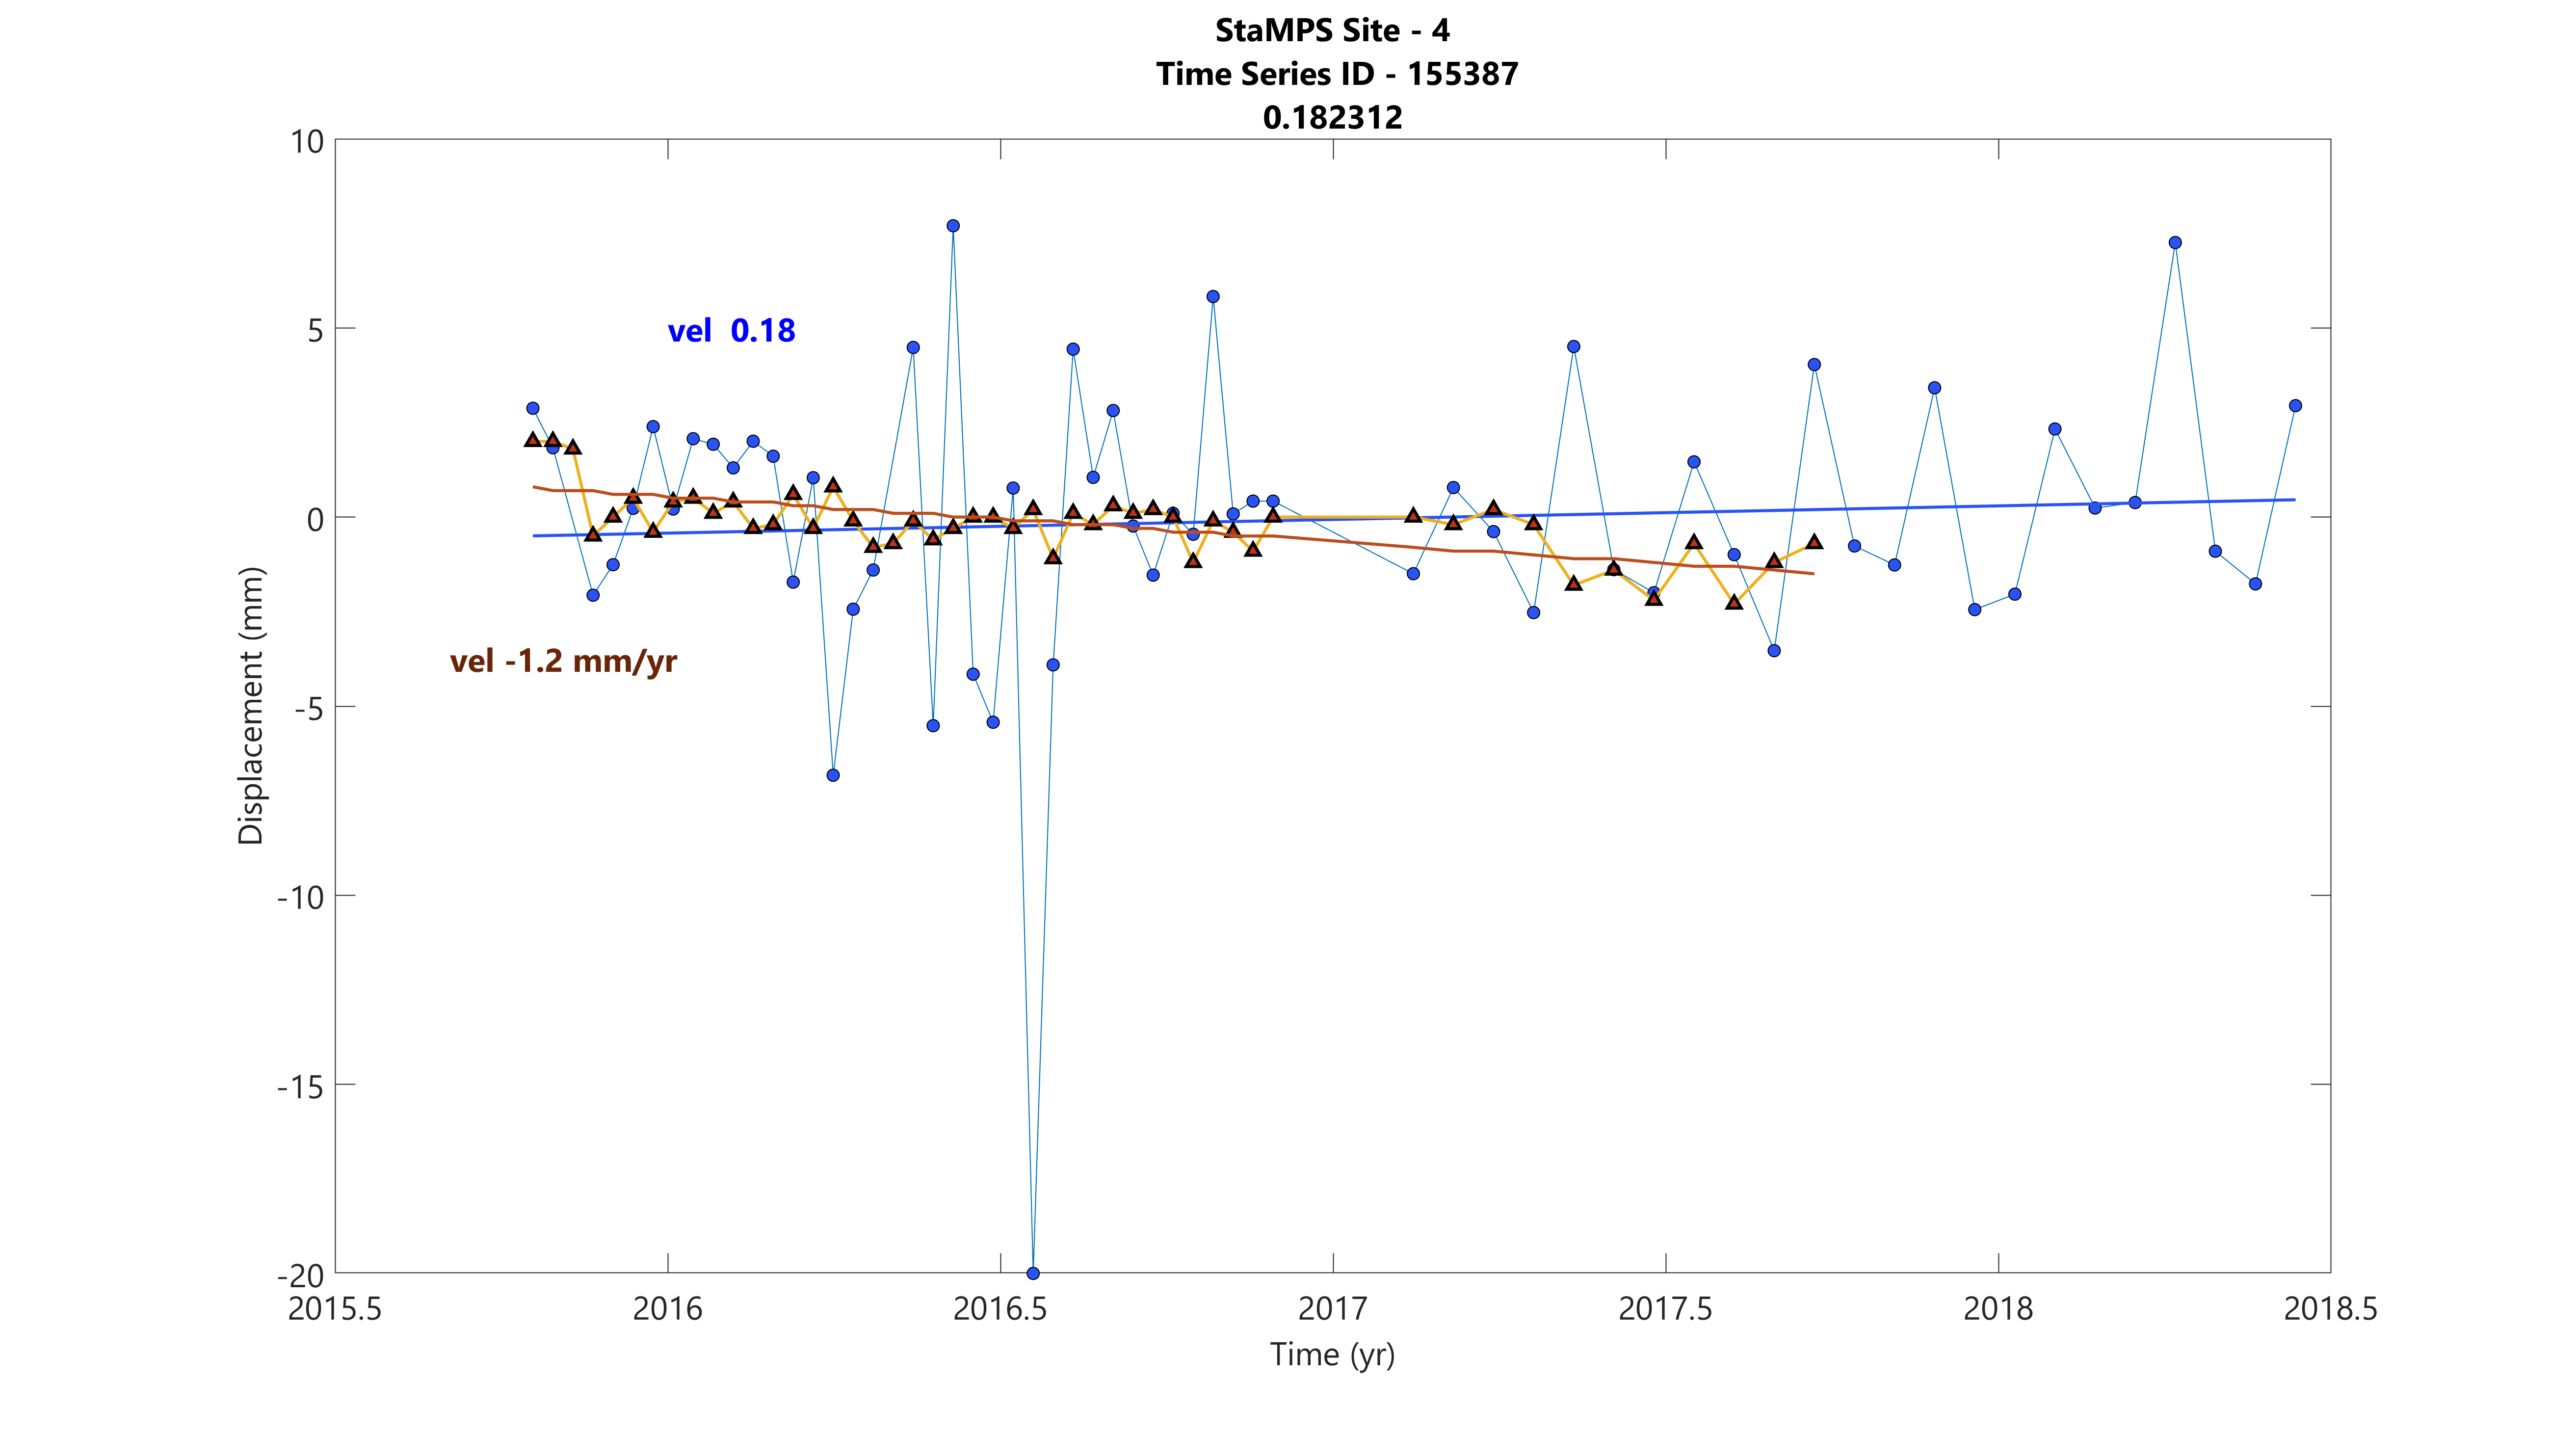
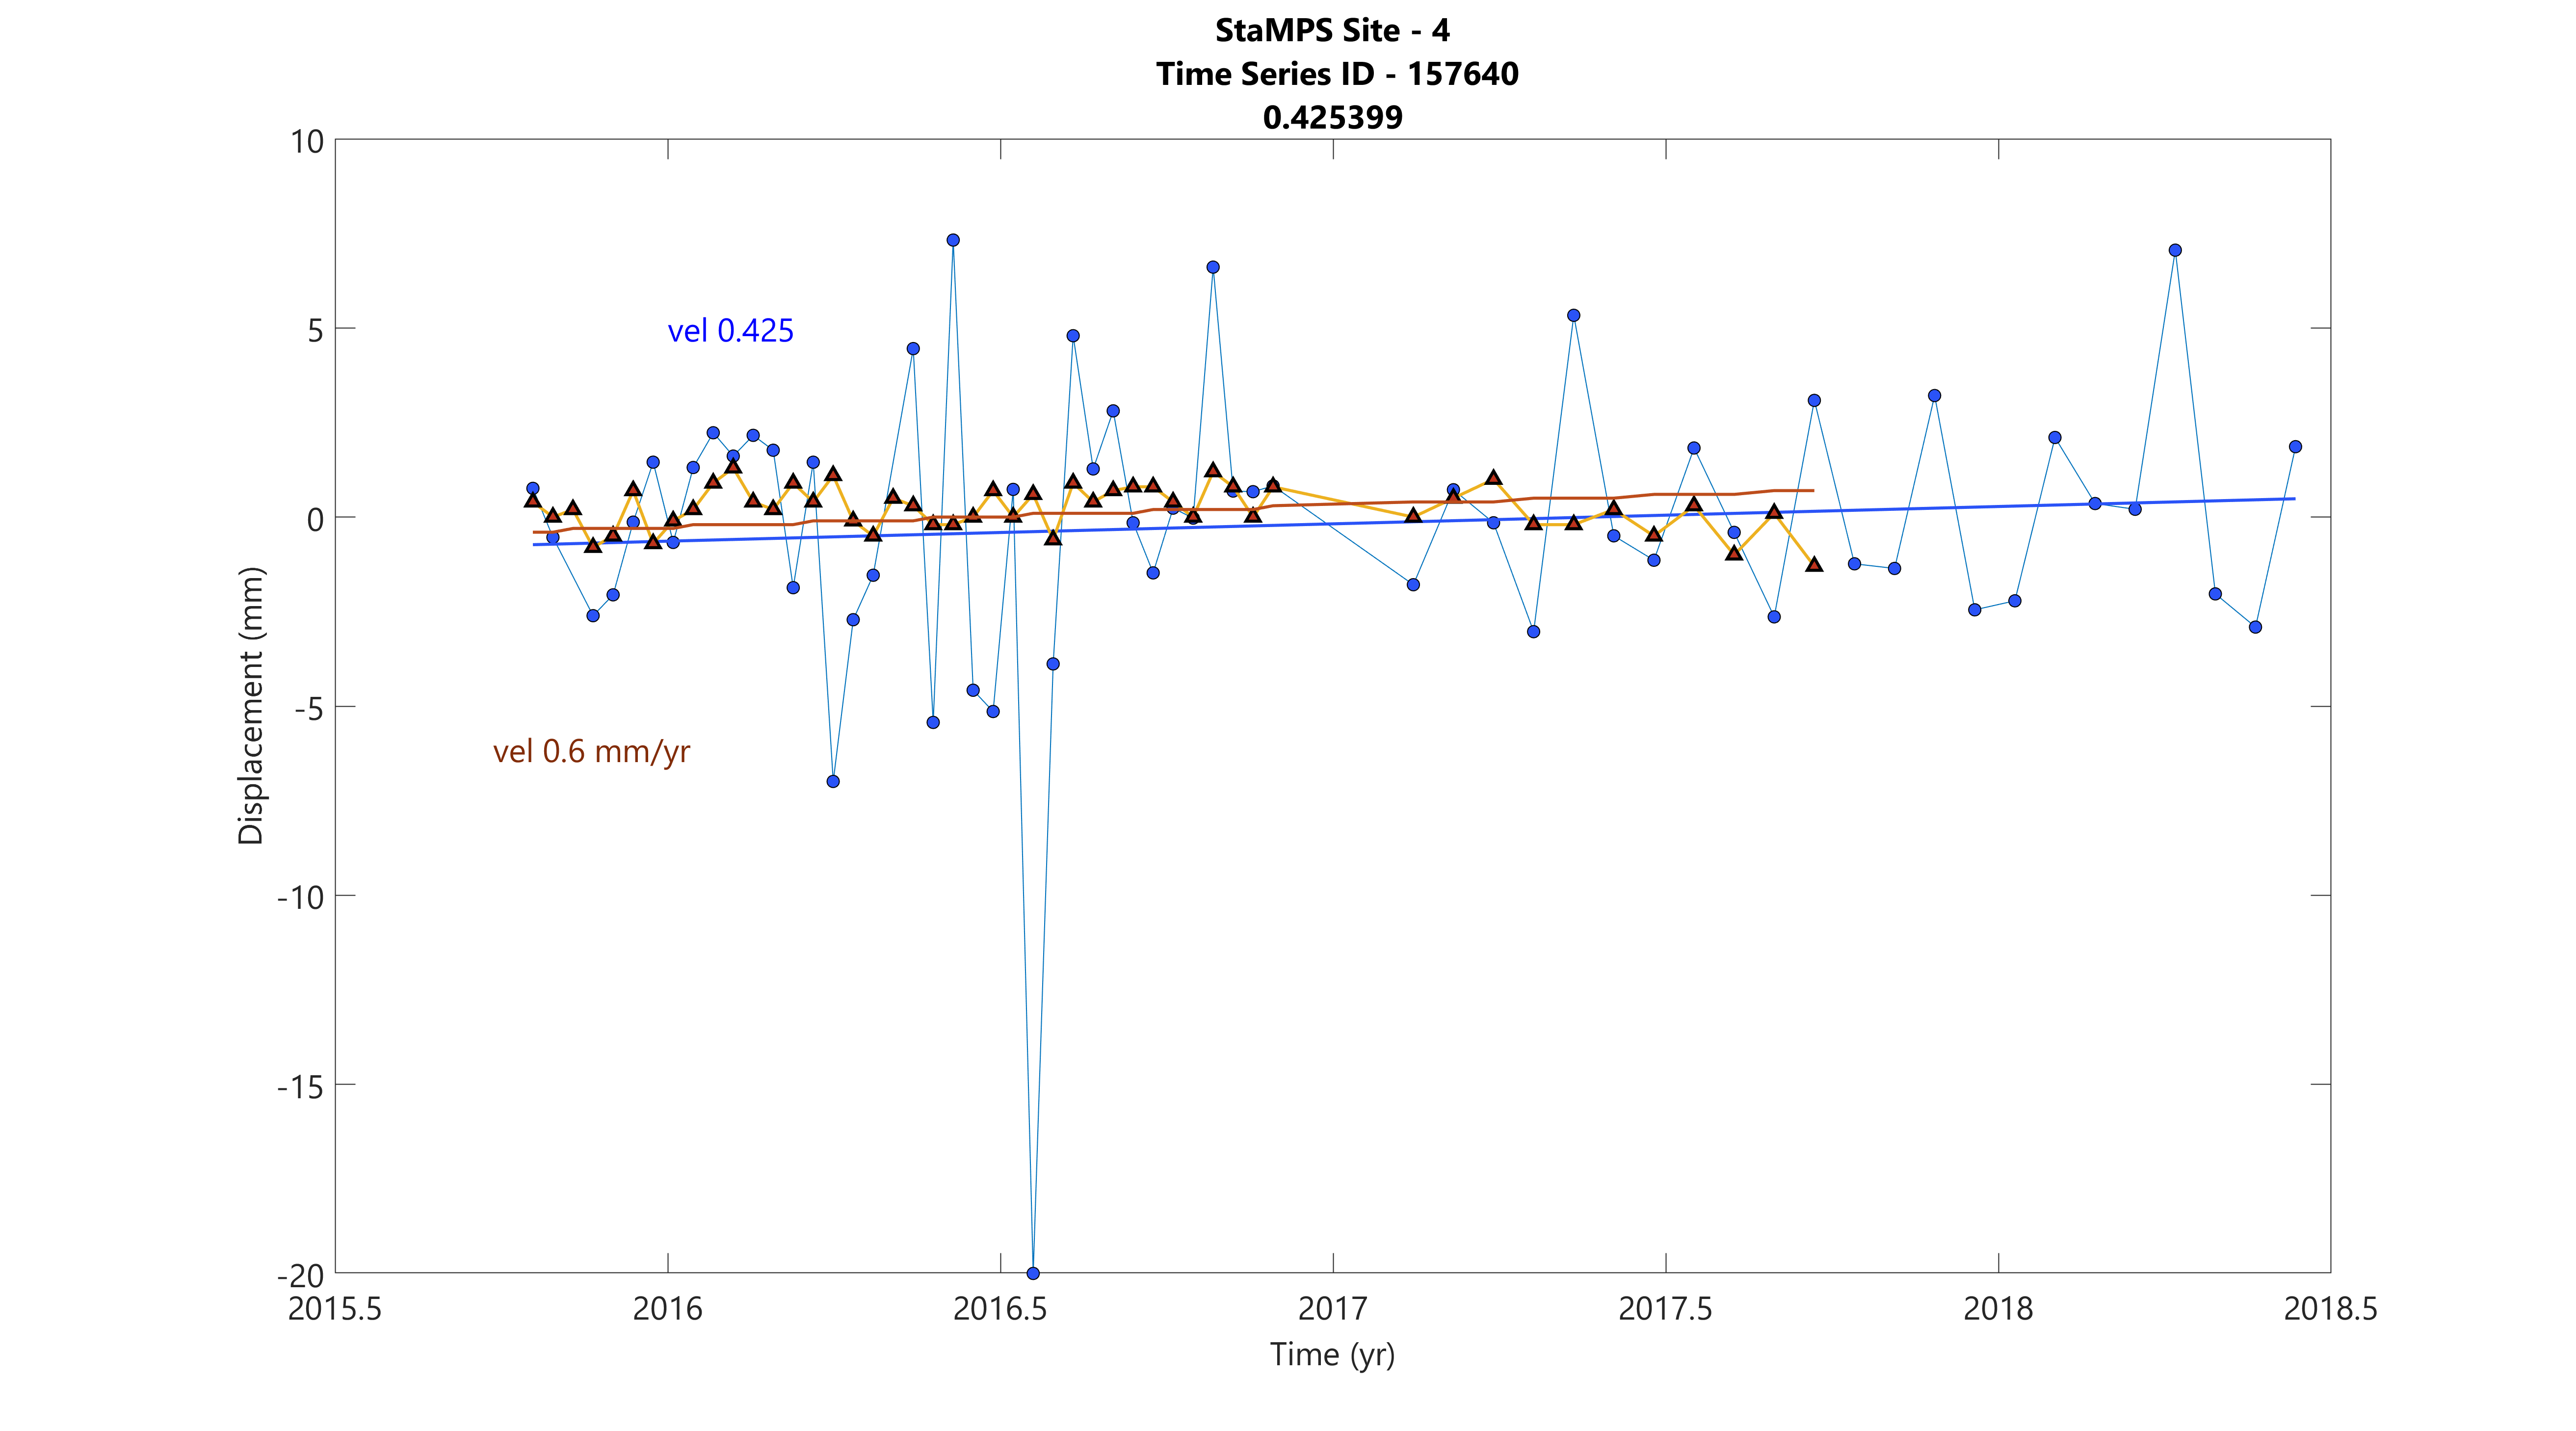
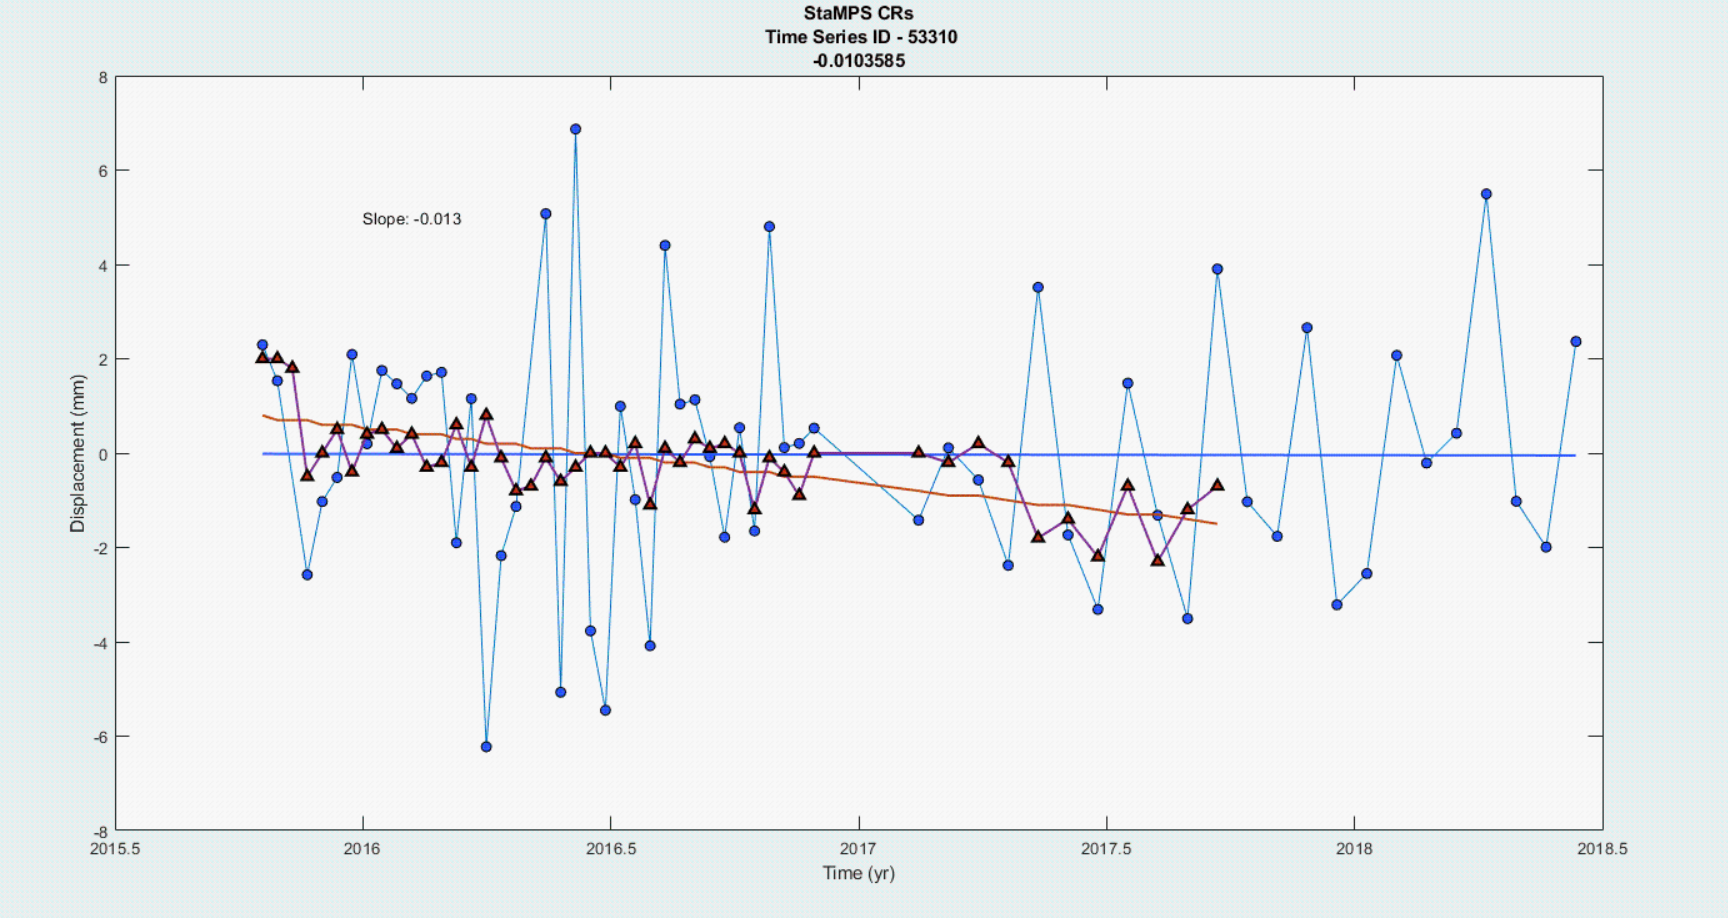
Thanks for responding. Here is data from installed aluminum corner reflectors in my study area in west Florida, collected using TerraSARX. The blue is my ISCE to StaMPS processed data for 2015-2018, while the orange is from a colleague who first completed the processing for 2015-2017 using Doris to StaMPS. I’m tasked to reprocess the data with the later dates and replicate his processing but he does not have the parms he used for stamps.
So far, I have changed the weed_standard_dev multiple times and noticed it had significant effects on the ps density. But I’ve never adjusted the amplitude threshold from 0.4 when I used mt_prep_isce. I focus on small-scale deformation in Florida (related to sinkhole movement, usually within ~5m in diameter). Would a lower filter_grid_size closer to the 5m be best?
I also plan to complete a MODIS troposphere removal; however, I’m unclear what sub-datasets from the .hdf file are necessary for the processing or how to prepare them.
Looks like the StaMPS result are already reduced to to more stable points or even smoothed in a stronger way than with ISCE. So I wonder if more aggressive weeding or a lower ampltude dispersion value will solve this. To me it looks like you would rather get similar results by relaxing the criteria so more variation is allowed (as with the blue line).
The main challenge is that ISCE and StaMPS are not fully comparable in terms of data processing.
I’ve been reading on ionospheric influences on different antennas, and even though the effects are not as apparent on X-band images, I’d like to see how removing them in isce would affect my ps quality StamPS. If you have any suggestions or advice related to this, I’d also appreciate your input!
@tonianr
As I checked your previous topics, I found that you used the “stackStripMap.py” instead of “stackSentinel.py”. Could you share the reason for that choice? Is there any merit to stackStripMap over stackSentinel, at least in your case?
May the combination of stackSentinel/StaMPS give better results.
Thanks for the informative reply,
Indeed, I didn’t think that there was a relation between the products mode and mentioned applications.
As far as I got pleasant results even for the small area deformation such as landslides (with high topography variations), I suggest you try the IW mode of S-1 and use the stackSentinel/StaMPS to do your MTI.
Now, I’m trying to implement the SBAS and compare it to PS results. But as I see it, there is a missing link between the ISCE results and the preparing process for StaMPS (SBAS). I mean, while we are going to perform the SBAS, must consider a multi-master stack instead of a single master. So,one issue is the “input_file” contents (like: slc_stack_reference) to run “make_single_master_stack_isce input_file”!?
In other words, the highlighted matter is the process of preparing ISCE results for StaMPS SBAS.
How to dive into and determine the several MASTER?
What I did till now:
To get the ISCE results, have been used the stackSentinel.py and SLC workflow: stackSentinel.py -s /…/SLC/ -d /…/DEM/demLat_N31_N32_Lon_E050_E051.dem.wgs84 -o /…/SB_MirAhmad/orbits/ -a /…/aux_files/ -b ‘… … … …’ -c 3 -W slc
Run all run_files without any error and got the results.
Run “make_single_master_stack_isce input_file”,
Run the “mt_prep_suggestion(‘n’)” in matlab (INSAR_date Directory) to get the pleasant number of patches.
Run the suggested mt_prep “mt_prep_isce 0.6 22 2 50 200” (0.6 (amplitude dispersion) for SBAS).
As far as I undertand from Hanssen 2001 and Hooper 2012, phase stability is a measure of the phase’s standard deviation from a mean phase value across the time series, in other words, the extent of the propagation delays in multi-temporal SAR images between +pi and -pi, meaning that the abrupt change in phase though time for example from 20 degrees to 90 degrees would be considered as temporal de correlation. Please correct me if I am wrong
My question is,
In step 2, Is γ (gamma), which indicates the phase noise level, also known as measure of phase’s standard deviation from a mean value, or temporal coherence ?
is the mean phase value calculated temporally from a single pixel across all the interferograms? and therefore if the pixel’s phase history shows abrupt changes through time, will be discarded?
If I understand correctly, why is this step iterative since we set a threshold of standard deviation of phase values?
I hope if you could elaborate this, would really help me get the full picture of how StaMPS step 2 functions @ABraun@mengdahl@mdelgado
Please correct me if I am wrong but I believe that gamma is the temporal coherence.
Phase noise is calculated in step 4, which results in phase max and phase std.
The process of step2 is iterative as it tries to identify the point height, and its dem error (point height difference from SRTM height) from the total phase and then removes that for the signal until reaching a convergence. If does not converges it drops those pixels.
The threshold you mean you fix is which parameter exactly? if weed_std or weed_max these are used on step 4.