I’m very new to SNAP so apologies if this is basic. I am trying to show a specific nm on the map minus the rest of the spectrum and bands. This would be at BOA. I have attempted spectral unmixing but got stuck. Are there any guides out there which I could use?
Hi,
I’m not sure if I understand you correct.
You want to see the values at a certain wavelength?
SNAP can only show the values which the sensor has measured.
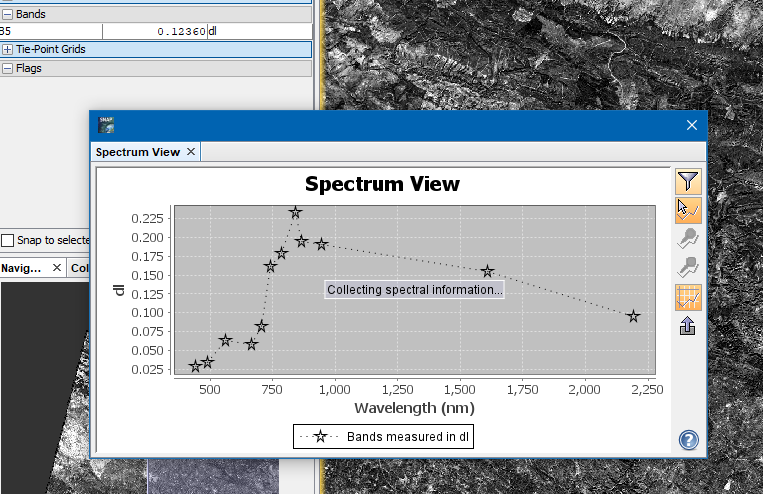
For Sentinel-2 the measured wavelengths are 442.7, 492.4, 559.8, 664.6, 704.1, 740.5, 782.8, 832.8, 864.7 , 945.1 , 1373.5 , 1613.7 ,2202.4
To get BOA values you need to use the level 2A data of Sentinel-2
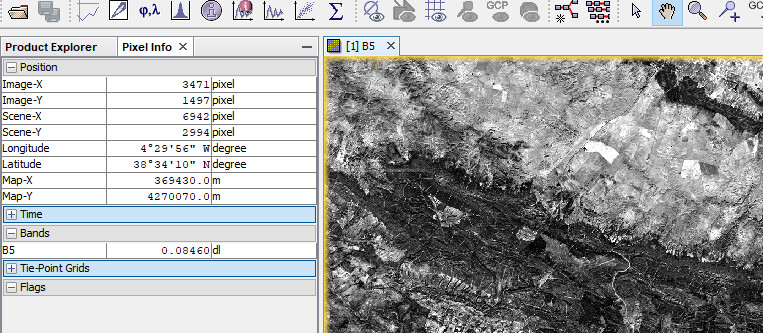
SNAP shows the values of those wavelength bands in the Pixel Info View.
If I want to find areas where a specific wavelength is found, that is not one of those you specified above, is it impossible to see it? Or do I look for the wavelength closest?
For example, I would like to see where methane pollution is located in the BOA near cattle ranches. Is this possible?
I had a quick look at this document: Airborne measurements of atmospheric methane
column abundance…
As methane is absorbing in a narrow bandwidth at ~1650nm, this is covered by the 1613 channel.
In the document some other sensors are mentioned. It has a bandwidth of 86 nm. So the methane wavelength is included and the channel should be affected.
If this is enough to detect methane clouds, I don’t know. Probably some specific sensor is more appropriate. Specifically intended for the methane observation is Sentinel-5p. ESA - New Space satellite pinpoints industrial methane emissions
The data can be opened in SNAP but it is not specifically supported.
Better you have a look at the Atmospheric Toolbox