Hi all. What could be maximum displacement value that could be reliably modeled using Sentinel 1 ?
What is practical range? For example is >20 cm in one and half year possible?
The total displacement is not the relevant limit on measuring with Sentinel-1 InSAR. The important limit is how rapidly the displacement changes horizontally (the displacement gradient) in the interferograms. If you form interferograms with time intervals up to 24 days, then the maximum displacement gradient over 24 days (or whatever time interval you use) that you can measure is about 3 cm over 200-300 meters. In your example of 20 cm total displacement over 1.5 years, if we assume that it has a linear rate in time the displacement in 24 days would be less than 1 cm, which should be easy to resolve unless the displacement is in a very small area <100 m wide.
We can use Sentinel-1 InSAR to measure displacements from earthquakes that are up to 2 meters or more if the displacement gradient is below the limit.
3 Likes
Thank you
In one time event, like earthquake, I understand large displacement modelling . One intefereogram before and after image and just unwrap . But if I have stack of intefereograms then time goes to game. It seams not so easy anymore. It could be nonlinear, rate is usually unknown , coherence loss in sutch harsh rate ect . Is it reliable and controllable ?
Does calculation methods also put some limits to displacement rate? does it matter am I use PS, sbas SB or other method.
Yes, coherence loss is the big problem you have to consider. This depends on the area you want to study and the radar wavelength. The SBAS method depends on the individual interferograms of a time series having adequate coherence over all of the study area. With Sentinel-1A and -1B acquiring data much more frequently than previous C-band missions, the coherence can be much better due to shorter intervals of interferograms. The PS methods can extract coherent pixels from areas with lower coherence, which works well in urbanized areas. StaMPS also uses some methods to combine SBAS-like and PS-like analysis to work in some other areas. I don’t think that any of the programs limit the displacement rate. As I mentioned before, the main problem is the horizontal gradient of the displacement in areas of good coherence. In areas of poor coherence, the methods will have more trouble even with lower gradients.
Thank You EJ
Sorry for my maybe naive question. Could L band is more suitable such rate of displacement? Of course only then resolution is not so important and area is quite big >1 km2. Wavelength is larger. Does it have free L band datasets available ? start 2017 up to today?
Yes, L-band works better in many areas because it is much more coherent. The unwrapping is also much easier. That is why I am on the NISAR (NASA-ISRO SAR) mission Science Team working to get the NISAR mission launched in 2021. All NISAR data will be available for free but you have to wait for us to launch it.
There is free L-band data available from the NASA Alaska Satellite Facility (ASF) acquired by the JAXA ALOS satellite for the Americas. ESA provides access to the ALOS data for Europe and Africa. The ALOS satellite operated between 2006 and 2011. The JAXA ALOS-2 satellite has acquired data for the whole world since late 2014, but they don’t provide the data for free except through their Research Announcements and some other special arrangements.
@EJFielding Really sorry for bothering.
Would you mind to give some references for your replies? I didn’t see this before.
Another question,
I formed interferograms with time intervals over 12 days, and the displacement is -60 cm ~ 40 cm. It’s too large to believe that it’s reliable. Do you have any suggestion to correct this?
does the overall pattern look alright? Whats the quality of the interferogram and the average coherence in the area of interest?
The DInSAR workflow produces results regardless of the input data, but not all of them are reliable.
Here are two papers from a while ago that explain about limits of InSAR measurements:
Bürgmann, R., P. A. Rosen, and E. J. Fielding (2000), Synthetic aperture radar interferometry to measure Earth’s surface topography and its deformation, Annual Review of Earth and Planetary Sciences , 28 , 169-209.
Rosen, P. A., S. Hensley, I. R. Joughin, F. K. Li, S. N. Madsen, E. Rodriguez, and R. M. Goldstein (2000), Synthetic aperture radar interferometry, Proceedings of the IEEE , 88 (3), 333-382, doi:10.1109/5.838084.
Displacements of 100 cm in 12 days are possible if there was a large earthquake in that interval or over a fast-moving glacier, sinkhole, or landslide. Other geophysical processes are unlikely to cause that much displacement. You should look at the coherence of the area. If it is low, then the measurements are unlikely to be reliable. The SNAPHU program will unwrap areas of near-zero coherence and sometimes give large unwrapped phase values.
As @ABraun suggests, you should also look at the pattern of the measured displacement to see if it looks like an actual physical process.
2 Likes
Really appreciate your kind relies.
I checked the coherence of some points in urban area whose LOS displacements are all nearly about -40 cm, and the coherence of most points are > 0.5.
However, the GPS data shows that the displacements of these points might probably only 1 mm, and there is no earthquake happening here.
Do you have any suggestion or reference to correct this?
Thank you
can you please show a screenshot of the inteferogram and the final displacement raster?
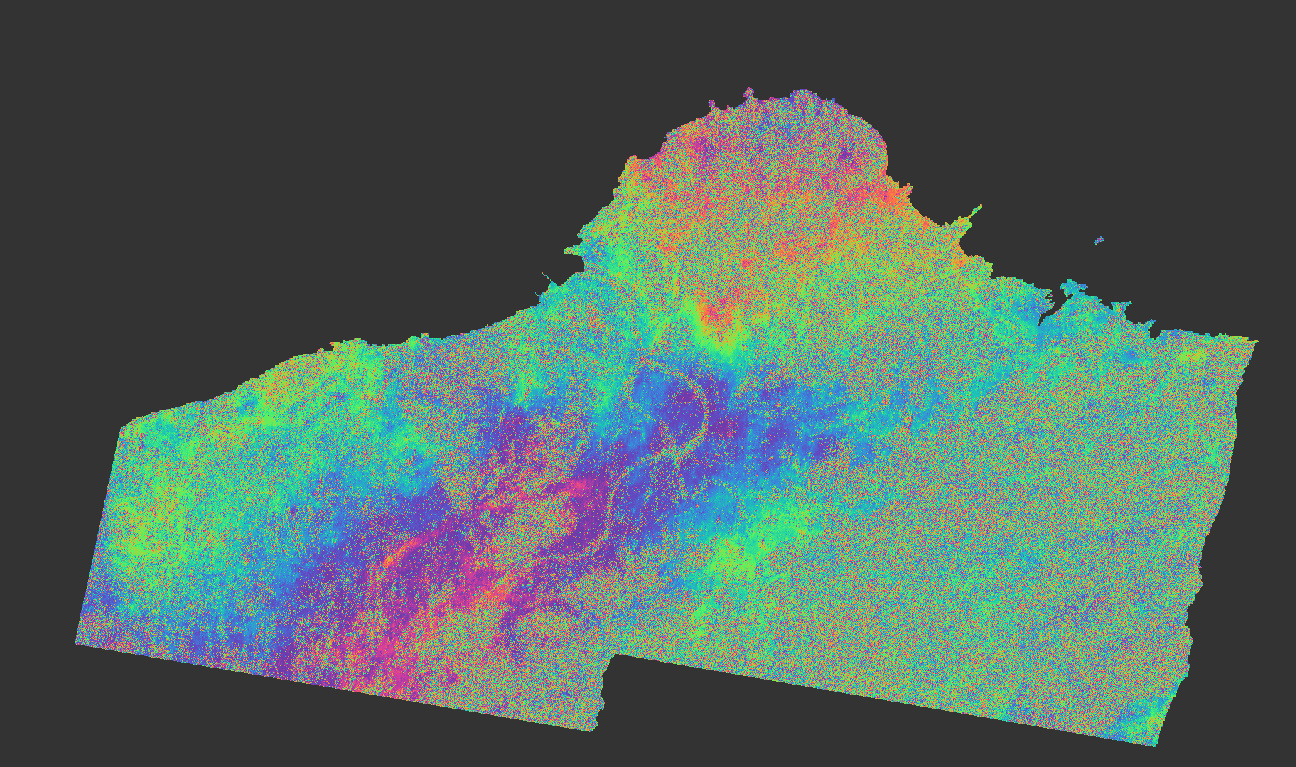
I generated the interferogram and displacement map again as follows:
the interferogram (after terrain correction)
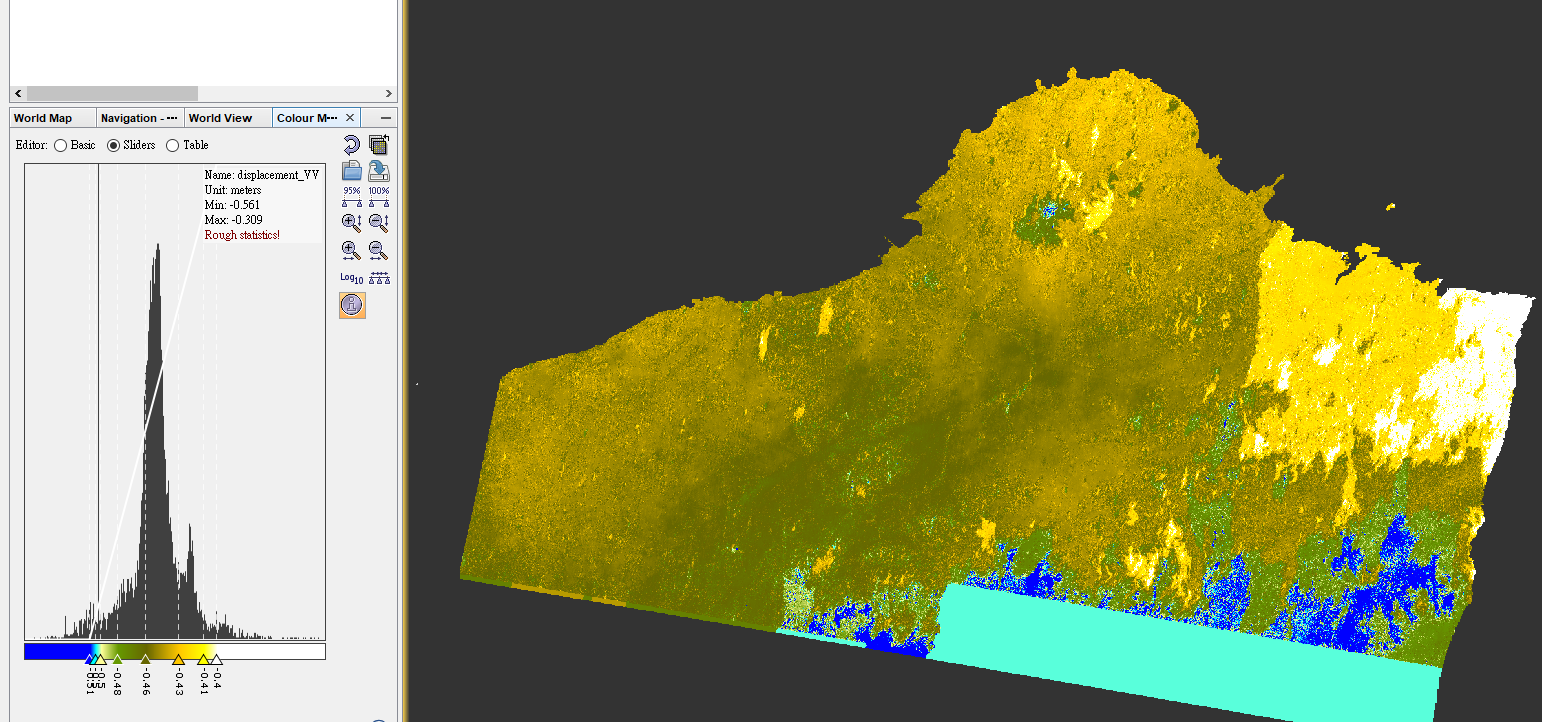
the displacement map (after terrain correction)
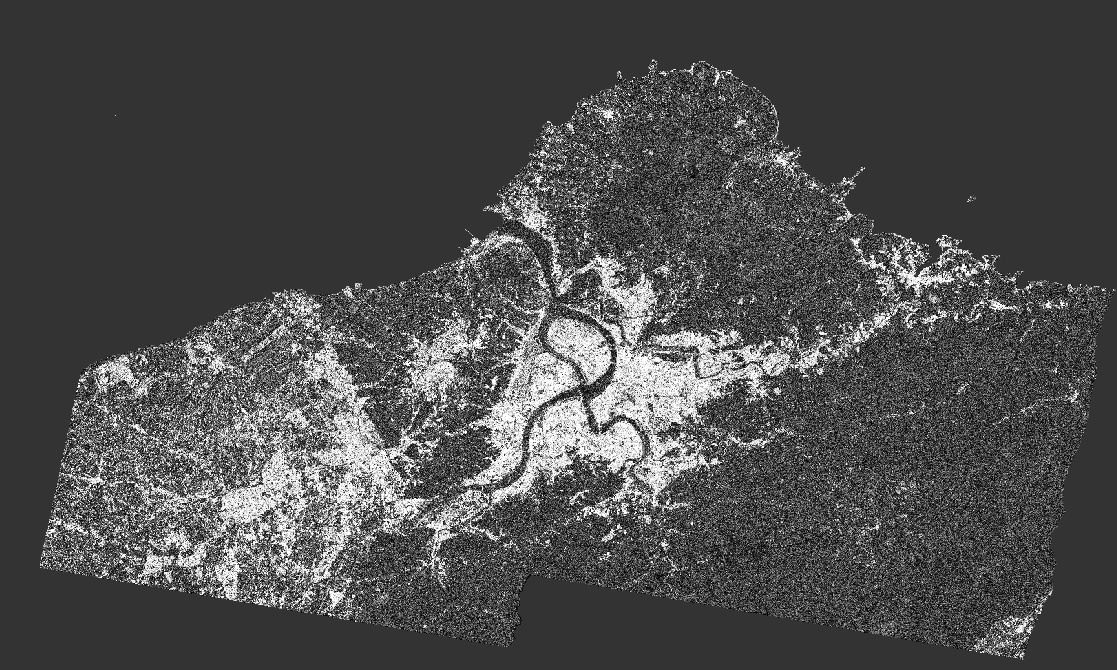
the coherence (after terrain correction)
It seems like the area of high coherence still has large displacement, but the GPS data shows that the central area has the displacement of only about +/- 1 mm.
the inteferogram looks usable, although we don’t know if it contains atmospheric effects as well.
Larger unwrapping errors occur in the areas at the top right and at the bottom, because of phase noise. Did you consider masking out areas of low coherence as suggested in this tutorial?
InSAR Displacement mapping with ERS data on page 24
As your entire raster has a negative displacement, it would make sense to normalize it in a way that the peak of the histogram lies at 0. Looking at the color distribution, this could be achieved by adding something around 0.44. This procedure is described in the same tutorial on page 25.
@ABraun Great job for this tutorial!
I found this sentence on p.24 “All pixels with a coherence value below 0.6 are now made transparent in SNAP” while in the Figure 35 the formula is "coherence_VV > 0.2 " is it a typographic error?
1 Like
@ABraun I really appreciate your help.
I only picked several points of high coherence for use.
I will try to follow your advice later.