Hi, When I run SNAP multi-looking on Sentinel-1 imagery, it reduces the pixel size but the statistics of sea clutter suggest that no multi-looking has taken place in the range direction. Has anyone else noticed this, or have I set something up wrong?
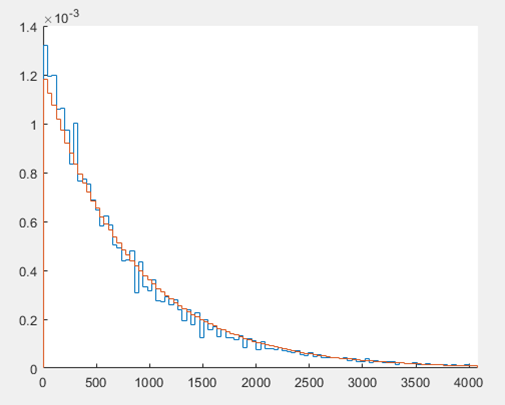
For instance, if I take a (12000x3000 pixel) patch of sea surface data of the original slant-range image, I get a negative exponential shaped probability density histogram (using Matlab), (see the blue line below) which is as expected. (For comparison I’ve plotted the orange line, which is a histogram of the power of a randomly generated image (with Gaussian distributions in I and Q) which has been set to have the same mean as the data sample - it all looks right so far)
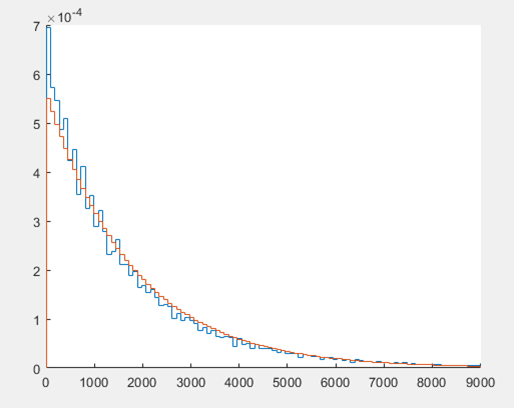
However, if I use the SNAP processor to multi-look by 4 in range, the shape of the graph (over the same patch of sea) doesn’t change (see below) (although the number of pixels has reduced by 4)
However, if I start with the original image, and then using matlab, apply a sliding window of 4 pixels to calculate the mean of the intensity and resample to a quarter the original spacing in range then I get this shape graph (see below) which is what I’d expect after multilooking.
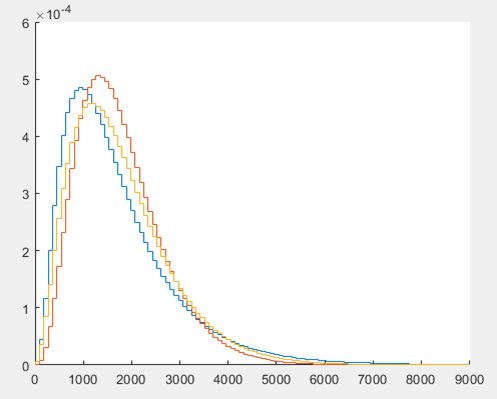
(the blue line is the data, the orange line is what I get if I apply the same 4 pixel window to the power of a simulated randomly generated image (with Gaussian distributions in I and Q), and the yellow line is using a 3 pixel window on the simulated data. This suggests the data has been multi-looked by a factor of between 3&4, which is as expected, as two adjacent pixels may slightly correlated due to oversampling of the original image.
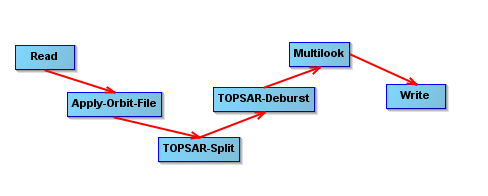
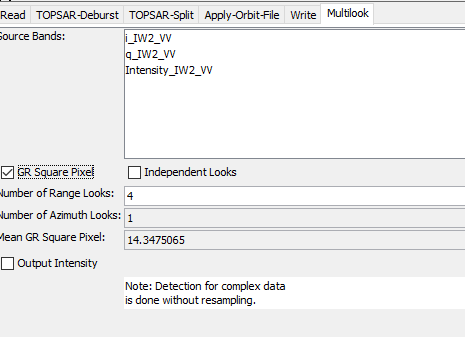
The SNAP azimuth multi-looking seems to work as expected, but the range multi-looking seems to be doing something funny. I’ve attached the SNAP processing graph and multi-look parameters. Have I done something wrong? (Clicking the check boxes in the multi-look input doesn’t seem to help this problem.)
Can anyone help?
Cheers,
Dave
PS I’ve done this on a number of images and noticed the same thing, so it’s not just one dodgy patch of sea!