A user here suggested me to do coherence filtering across a time series to locate which pixels have coherence values close to unity and with minimal change over time, so those pixels can be considered as reference points for the space differing of GACOS tropospheric correction and hopefully those areas will highly likely represent stable scatterers showing little to no LOS deformation.
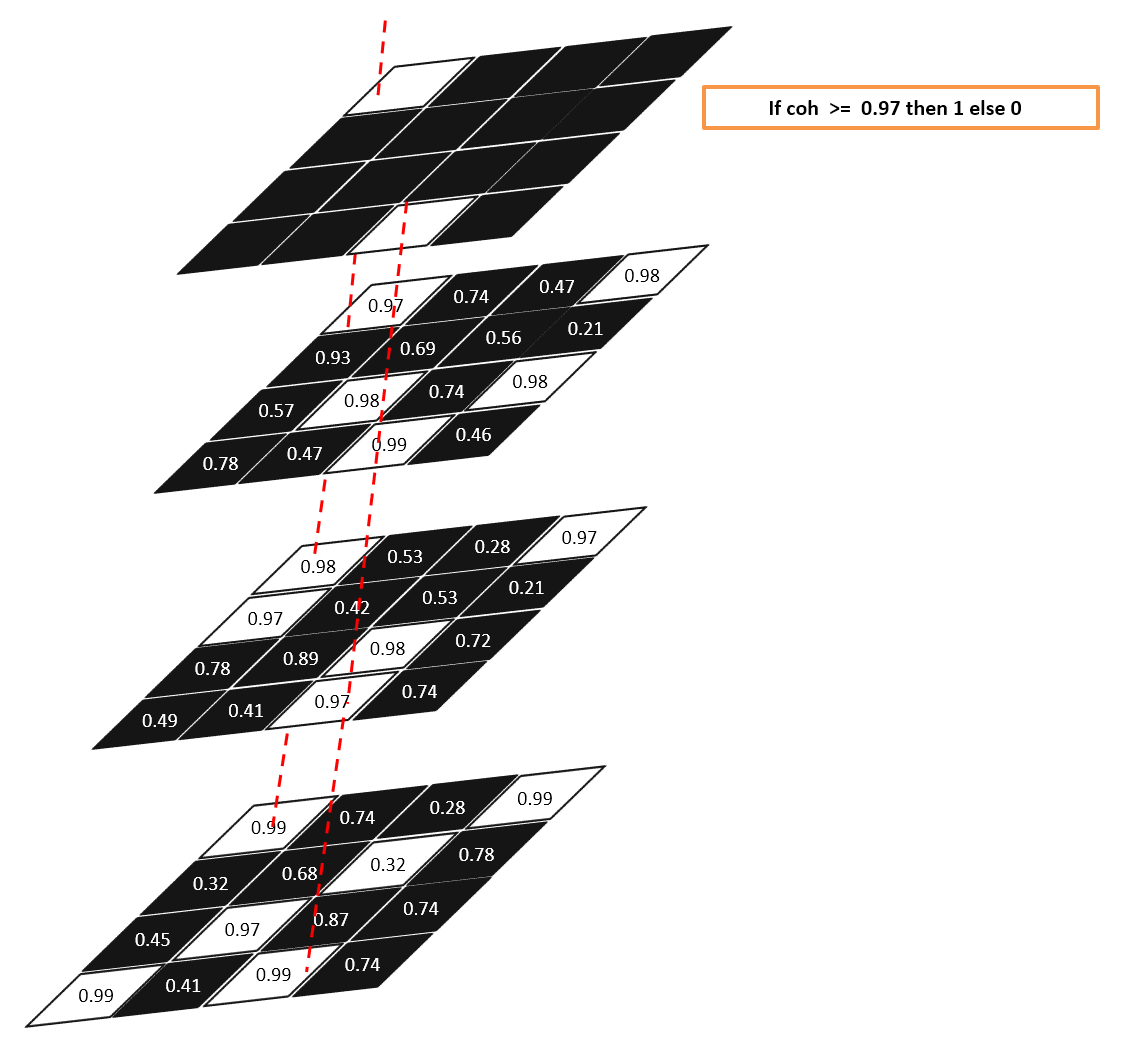
Suppose we have multiple coherence maps that were created alongside with the interferograms. I can apply a band-math equation to create a new band to only display certain pixels with pre-determined coherence value and the process is carried out band by band as shown in the following illustration.
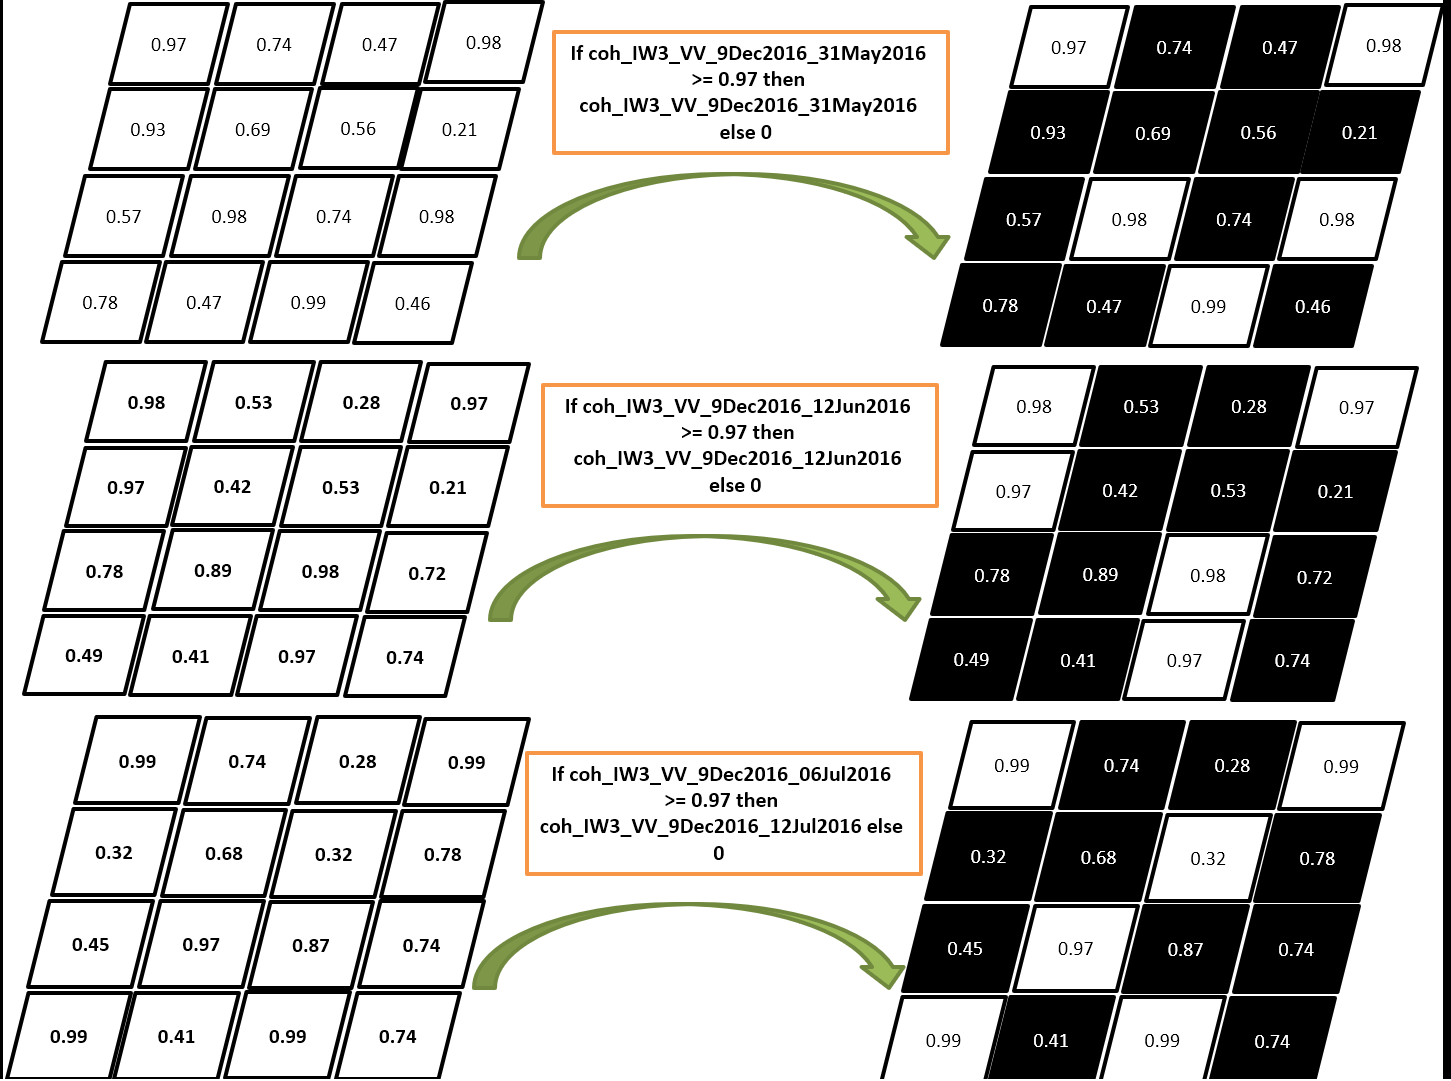
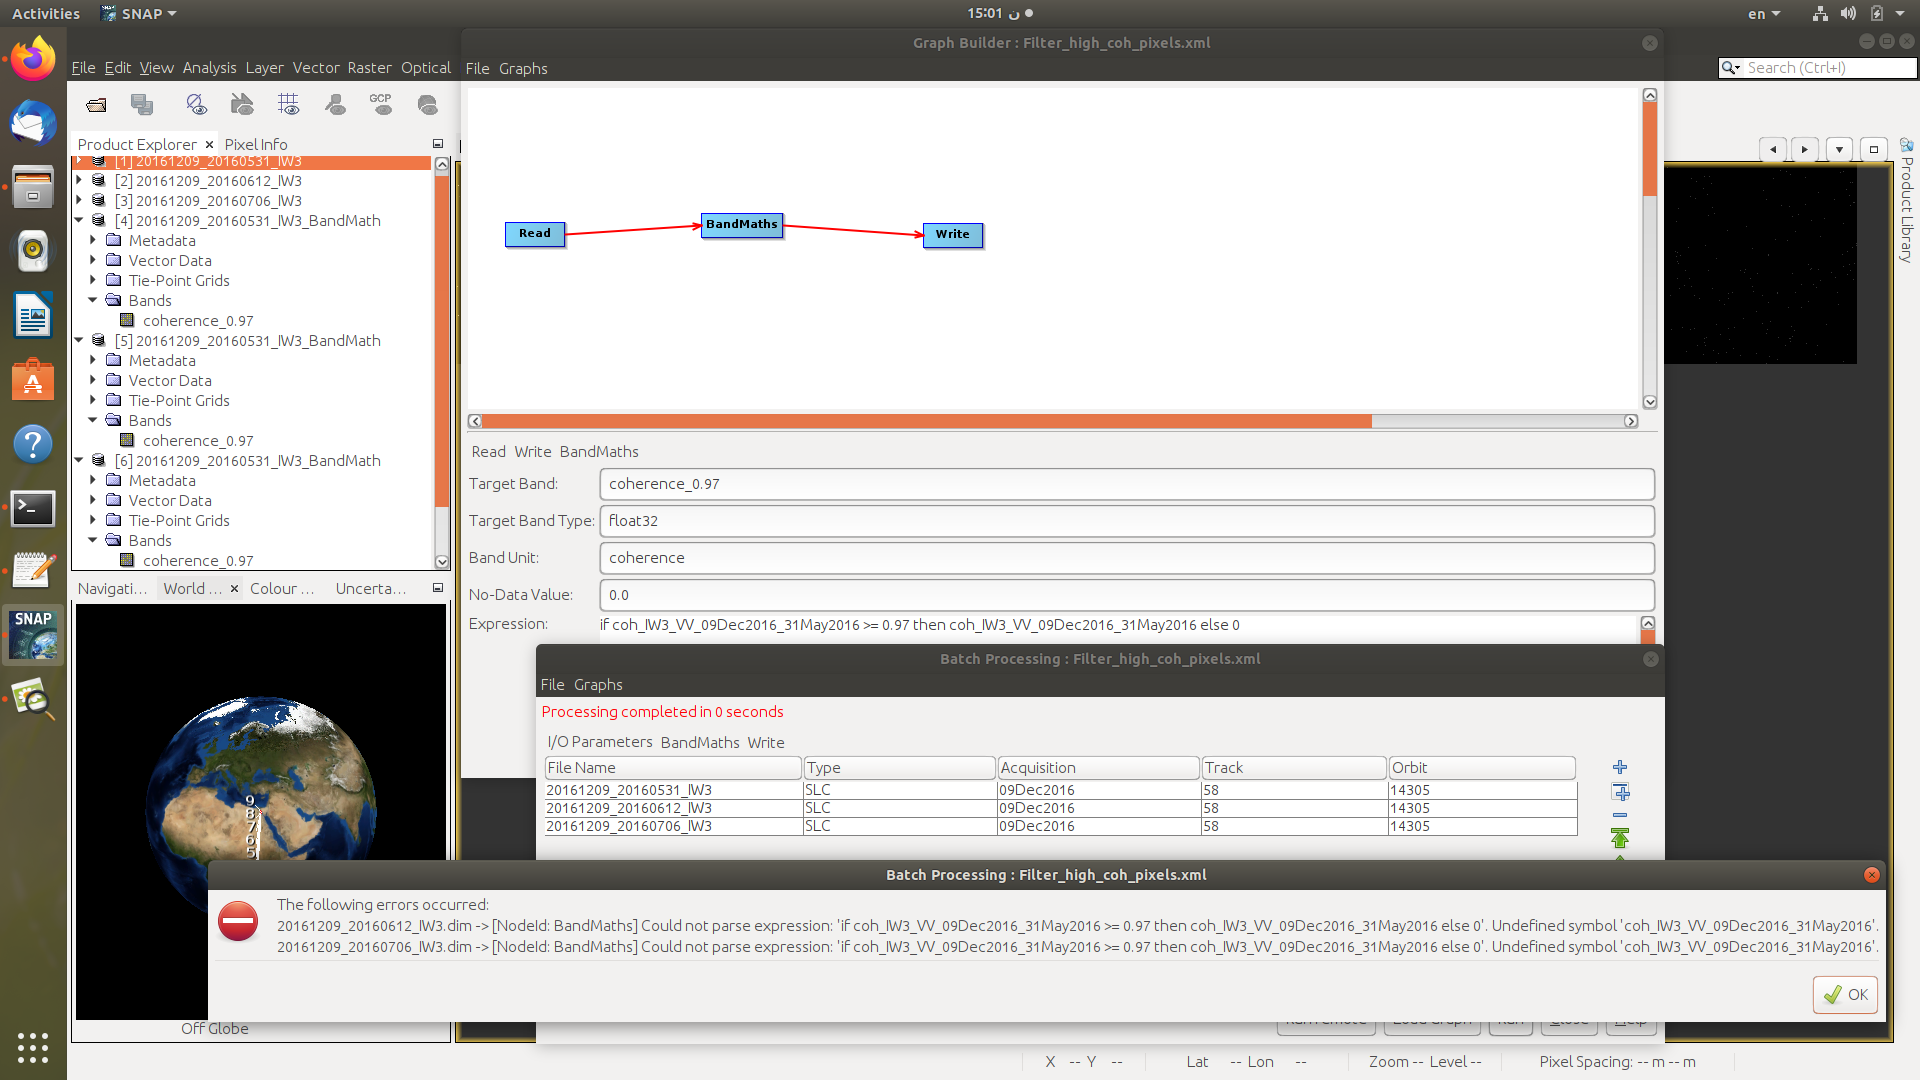
A) Is there a method to apply this particular band-math to multiple input products as a batch process instead of creating a graph for 70 products individually?
have tried batch processing but of course it didn’t work because the input graph has an expression designed for a particular band name that cannot be applied to the second input band due to the conflicting names in the expression, and I couldn’t find an expression that generalizes processing only the coherence band from each input product without specifying the name of each band, so that it can go over all the input images and only select the coherence band automatically
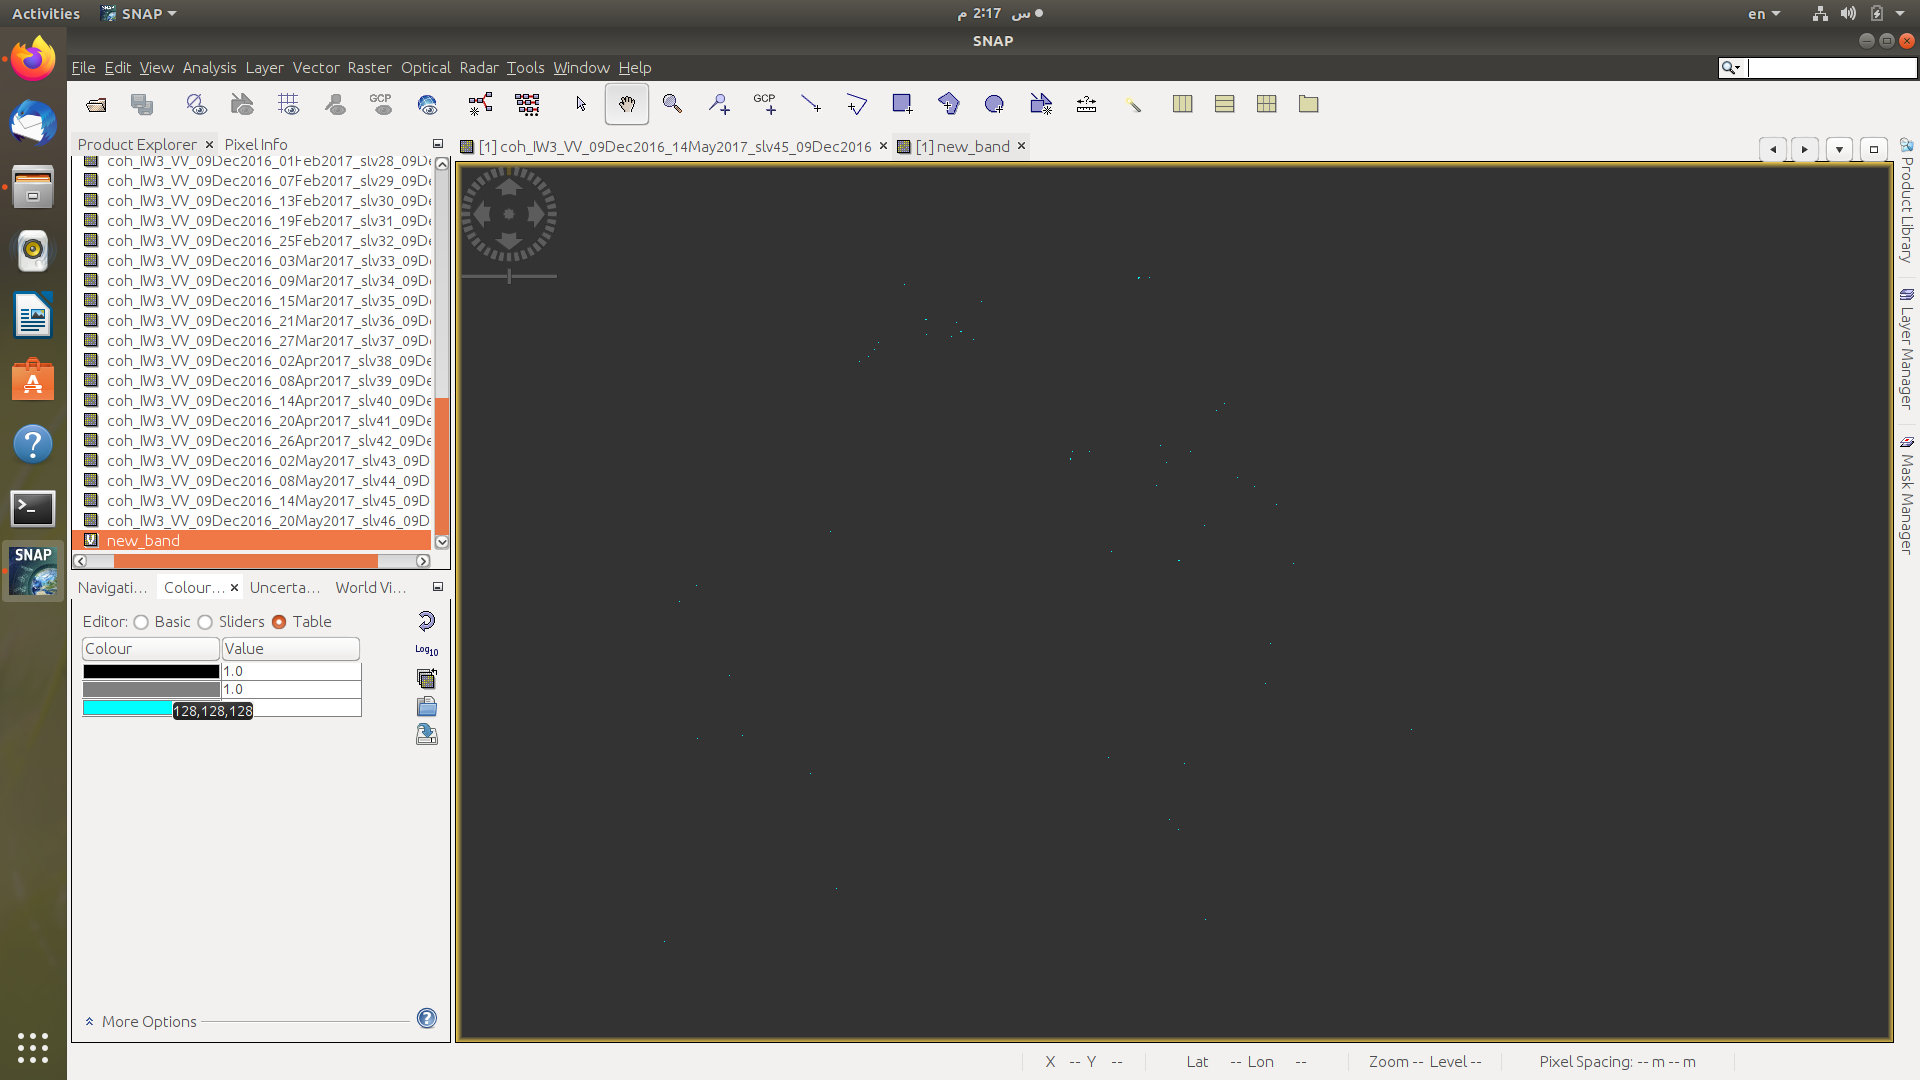
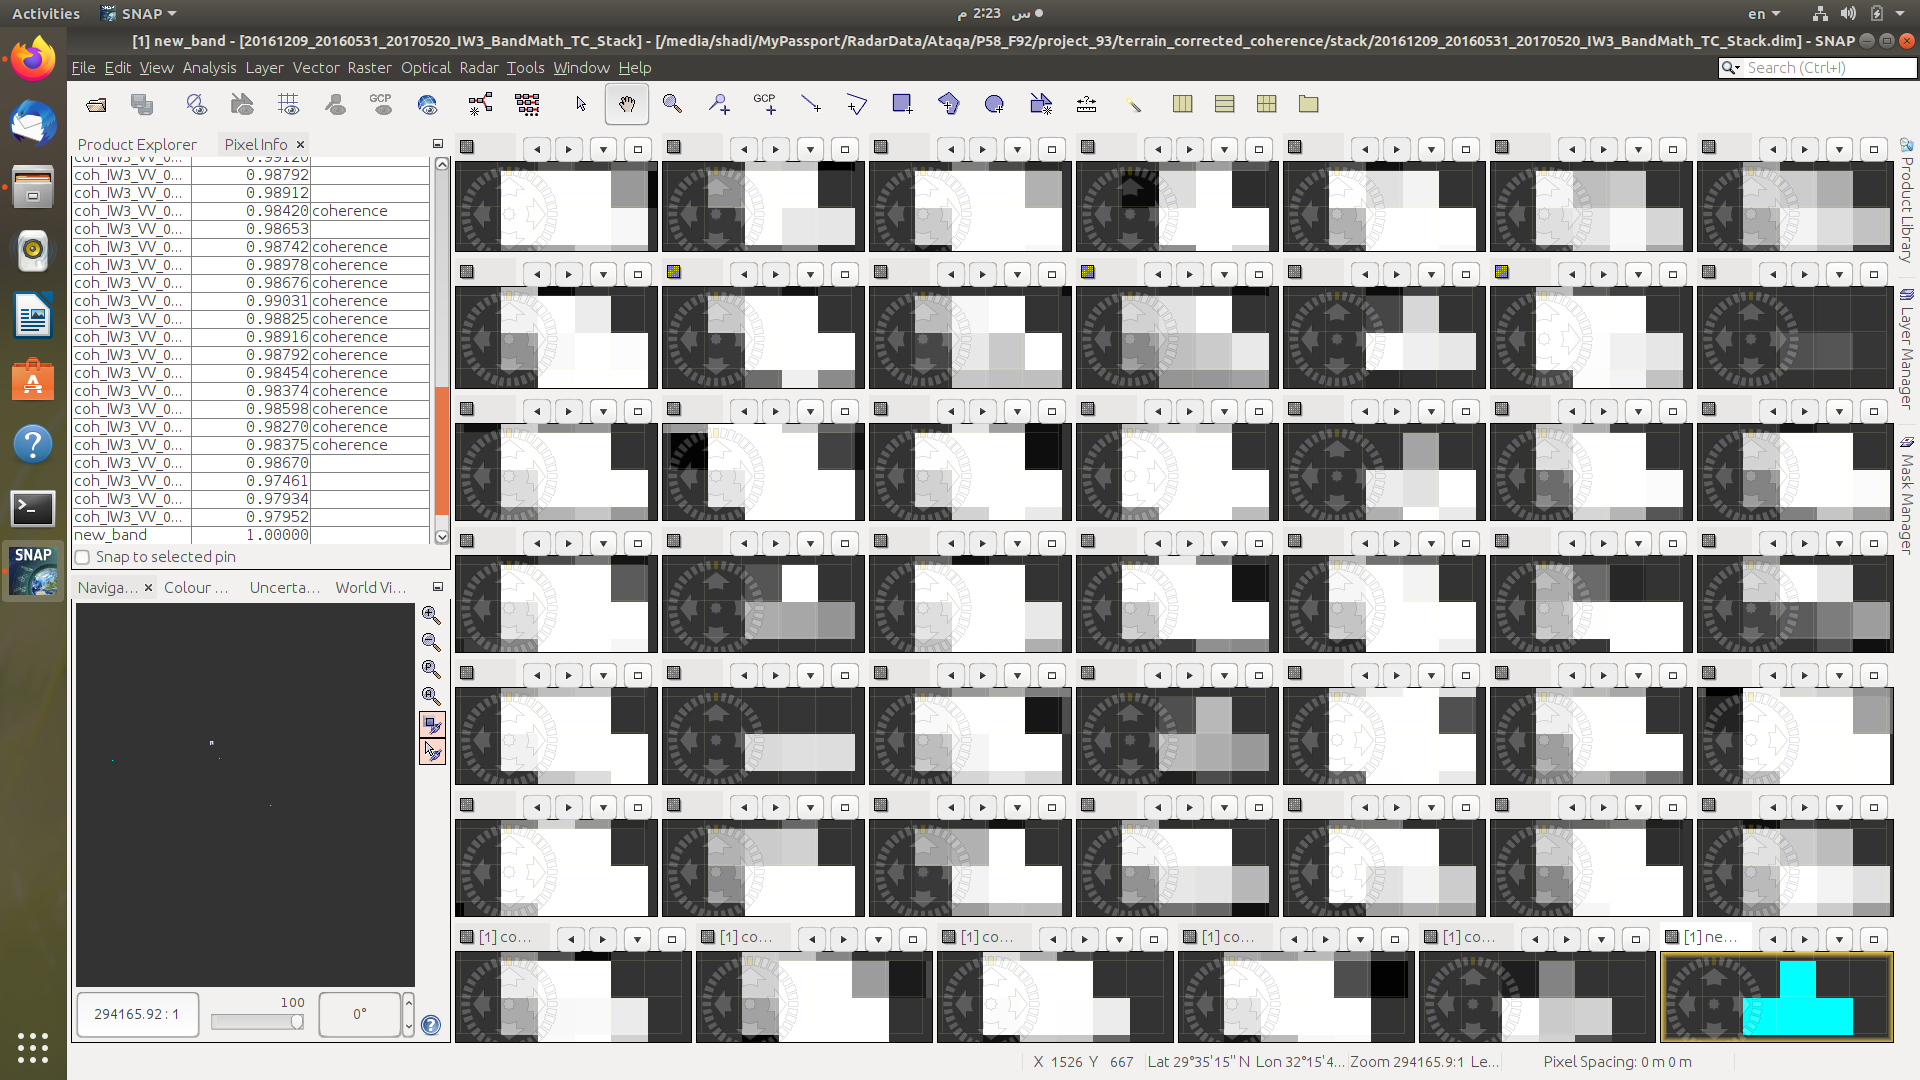
B) Is there a method I stack the output coherence bands with the predetermined coherence values to find which pixels temporally maintain those values across the entire series as shown in the following illustration?