Hello everyone.
I often use QGIS PS-Time-Series-Viewer plugin. But it would be more convenient to use a script for multiple PS selection.
Some time ago I had a script written in R that allowed to plot and make averages directly on QGIS. But after a few updates I can’t get it to work anymore. Could anyone help me out trying and fixing this script?
I think these two scripts could be very useful to the whole community.
Thank you.
I’ve had this experience many times (and not only with R scripts). Once I even contacted the PhD supervisor for a thesis that produced an R package we were using. The package had disappeared from CRAN. The supervisor didn’t know how to contact the recent PhD, but had heard he was driving a taxi.
I can’t help with your problem, but from experience I can tell you that it is very helpful to keep a small test data set and expected output so you can verify that a complex script still works correctly. It is better to have a script fail to run than to have it run but produce incorrect output.
Hello everyone,
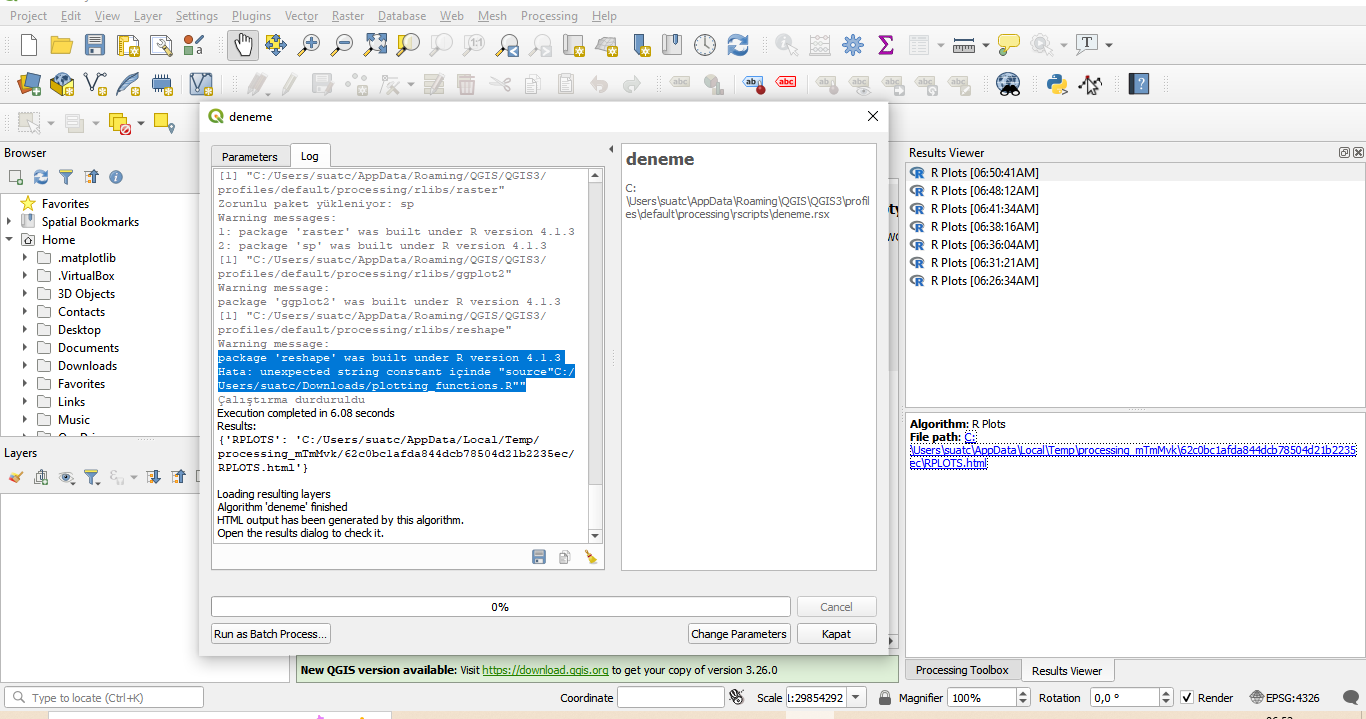
I have repaired the script defo_plot. You have only to change the path inside the defo_plot_fra.
1)install Rstudio
2) install plugin “Processing R Provider” Use plugin manager in QGIS
3) set the R in QGIS ( you can follow this trainer for install and set R in QGIS How to use R in QGIS? - YouTube)
4) open defo_plot_fra from the processing toolbox/R and change the path in line 18 #source(" ____ ") to file plotting_funtions.R
5) select ps and run the script.
As this discussion is not related to SNAP/S1TBX, but only to R and QGIS, I have moved it into the meta category.
Please keep in mind that this forum is dedicated to SNAP and related tools. It is not a generic remote sensing forum.