Hi! I am starting to learn about Sentinel imagery and SNAP software. I am a bit confused how normalization works in Sentinel-2 pixel values. I want to normalize the pixel values of bands 2, 3, 4, 5, 6, 7, 8, 8A, 11, and 12 to values 0-1. Should I normalize each band from values 0-1 then stack them together after? Or should I normalize the whole band set altogether so that the whole band set has a value range of 0-1?
Also, can I use band maths for normalization? Or are there other techniques/options I can use to normalize pixel values in SNAP?
I realized this is true after inspecting the satellite imagery again, thank you. And I’m sorry my own question was misleading to what I am really confused about. My question should be… how do you normalize temporal Sentinel-2 imagery in SNAP?
Atmospheric corrections applied to S2 L2A level products are all the same regardless of weather, lighting conditions, etc. Between two consecutive sensing dates, I observe that the jump from pixel values may vary greatly. There exists unrealistic decreases and increases to pixel values just in a few days. I realize this may be problematic if I jump to further analysis without addressing this issue. My goal is to monitor long-term changes in vegetation condition.
I am not quite sure, but I think my question is synonymous to… how do you perform radiometric normalization of Sentinel-2 imagery in SNAP?
your question is legit, but I think there are two opinions or approaches:
The first is that only radiometric calibration and atmospheric correction leads to temporally comparable images of different acquisition dates. All other manipulations falsely alter the radiometry, potentially suppressing actual changes or inducing artificial changes.
The second is that a rigorous histogramm matching is required to point the focus on special developments which are sensitive to smaller temporal variations.
SNAP currently only supports the first one (sen2cor is used to create L2A from L1C).
The second one is, to my opinion, only needed for special cases where single areas are observed. Maybe you can perform your own histogram stretch based on pixel statistics (as retrieved from the Statistics operator or the Pin Manager) and a linear regression (in the Band Maths).
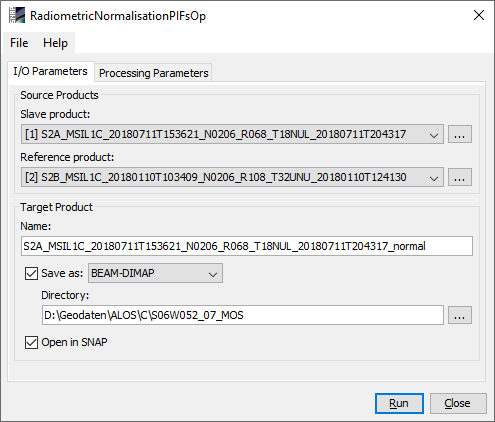
Edit: I just found out that tere is also a Normalization Module under Optical > Thematic Water Processing > sen2coral > Processing Modules > Radiometric Normalization PIFs which might be interesting to you, but I can’t tell you how it works
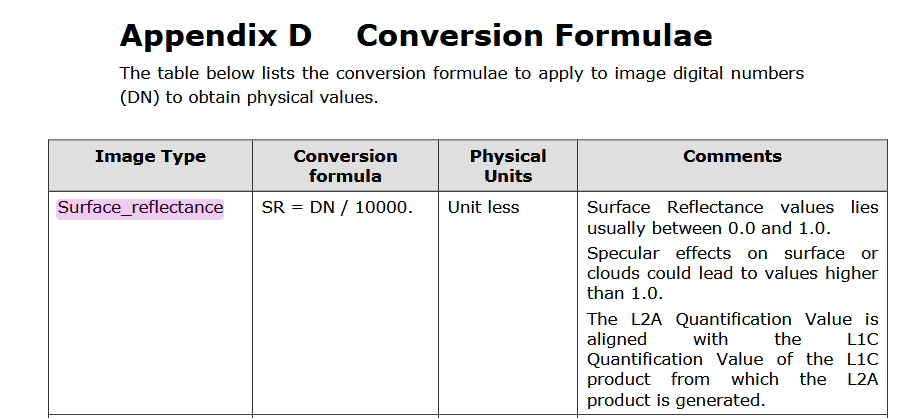
Hello guys! It seems mangoberry doubts were cleared, but I came here with basicly the same question. When I’m reading the 10m resolution images for the bands 2,3,4 and 8 with QGis or RasterIO (a python library) the results are really high, mostly ranging from 0 to around 6000. Is there something I’m doing wrong?
What I did was to navigate through the Sentinel-2 Data-Hub and choose a region available for the product 2A to download. Also there is a public dataset called LandCoverNet, where they collected a bunch of images from sentinel 2 and annotated for semantic segmentation task. In this dataset I’m also getting the same kind of readings, something ranging from 0 to 5000.
I’m feeling I’m missing some kind of calculation I should apply to it.
please do you have to stack the bands before dividing by 10000 or you need to do band by band because am having the same problem where my min ranges from 2 and max is about 8650. thank you
Most GIS workflows have moved to file formats (e.g., NetCDF-CF) that can transparently handle details of rescaling and missing value codes. This is resulting in some data sets that no longer use the same scale factor for every image (e.g., the range of data values is scaled to the range of some integer data type to minimize quantization errors), so we can no longer assume that historical scale factors will not change in the future.
I have supplied remote sensing data to GIS users over a periond of many years. Formats like GeoTIFF often required lengthy email exchanges to provide metadata details and check scaling and missing value locations against source products. When the software started supported NetCDF-CF these problems were greatly reduced.
You should mention the source of the data and any processing you have done. Also note that there are extensions to GeoTIFF and other legacy formats (new tags, external .xml files) to provide enhanced metadata.