Hello Dear Friends,
I am using a software to implement PSI technique for 30 images. Since the software gives the final results, I do not know the several mid-steps. My question is PSI create 30 interferograms or more ? I mean how the technique decides the number of interferograms?
Thank you very much
what software are you using?
PSI (left plot) is usually a single-master technique. If you have 30 images, you compute one inteferogram of each slave to the master (29 interferograms)
SBAS (right plot) makes use of many more interferograms by calculating interferograms between different combinations of images (mostly by a maximum temporal and perpendicular baseline). It allows to get a much higher number of interferograms.
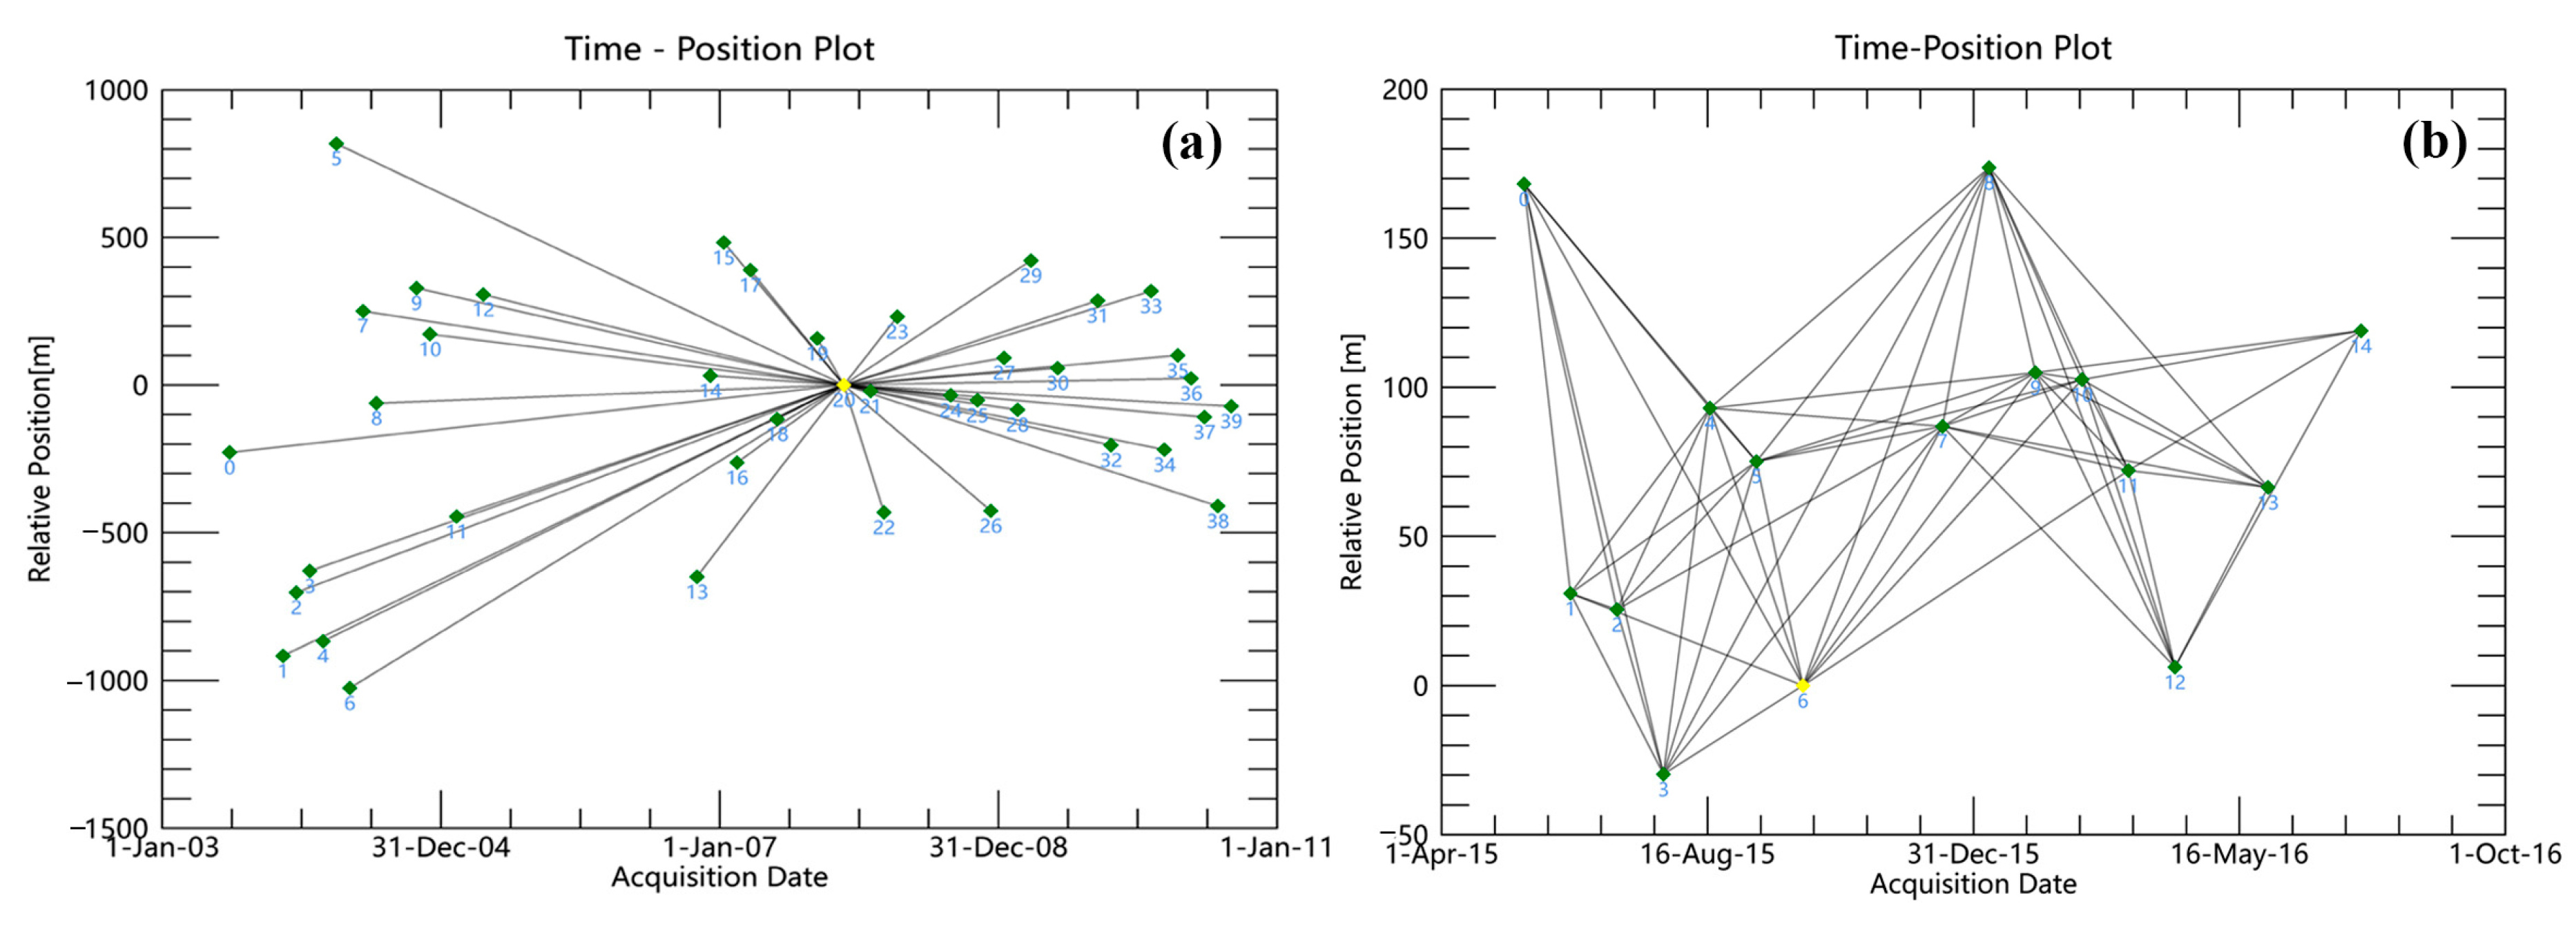
image source
I cannot tell you which one is employed by your misterious ‘black box’ 
Thank you very much @ABraun. I appreciate your experience, knowledge and support. Can I ask one more question .
If I for instance use 20 images the range of displacement is say -150 - 150 ; but if I increase the number of images with same parameters the range of displacement decreases say -60 - 90. Why higher number of images decreases the range of max and min of displacement.
Thank you very much.
more images means less PS, but with a higher stability. Accordingly, noise in the detected PS is reduced, leading to a smaller overall range.
The min/max values are not very representative though.
Also @ABraun , the slope between more images for linear model can decrease and the max-min affected with smaller slope? Is it the another reason for narrower range?
Actually, all defomations are normalized to mm/year. So the investigated time should not alter the (linear) deformation rate.
No @ABraun, I mis-explain my question I guess. Say for ONE YEAR interval time:
Option 1: 20 images and
Option 2: 40 images
Option 2 smaller slope than option 1. Is this decrease the max, min and mean value, standard deviation also for displacement analysis in PSI.
Sure, more images during the same period mean less identified PS and these have less noise and outliers, so the slope can be smaller.
Thank you very much @ABraun, I appreciate your support 