I am having a new issue with Snappy when trying to read a raster band (S3 or other) into a numpy array.
Here is my code:
# Read raster or S3 file with snappy
infile = '/path/to/raster'
prod = ProductIO.readProduct(infile)

# Get bandnames
im_bands = list(prod.getBandNames())

# Get height and width
h = prod.getSceneRasterHeight()
w = prod.getSceneRasterWidth()

arr = np.zeros((w,h),dtype=np.float32)  # Empty array

# Get the 1st band of the product for example
currentband = prod.getBand( im_bands[0])

# Read the pixels from the band to the empty array
bandraster = currentband.readPixels(0, 0, w, h, arr)
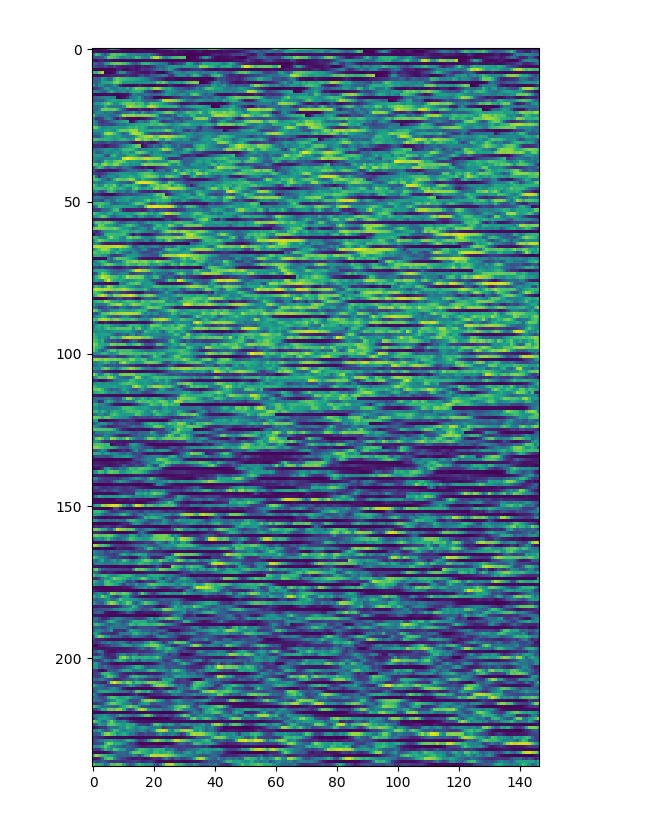
However, when I plot my raster: plt.imshow(bandraster), I get something very different from the band I am importing. The following subset of an S3 image for example:
The pattern you get is quite common when mixing languages. The physical storage of arrays is generally just a “vector” of length w*h. The problem comes when one language stores arrays by column and the other by rows. A matrix transpose is often used to switch storage orders. Unfortunately, transpose is often an “expensive” operation. NumPy internals says transpose is done in the array metadata, but this just defers the expense to the point at which the data are used: because you are accessing widely separated locations in memory, you may get cache misses and other overhead. The numpy approach works well if you are working on small pieces of the array, but doesn’t really save anything if you are doing operations on the full array. If you are doing heavy calculations on large images in numpy you may find things go faster if you work in the original (Java) order and apply transpose after all the computations have been done.
As a further complication, some languages display images with the first row at the bottom, while others start from the top.
If the numpy array approach works with small pieces of the array, then reading the band in line by line should work right?
I tested the following:
# Empty list to receive rows of data
lst_arr = []

# Loop over height
for y in range(h):
    # Create a 1 line array to read in the data
    array = np.zeros(width,dtype=np.float32)
    # Append as list to be more efficient (could be optimised?)
    lst_arr.append(list(currentband.readPixels(0, y, width, 1, array)))

# Convert to np.array
ar = np.asarray( lst_arr)
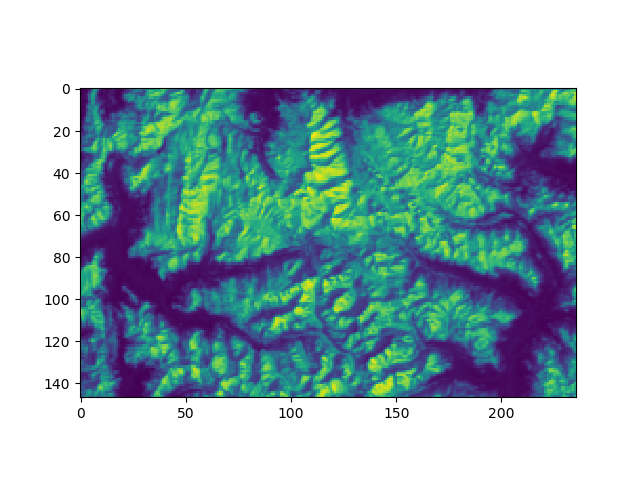
I get the correct output as a numpy array:
If anybody has a better solution computation-wise, please feel free to suggest
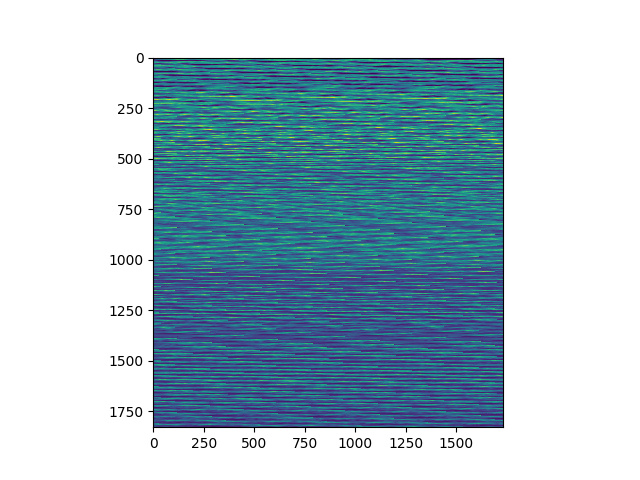
Here a small workaround for the snappy/numpy arrays:
h,w=p.getBand('elevation').getRasterHeight(),p.getBand('elevation').getRasterWidth()

#if h == w -> no problem
# if h /= w; we get
dem = np.empty((w,h-100),dtype=np.float32)
p.getBand('elevation').readPixels(0,0,w,h-100,dem)
plt.figure()
plt.imshow(dem)
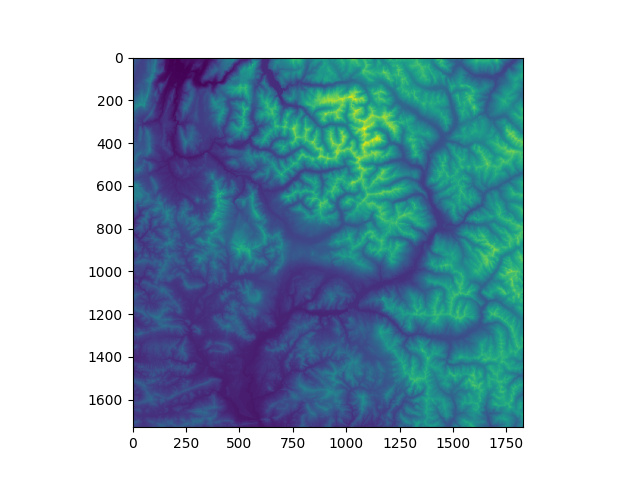
The workaround is to use the FORTRAN order when constructing numpy-arrays:
# workaround:
dem = np.empty((w,h-100),dtype=np.float32,order='F').T
p.getBand('elevation').readPixels(0,0,w,h-100,dem)
plt.figure()
plt.imshow(dem)