I am very new to processing SAR images and I am working on a rather difficult topic at the moment, which is trying to calculate sand dune movement in the Sahara using Sentinel 1 images. I am working on an area close to Arouane in Mali, and unfortunately I do not have much insight to start with regarding at which speed the dunes may be moving but I assume it is rather slow as it seems to be mostly linear dunes in this area.
So far, I found this study which is similar to mine and I have been trying to reproduce their methodology: Remote Sensing | Free Full-Text | The Use of SAR Offset Tracking for Detecting Sand Dune Movement in Sudan
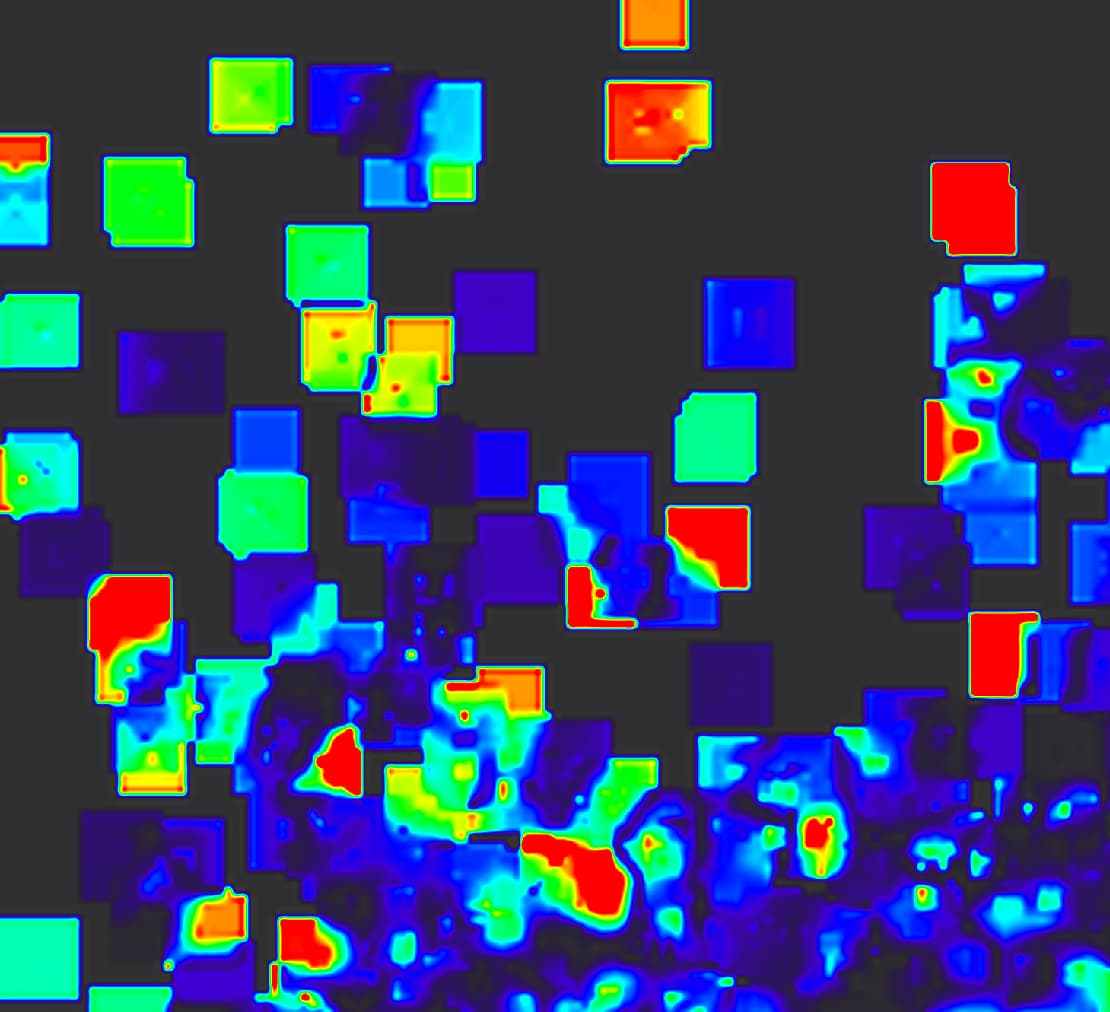
I first had poor results with big squares appearing on my output velocity band (see attached image). I decided to add a few pre-processing steps to try to improve the results but the squares remain.
My workflow typically includes:
apply orbit file
speckle filter (lee sigma)
calibration
thermal noise removal
GRD border noise removal
subset
co-registration (using DEM SRTM 1sec)
offset tracking, putting change max velocity at 1m/day (I put it very low in order to try to take into account the fact that dunes seem to move slowly in this region).
I have also conducted tests using several pair of images, but I always obtained the same “squared” results as in the picture I attached. The different pairs I tried were :
1st and 13th of February 2017
1st and 25th of February 2017
1st of February and 21st of March 2017
With my small experience processing SAR images, I cannot tell if this issue is coming from the way I pre-process my data,or if I did not choose an appropriate pair of images (though I have been, as I said, trying to reproduce what was done in the aforementioned study where they choose pairs of images having 12 days of difference).
Any insights you may have about the offset tracking tools, or what I could do to modify my approach and obtain better results are welcomed! Indeed, I did not find much online on how the offset tracking tool in SNAP was working, I only know it is mostly (if not only!) used to calculate glacier velocity.
I think the squared artifacts in your SAR images could be due to how the offset tracking tool handles environmental variables like wind and topography, which are crucial in dune movement. Since the artifacts persist across various image pairs, consider revisiting the offset tracking parameters, especially the maximum change velocity, to better capture the subtle dune movements.
If adjustments to parameters don’t help, the issue might be related to the software’s interpretation of data or a possible glitch.
I think I was trying to reproduce exactly what was done in the study, but when I checked there was indeed no movement detectable by eye between two images (12 days difference). I took an “extreme” case (2 years between images) just to see if I was getting rid of the squares that way, and it worked! Of course I don’t think the results mean anything and I will try to a more adapted time period between my two images.
Ultimately, I guess this mean that the dunes I am trying to look at move less than 1m/day (correct me if I am wrong with this hypothesis). Does it make sense, and is it possibe to indicate a lower number than that in the offset tracking parameters? I am also wondering if another approach (not offset tracking) would be more adapted to my case study…
Hi there,
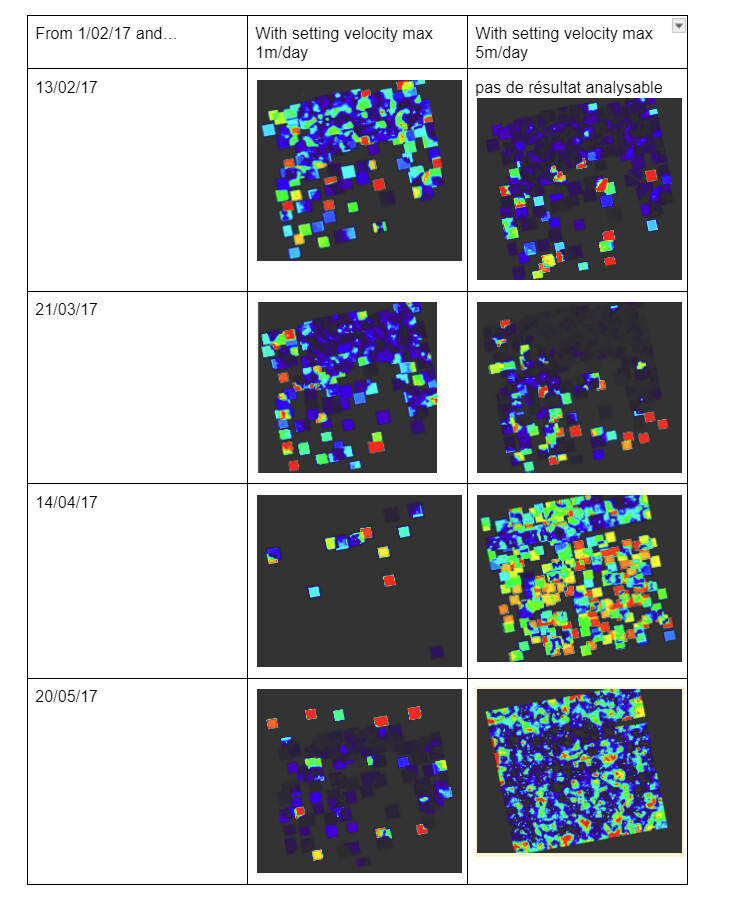
I have done some more tests with changing the max velocity in the parameters and I am a bit confused by the results I am getting.
Indeed, I obtained better results when setting the max velocity on 5 meters per day instead of 1 meter per day - though I am sure that the dunes are not moving that fast (otherwise I would already get results with my pair of images of 12 days of difference?). I attached a snapshot of my results here.
Considering that the movement of the dunes is actually pretty slow, would InSAR works better? I found this one for instance: https://step.esa.int/docs/tutorials/S1TBX%20TOPSAR%20Interferometry%20with%20Sentinel-1%20Tutorial_v2.pdf I have so far been “ignoring” this methodology so far as I thought it would not work well because of the phase unwrapping. Again I am pretty new to SAR processings so any knowledge about the pros and cons of both methods would be super helpful.
For sand dunes you can work directly with the SAR amplitude images, usually for offset tracking you may need that the object is coherent, while dunes used to be detectable due to their low backscatter if their interdune are has a not deep rocky base.
glad to hear from you I plan to follow two methods involved in SAR into their method. the first titled “The Use of SARO setTrackingfor Detecting Sand DuneMovementinSudan” I decided choices it first because it uses SNAP and it looks tied with Offset Pixel Tracking. the second will be your paper I’ll deep into it and it looks very interesting if we consider my master’s in GIS!
I started reading your paper and noticed you apply HSBA as a main method, I wondering if you used SNAP to process this approach? or MATLAP for example?
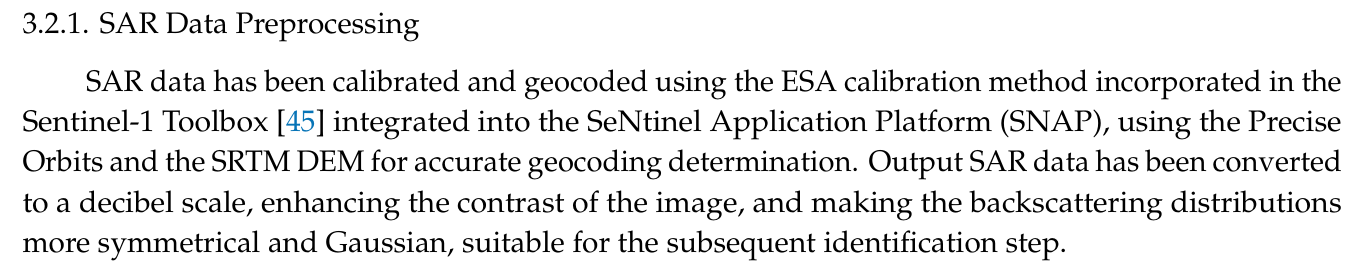
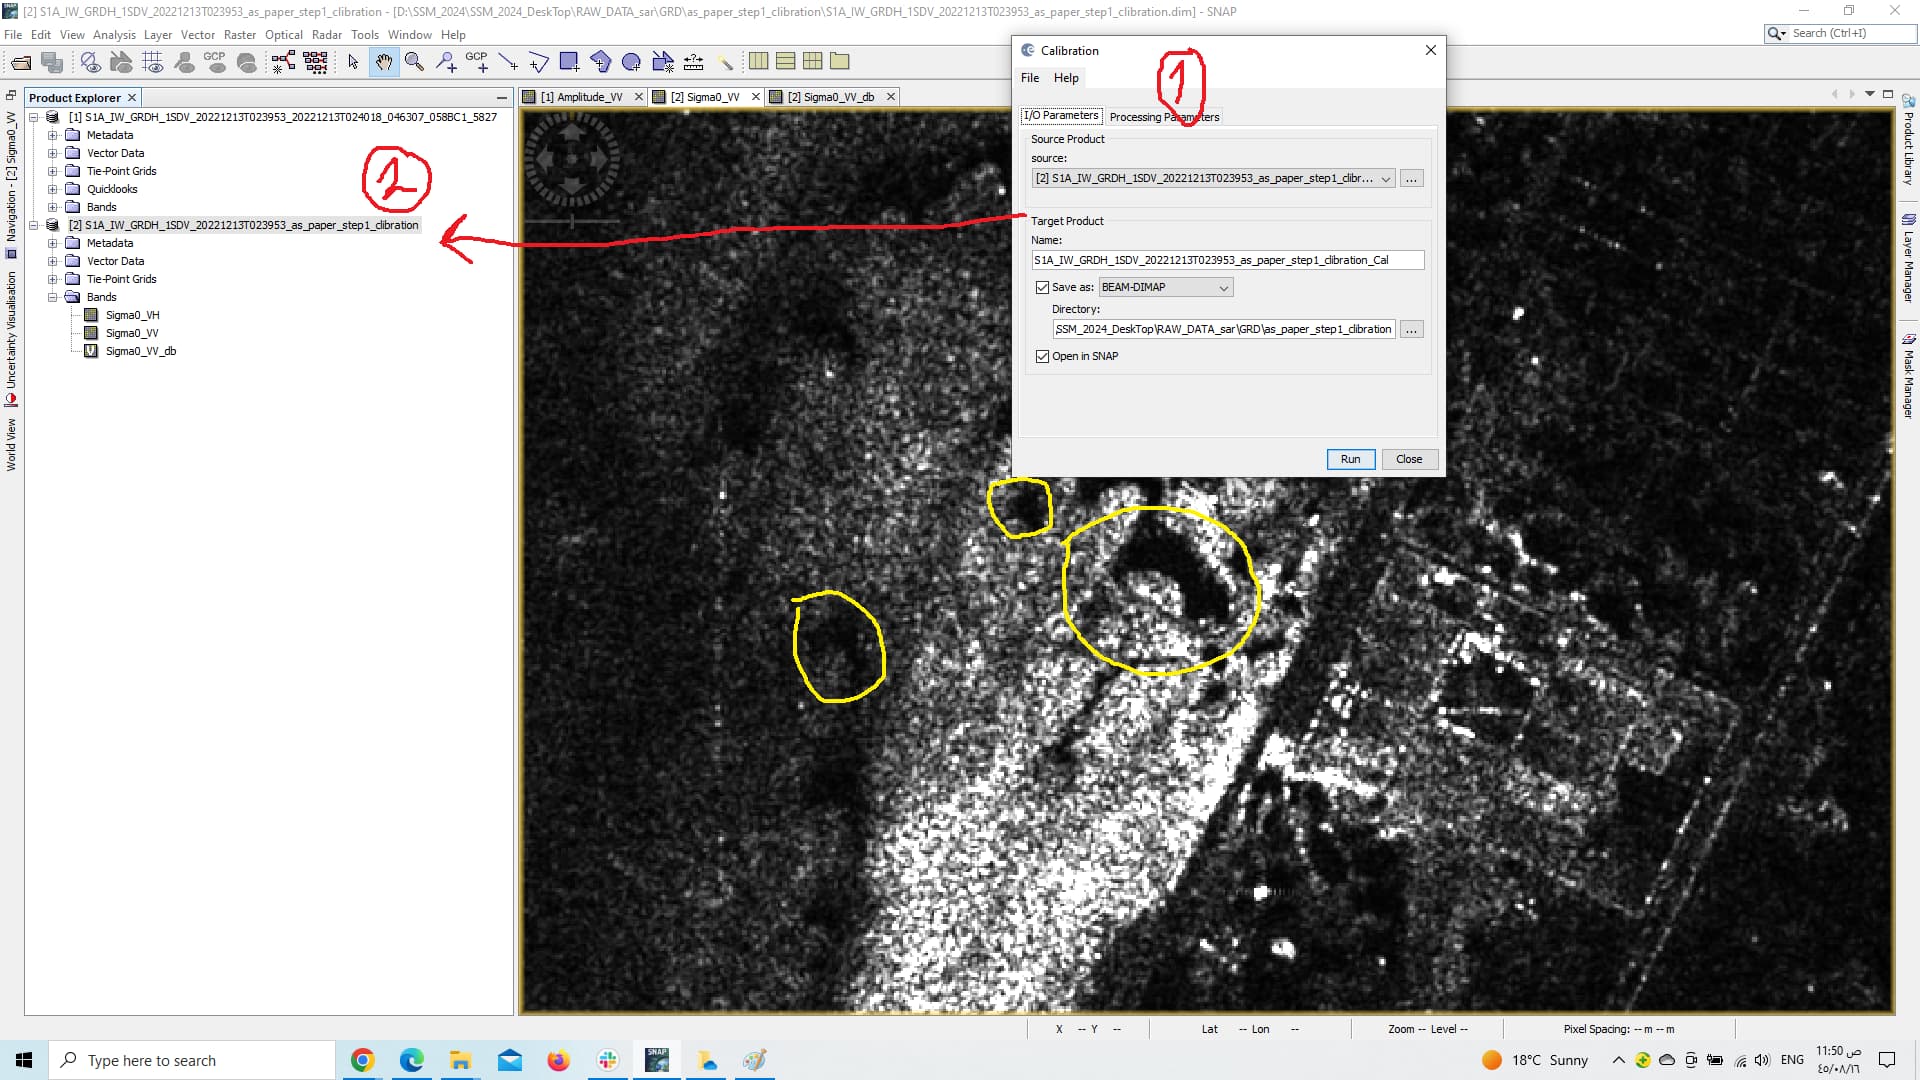
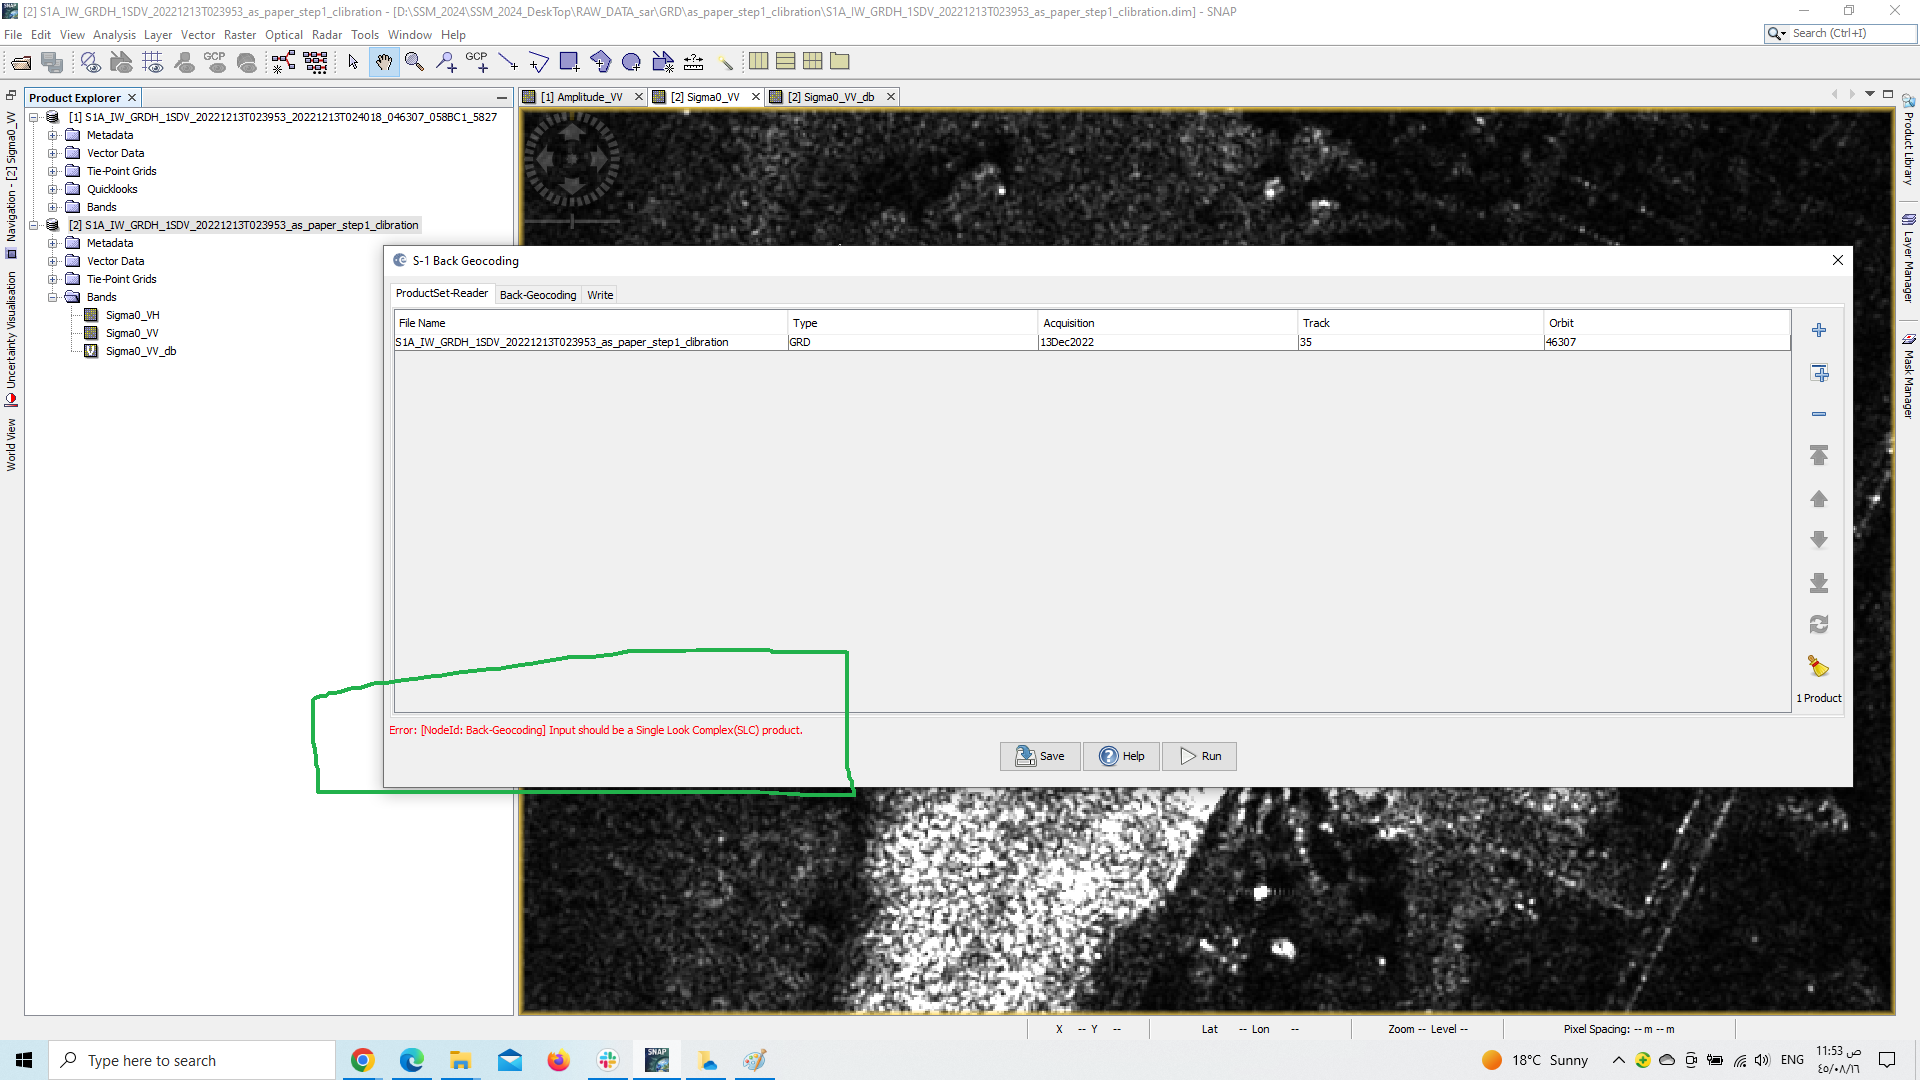
you mentioned in the first line that calibration and geocoding are used by SNAP, based on this I downloaded the GRD amplitude vv “Please correct me if the type of data does not meet the study!”, and calibrated as shown below “The yellow represents some of Barchan Dune looking to detect”
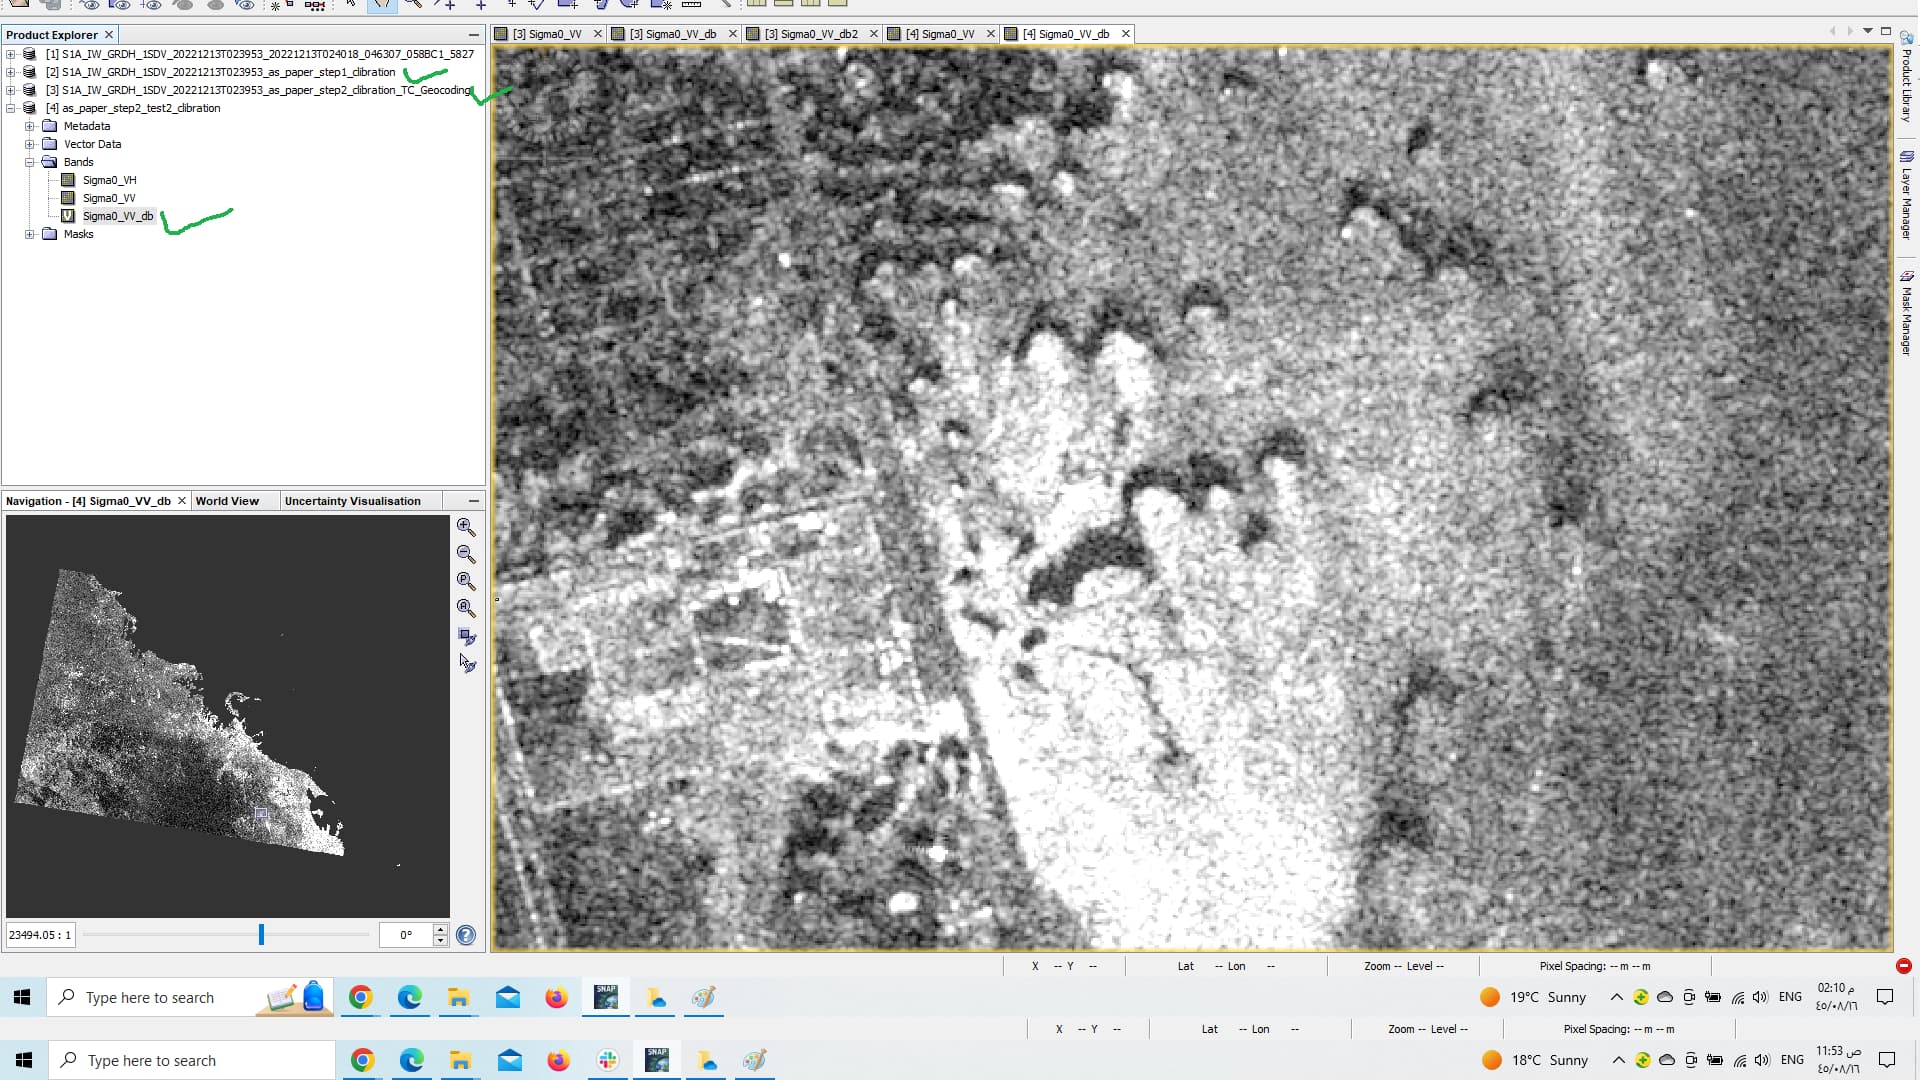
Sir … there is update as shown below "Please give me thump up if preprocessing is completed based on 3 check green (calibration, geocoding, and dB)" Are you advising me to looking a way to start with HSBA? thank you in advance
Hello Sir, I have also been using offset tracking recently. May I ask whether the offset tracking results obtained by SNAP software are processed with inverse sign(e.g. negative numbers become positive or positive numbers become negative)?