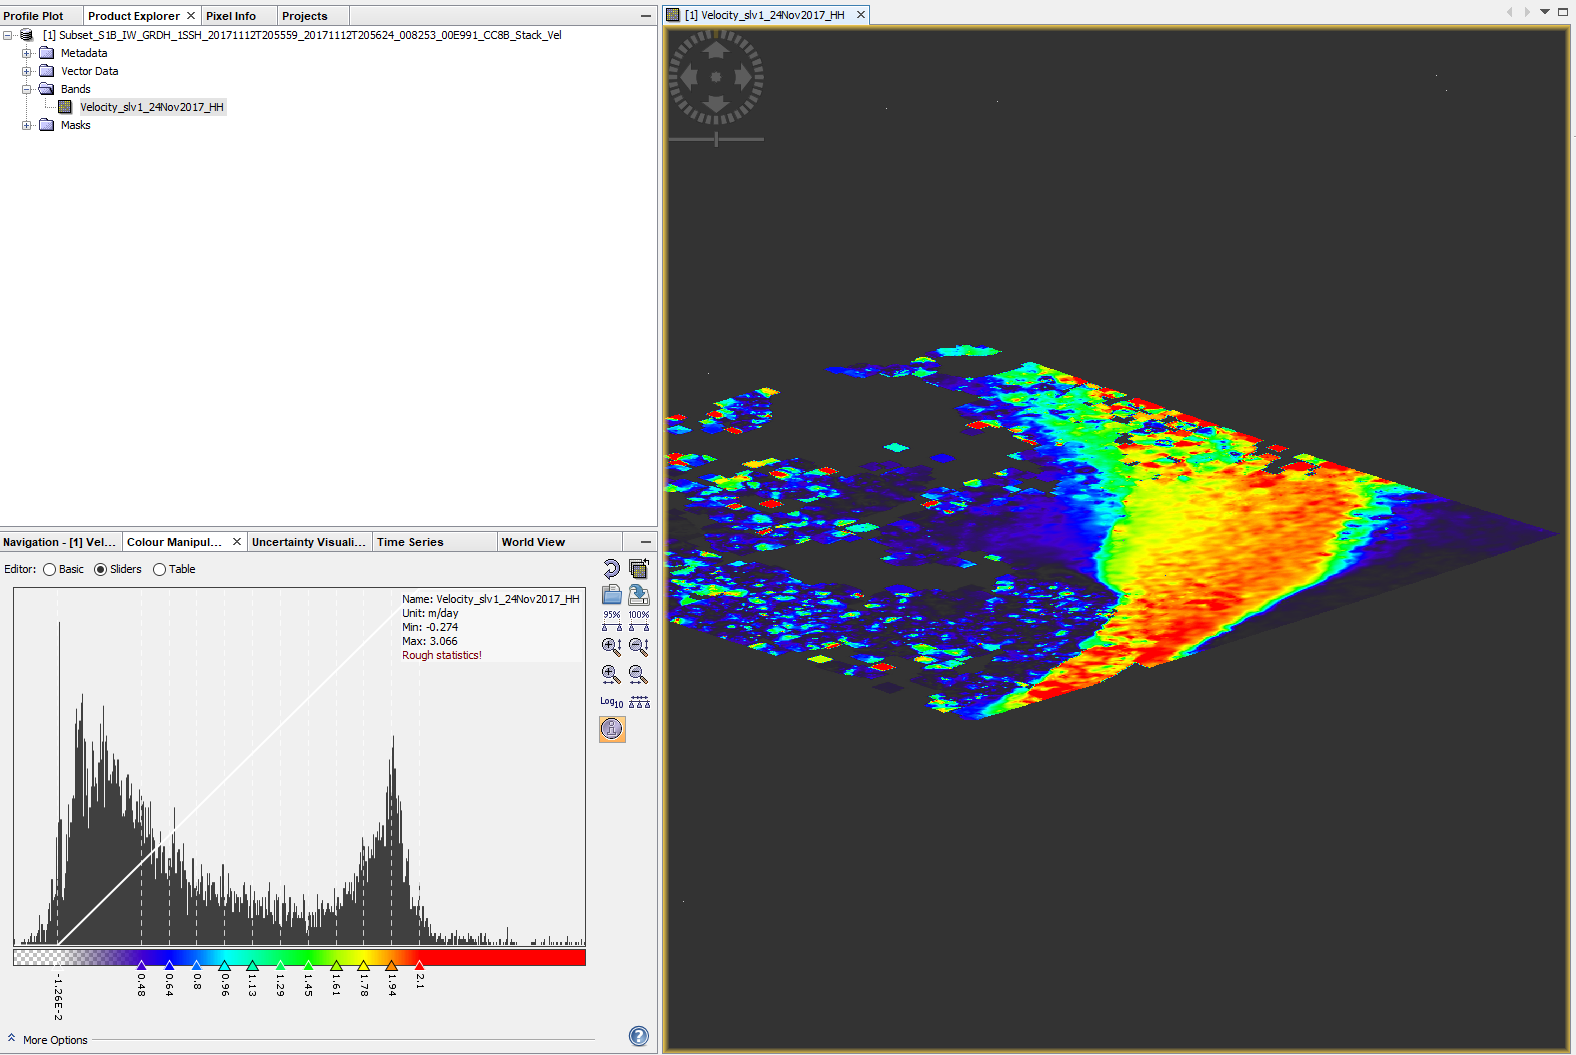
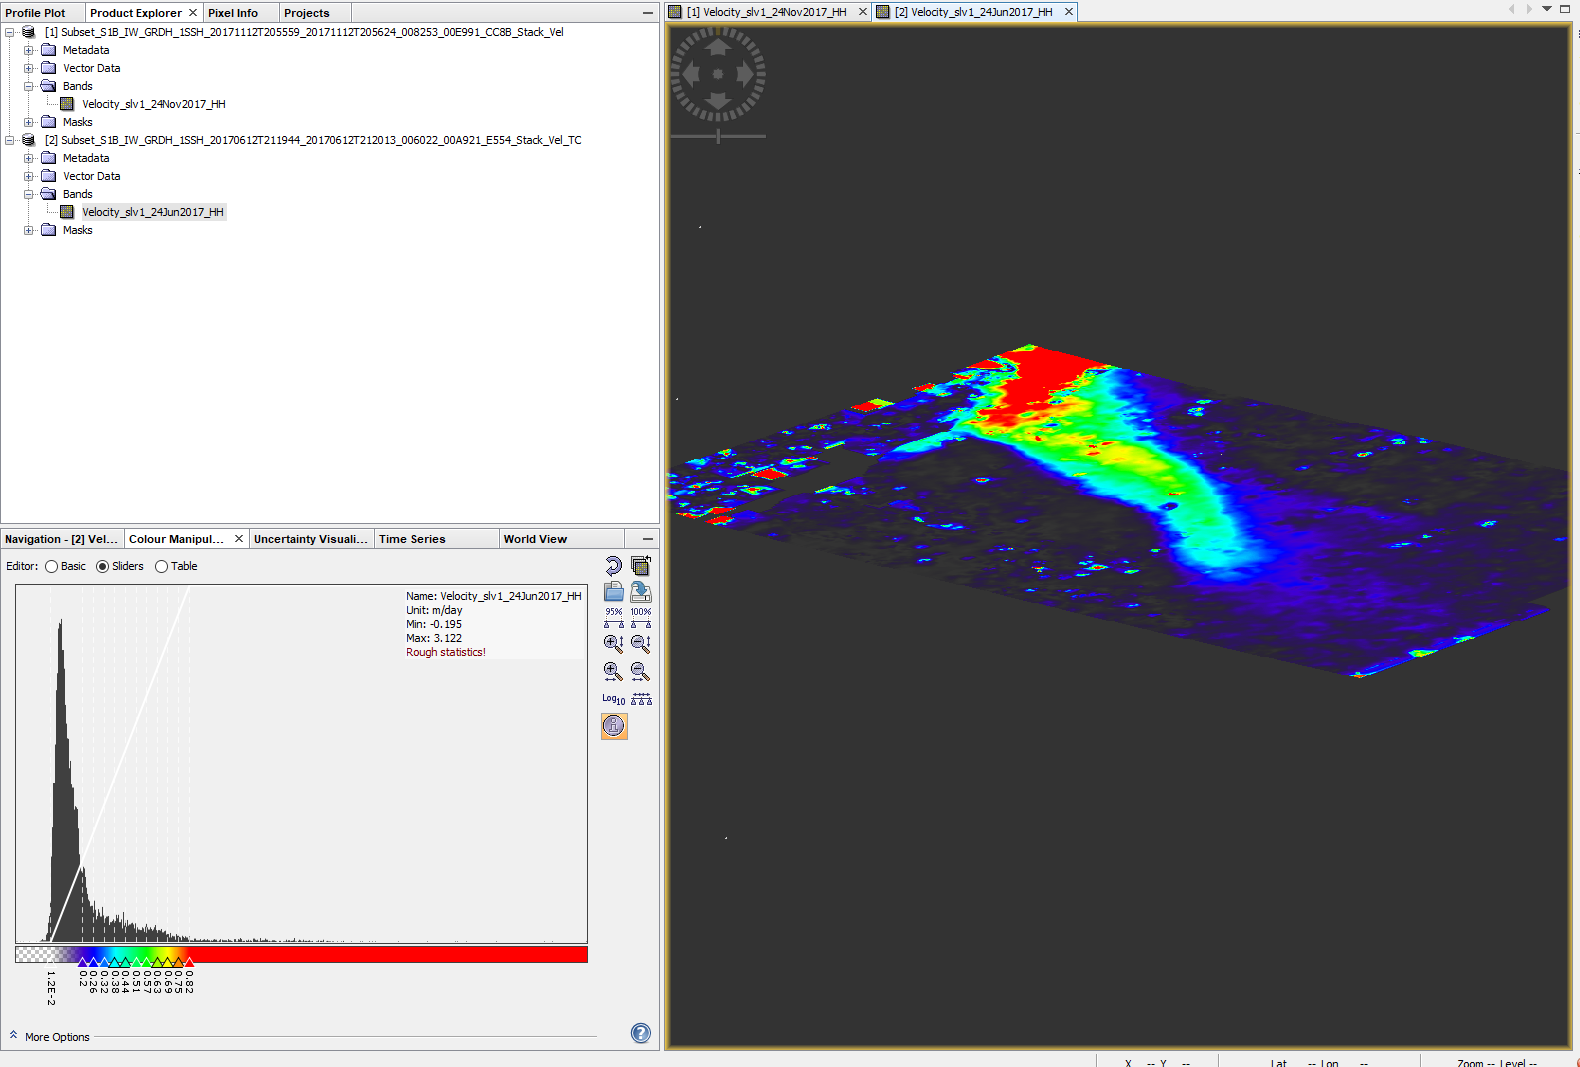
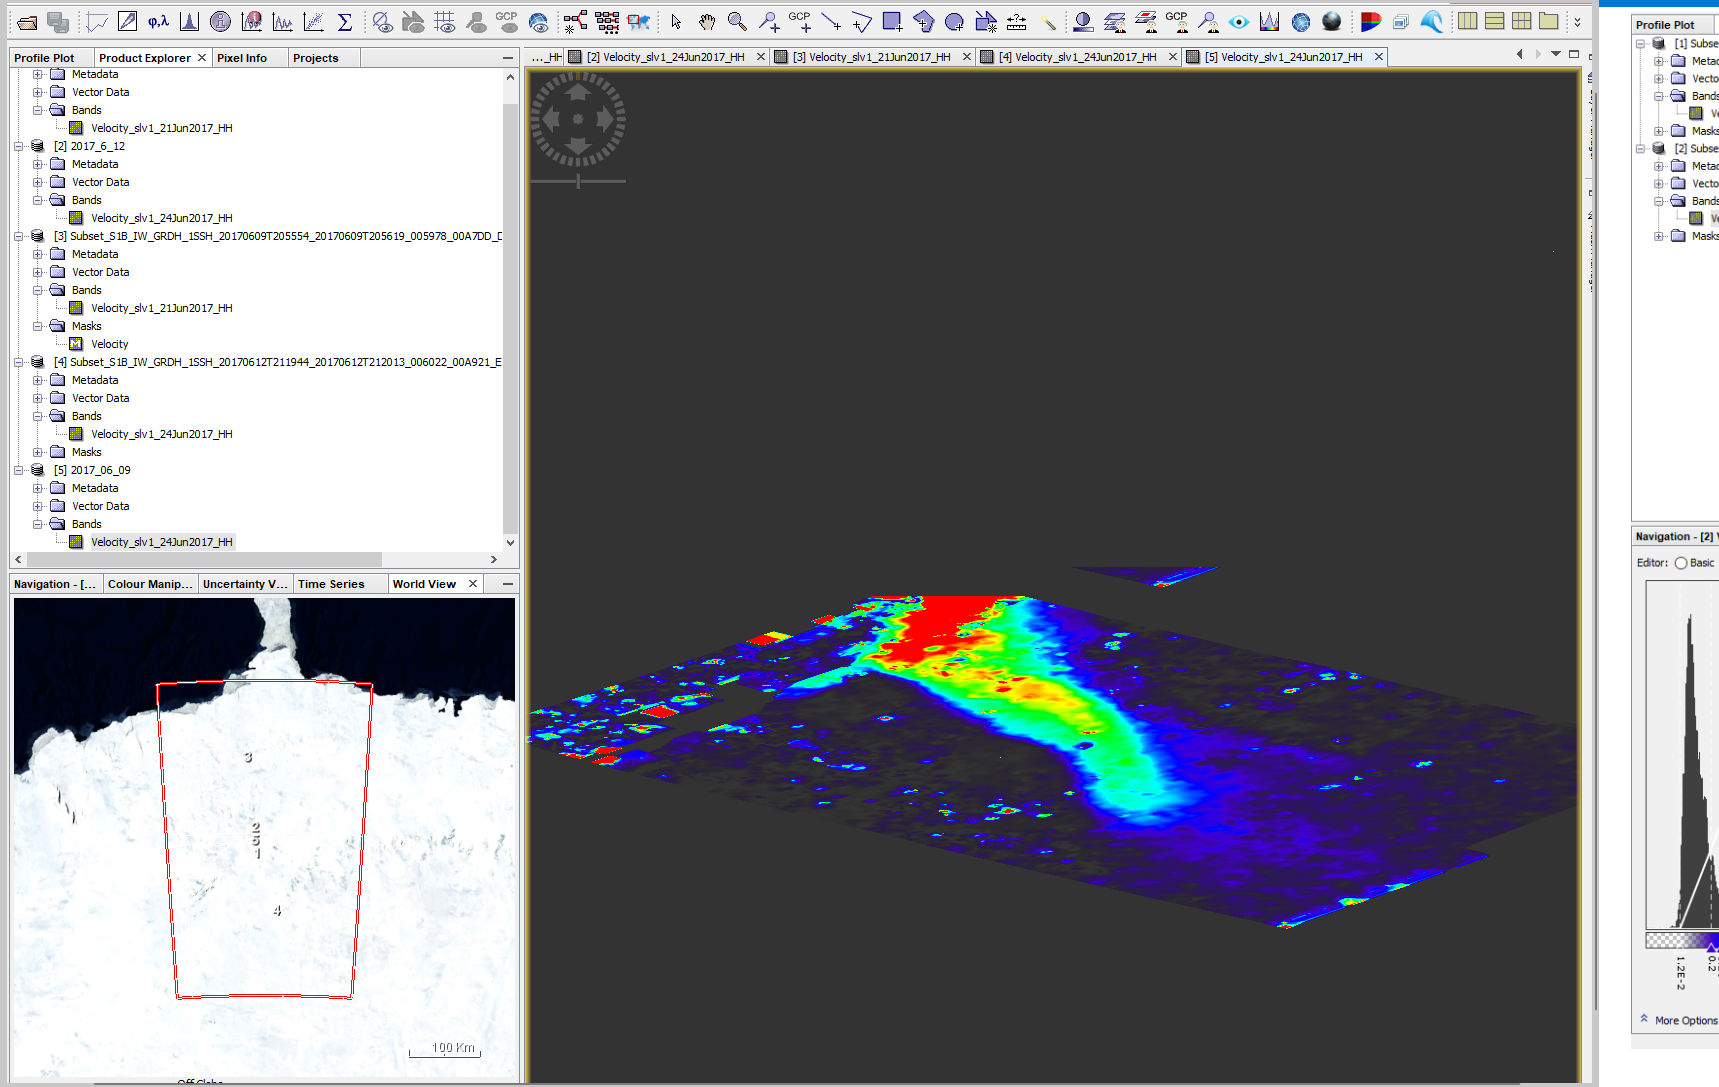
So, these two images are the part of one large outlet glacier in Antarctica. I am trying to calculate the montly velocity of this glacier.
In the first image, I want to remove the values more than 2.5 m/day and less than 0 m/day.
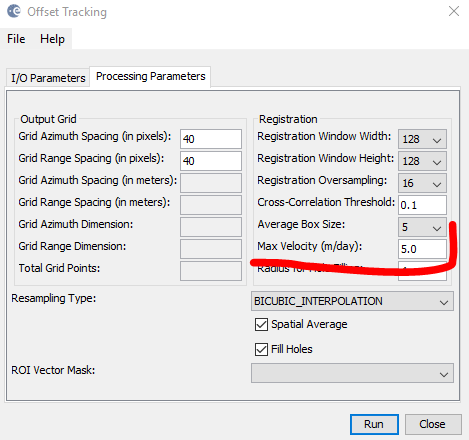
Also I want to create a time series analysis of this glacier for the whole year. I have calculated the velocities using the offset tracking and I plan to do the following processes.
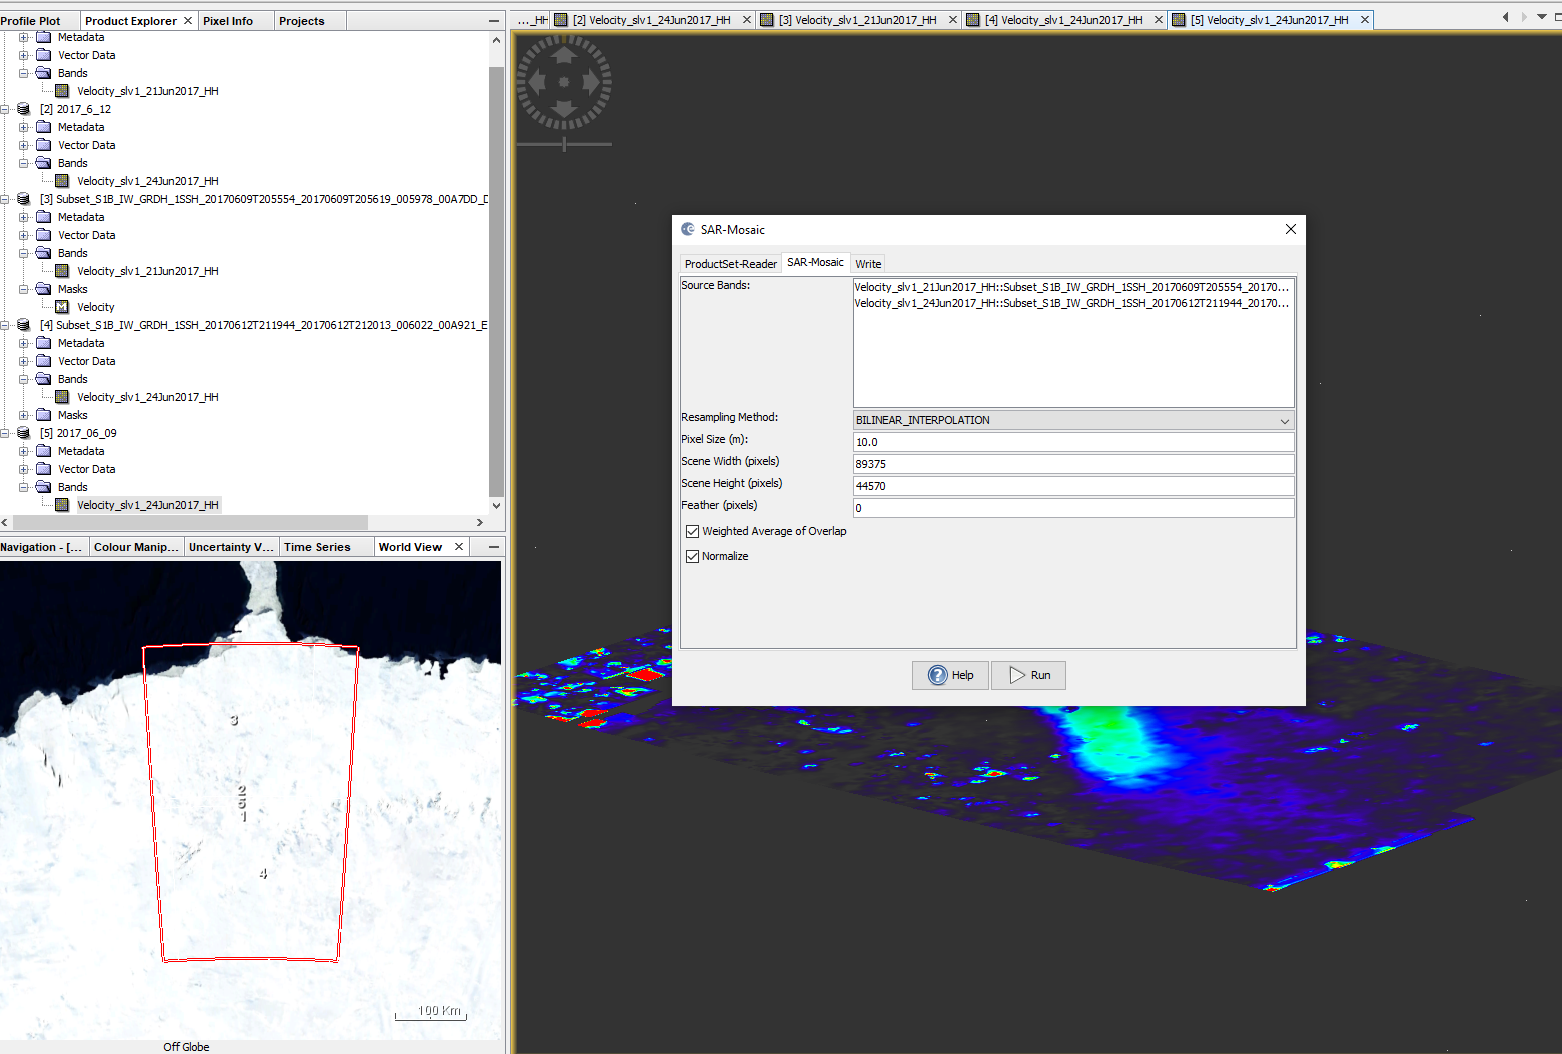
mosaic the two scenes.
Create stack.
Using value tool in the Qgis for time series analysis.
Please correct me if I am wrong or missing some steps here.
Thank you.
Stacking in SNAP is not needed, simply open each date’s img file (in the data folder) in QGIS.
But if you want to remove the pixels afterwards, you can right-click on the raster and select Properties and define a valid pixel expression: Velocity_slv1_24Jun2017_HH > 0 AND Velocity_slv1_24Jun2017_HH < 2.5
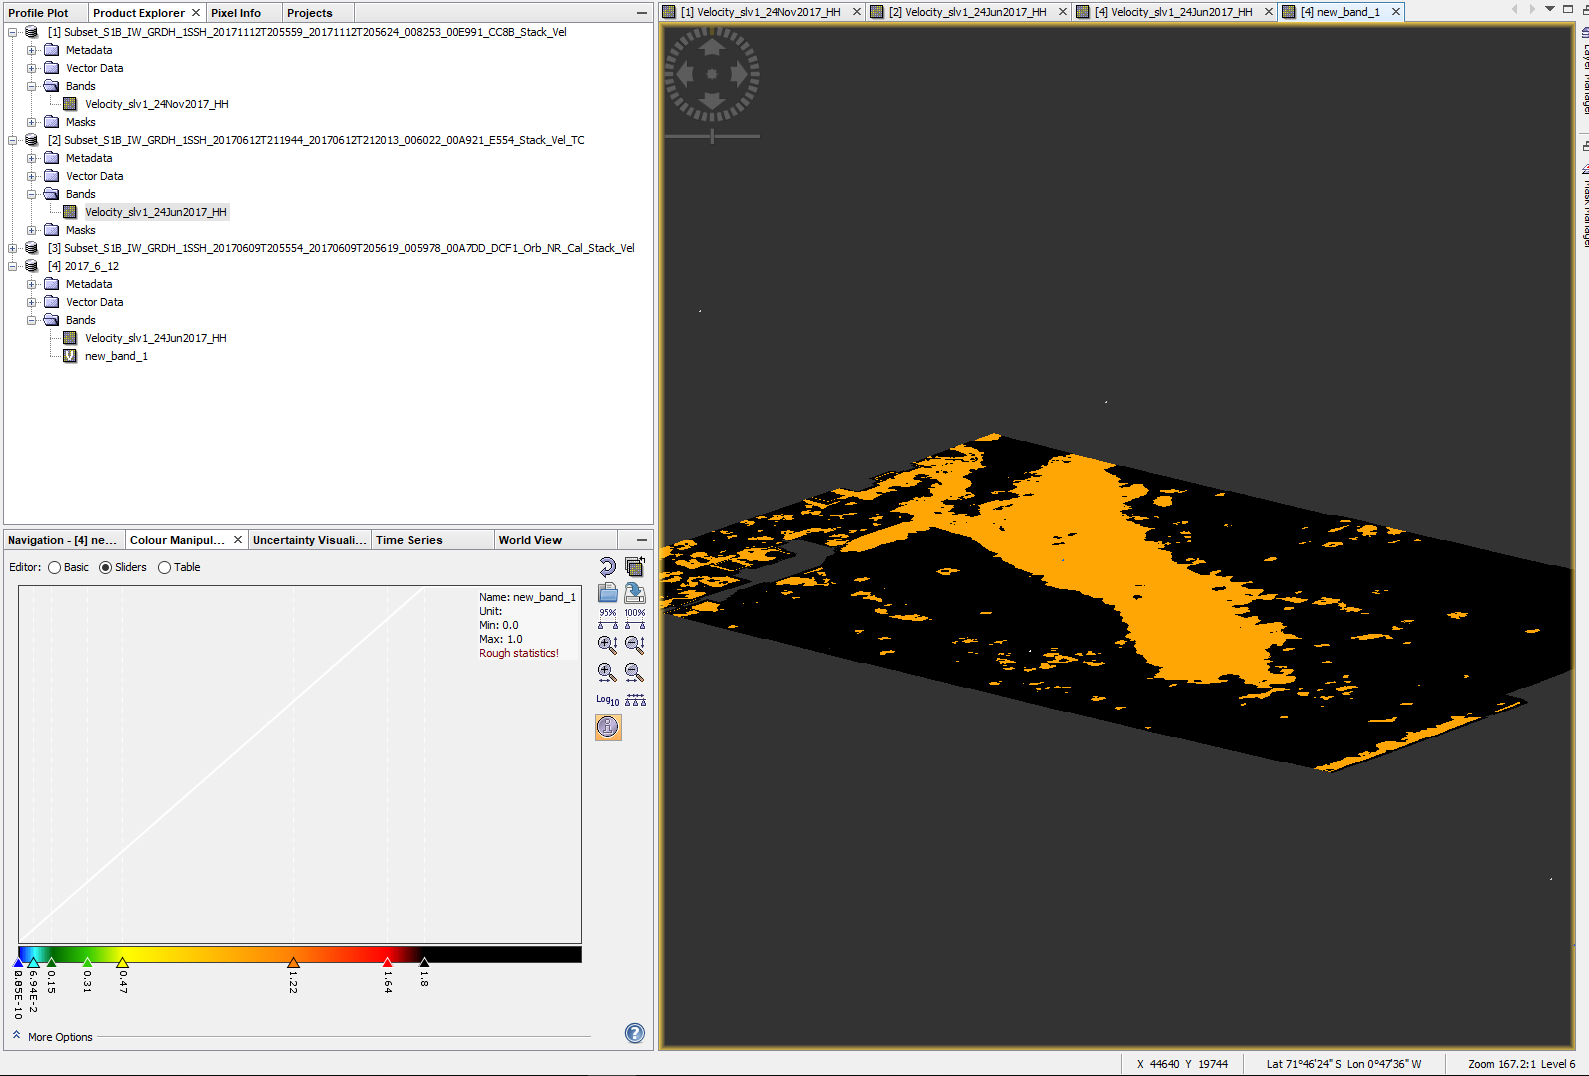
When I tried to remove the pixels, all it do is put whole value between 0 and 2.5 to 1 and rest to null. So, I can’t analyse the variation in the velocity.
don’t enter this expression in the band maths, this creates a binary raster (as this one, 1 where true, 0 where false) .
directly enter it in the valid pixel expression of the Velocity raster. Let us know if it works.
Hi again!
I tried to mosaic the two scenes using Radar > Geometric > SAR - Mosaic. In the world view, it shows that it has been mosaicked. However, I get the product as shown in the figure. Is there a way to fix that or did I just do it wrong.
what is defined as nodata in your properties? Maybe you have to remove that, save your product afterwards (File > Save Product) and then run the mosaicing again
The problem is now solved. What I did is first merge the images using S1-Assembly, then Calibration, Dem-Assisted coregistration and offset tracking.
Note:
For the images after March 12 2018, first calibration is expected before assembly and for the images before March 12 2018, assembly can be done before calibration.
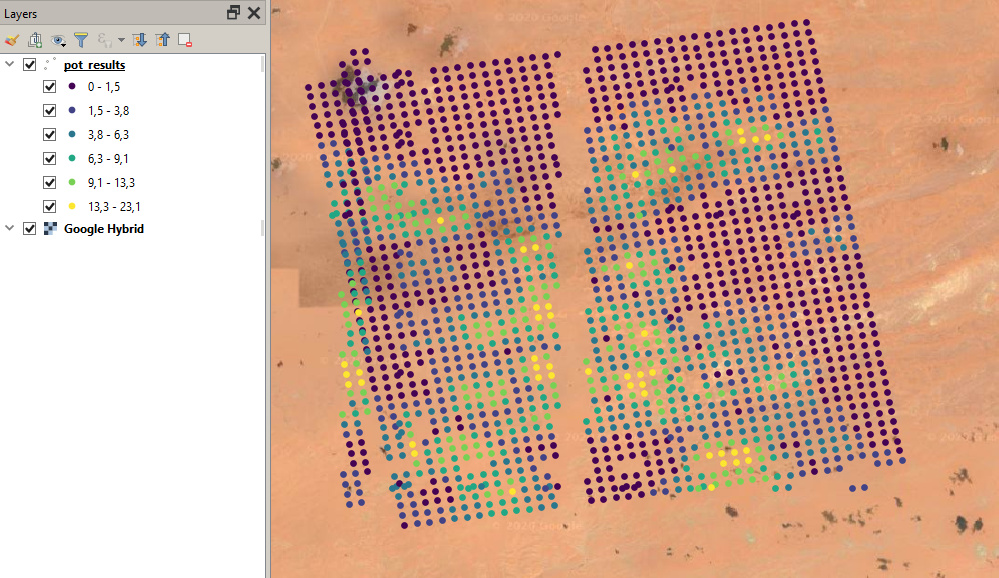
@ABraun, I have used the offsets tracking operator to calculate the pixel offset.
Then use Export Mask Pixels to export the results.
But there is no range_shift and azimuth_shift in the result file.
(Attach the result file)pot_results.txt (198.9 KB)
You’re right. Actually what I want to ask:
I also exported the POT results earlier (see attachment pot_results2). There are two columns in pot_results2.txt, range_shift and azimuth_shift, but not in pot_results.txt
I always use SNAP7,how can I solve this problem? pot_results2.txt (2.5 MB)
Yes, I have been using Export Mask Pixels to export .txt files.
I want to achieve the result according to your post (below)
However, there are obviously no fields such as heading, range_shift, azimuth_shit and their values in the exported results(pot_results.txt).
I tried File>Export>CSV to export a .csv file but the result is the same.
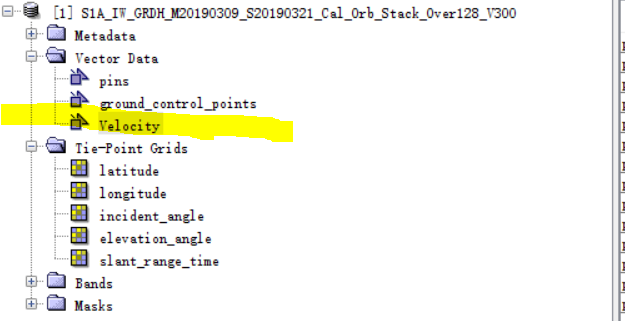
At the same time, I also checked the GCP Movement layer through the Layer Manager and displayed it, which looked normal.
now I understand. No export needed in this case, the CSV fils should already be in the vector data folder of the product (output of the offset tracking module). Have a look in the file system.