Hello everyone,
I would like to point out an issue related to the oil spill clustering operator. It appears that the OilSpillClusteringOp works differently in the SNAP GUI compared to snappy.
Here’s a couple of example images:
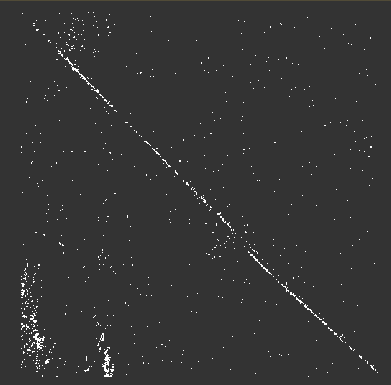
OUTPUT FROM SNAPPY
OUTPUT FROM GUI
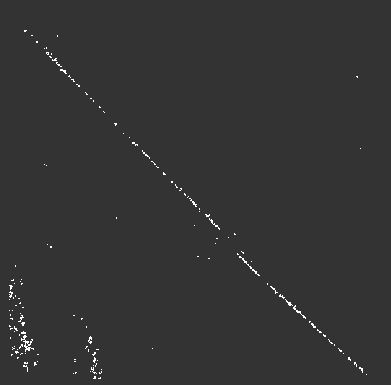
I have a subset of about 30x30km, and I have used the same settings in both approaches ( Land-Sea-Mask shorelineExtension=10, Oil-Spill-Clustering minClusterSizeInKm2 = 0.005, Oil-Spill-Detection backgroundWindowDim = 3.5 and k=2.0).
I am pretty sure the problem lies with the Oil-Spill-Clustering Operator. Clearly the GUI function works as expected (output clusters have minimum size of 51 pixels). While the output from snappy shows clusters of 1 pixels even.
I have even tried using extreme values such as 5000.0 (I thought maybe the conversion from meter squared to km squared was not done correctly), but no big changes. Clusters of 1 pixels are still present.
I am using SNAP 9.0.0.
However, I have noticed the Calibration operator outputs are also different. The output from GUI has a range [0.002-0.321], while the output from snappy has range [0.001-1.471] and it is visibly darker. Land-Sea-Mask also shows some differences in band ranges: GUI - [22.604-327.6], snappy - [21.224-700]. All of this is of course very limiting in understanding the true performance of my algorithm.
It would be much appreciated if any developer could confirm this.
Thank you in advance.