For example this study area , is this black area indicate oil spills if it is masked by the application or it could be another thing
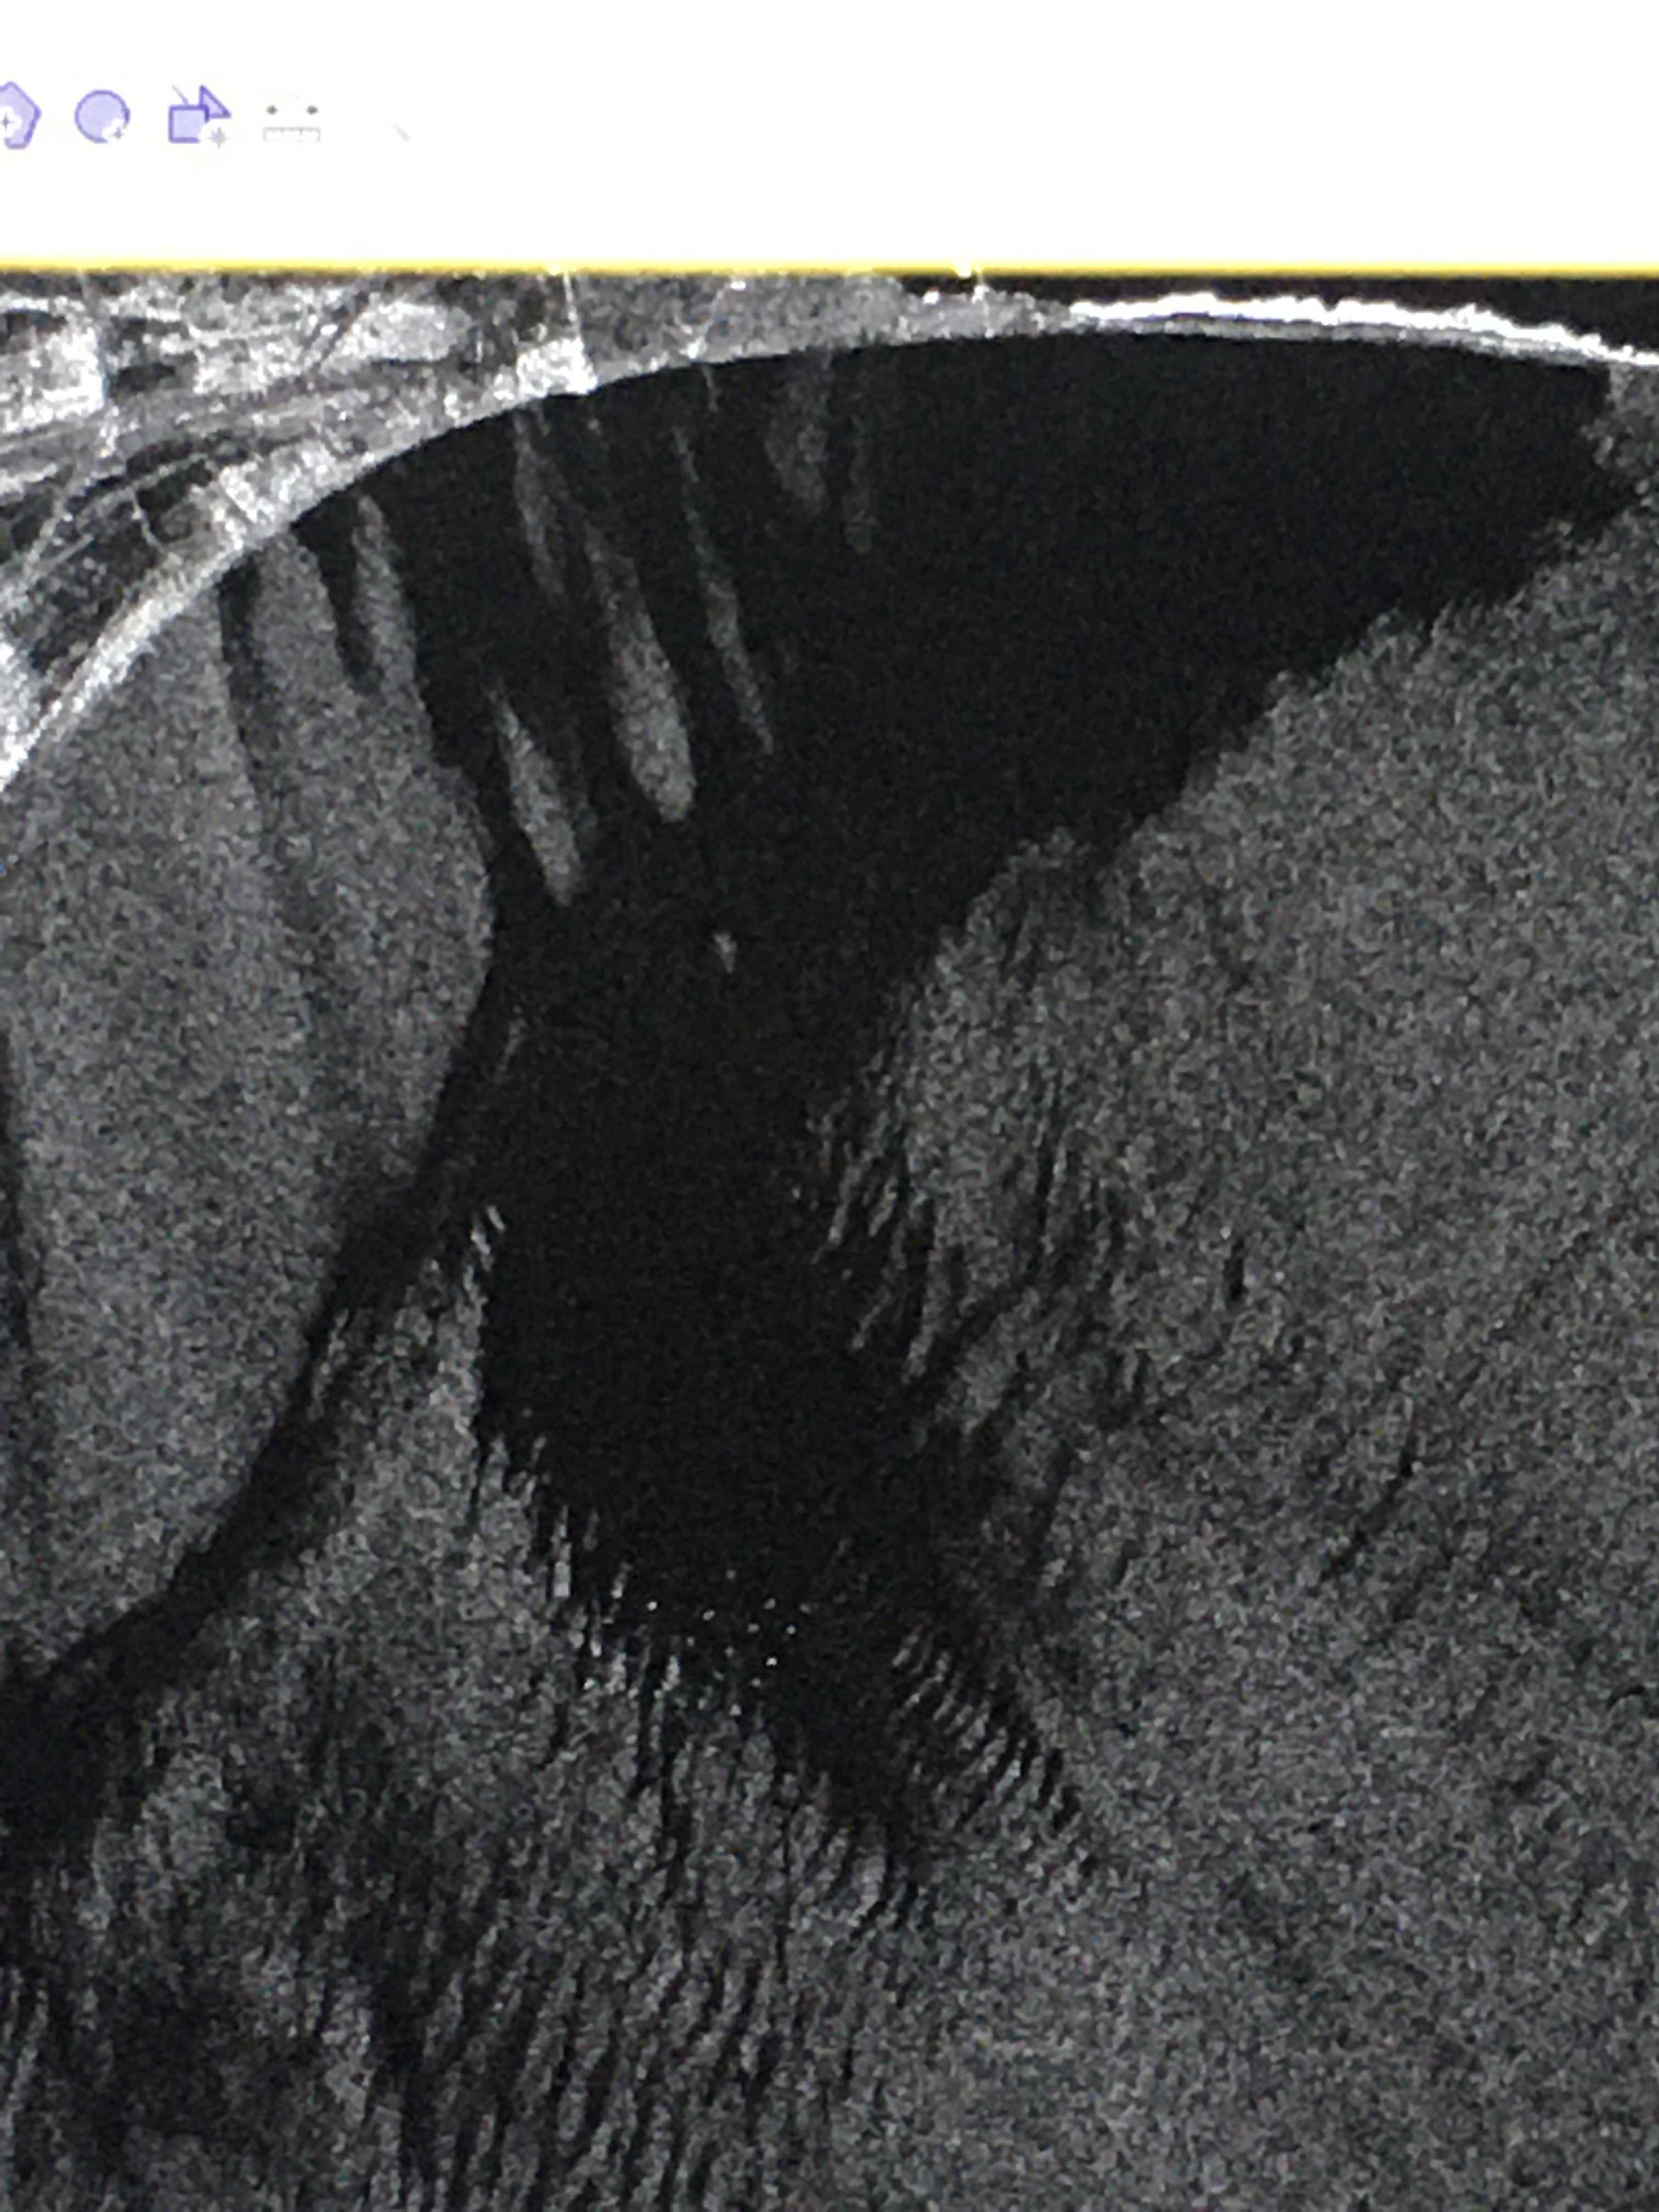
as with every automated extraction of information, there is no guarantee that the oil spill mask is perfect. The tool just provides a replicable and objective way of doing it.
It all depends on the smoothness of the sea surface. You might have a look at these chapters of the SAR Marine User’s Manual:
Unfortunately, Oil spill detection does not work today with SNAP…
I am running SNAP 9.0.8 on Ubuntu (BTW what a shame that on such an OS, the same name is used for software package manager. Never mind.)
The idea is to try to replicate what can be seen here:
www.esa.int/ESA_Multimedia/Images/2018/10/Oil_spill_spread#:~:text=On%208%20October%202018%20at,was%20about%2020%20km%20long.
A single product can be used to visualise the oil spill, for instance:
S1A_IW_SLC__1SDV_20181008T052755_20181008T052822_024040_02A081_3524.zip
In SNAP, you can navigate to Radar > SAR Applications > Ocean Applications >
Oil Splill Detection.
It opens a dialogue that shows the steps and the corresponding options of a Graph-file that
should be able to run and do the job.
Now, the original “Read” step works fine.
The problem comes from the next step: “Land-Sea-Mask”. It generates an error:
“The multi-size source product is not supported.Please, use resampling processor before. Or use the default graph 'Raster/Land Sea Mask For Multi-size Source.xml’in the graph builder.”
Nobody seems to refer to this issue out there. What can be done from there to solve the problem is not obvious if you are not an expert.
Would any of you be able to explain the different steps to implement a simple oil spill detector with SNAP that works?
Hello @JBagvian,
As the error message says, the “Land-Sea-Mask” does not work on the multi-size products. You should first apply the Resample operator on the source product and run the “Land-Sea-Mask” processor on the resampled product (information also available in the operator’s help page).
1 Like
Hello everyone,
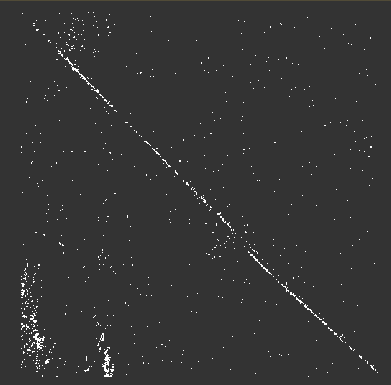
perhaps this is not the right place, but I would like to point out another issue related to the oil spill detection operators. It appears that the OilSpillClusteringOp works differently in the SNAP GUI and snappy. Here’s a couple of images:
OUTPUT FROM SNAPPY
OUTPUT FROM GUI
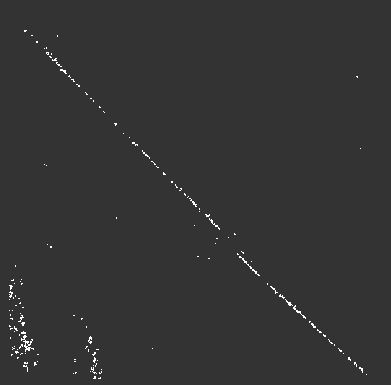
I have a subset of about 30x30km, and I have used the same settings in both approaches ( Land-Sea-Mask shorelineExtension=10, Oil-Spill-Clustering minClusterSizeInKm2 = 0.005, Oil-Spill-Detection backgroundWindowDim = 3.5 and k=2.0).
I am pretty sure the problem lies with the Oil-Spill-Clustering Operator. Clearly the GUI function works as expected (output clusters have minimum size of 51 pixels). While the output from snappy shows clusters of 1 pixels even. I have tried changing the value to 5000.0 (I thought maybe the conversion from meter squared to km squared was not done correctly), but no big changes. Clusters of 1 pixels are still present.
It would be much appreciated if you could take a look @diana_harosa. Thank you in advance.
Sabrina
PS. I am using SNAP 9.0.0.
PPS. I have noticed the Calibration operator outputs are also different. The output from GUI has a range [0.002-0.321] while the output from snappy has range [0.001-1.471] and it is visibly darker. Land-Sea-Mask also shows some differences in band ranges: gui - [22.604-327.6], snappy - [21.224-700].
All of this is very limitating in understanding the true performance of my algorithm.