please I need a help . When I use SNAP to detect oil spills by oil spill detection application , the process run and stop at 16% and doesn’t complete and I don’t know the reason
very likely because of the Land/Sea Masking which tries to access SRTM 3 data. Please see here: A process related to digital elevation models is taking forever to finish
But when I apply land /sea mask application only it take few seconds. But when apply the oil spill detection application it stop after 16٪ . I don’t know if windows defender block this application or another reason
Have you updated SNAP, installed all updates and checked if there are invalid files in the aux/DEM folder?
Yes I update SNAP and all applications work well like split , calibration , multi looking and land /sea mask. Only when apply oil spill detection it start but doesn’t complete . may be windows defender block this application .My computer is 32 g bytes
so what happens when you allow SNAP to pass the firewall?
First , all applications doesn’t complete but when I disable windows defender ,only oil spills detection application doesn’t work. Please , how can I check if there are invalid files in the aux/DEM folder .
it is described in the link I posted above.
Could applying oil spills detection tool take more than one hour to progress or my PC with 32G not suitable for this application and need more than 32g

32 GB RAM is absolutely sufficient for this task. I still believe this is related to the SRTM 3Sec data which is involved int he LandSea Mask operator
I try all the solutions in your link and try land sea mask application and do it .I don’t know the reason
you could apply all steps one by one, instead of the processing chain offered by the Oil Spill operators. They are all available as separate modules.
How can I after calibration apply oil spills detection and oil spill clustering as separate applications please . I do all steps but I don’t know these two steps how to apply
you can find the single components in the graph builder.
So you can apply masking and calibration via the menu, then create single graphs
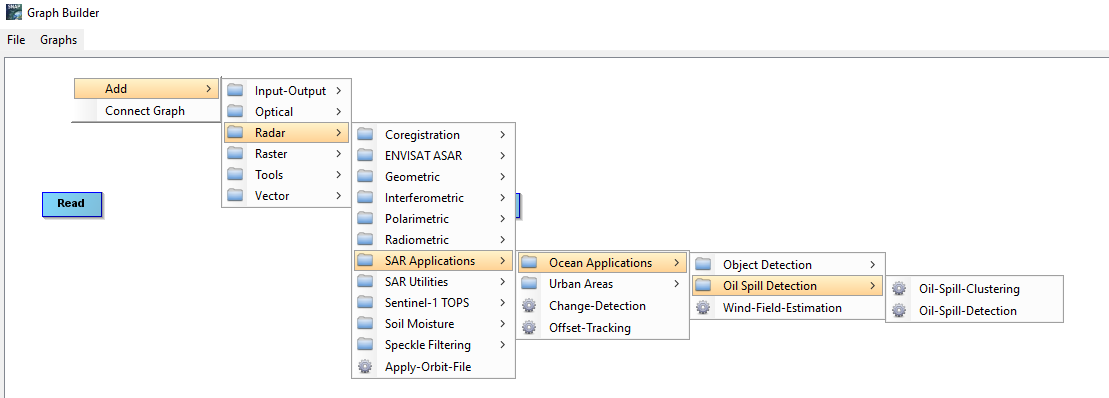
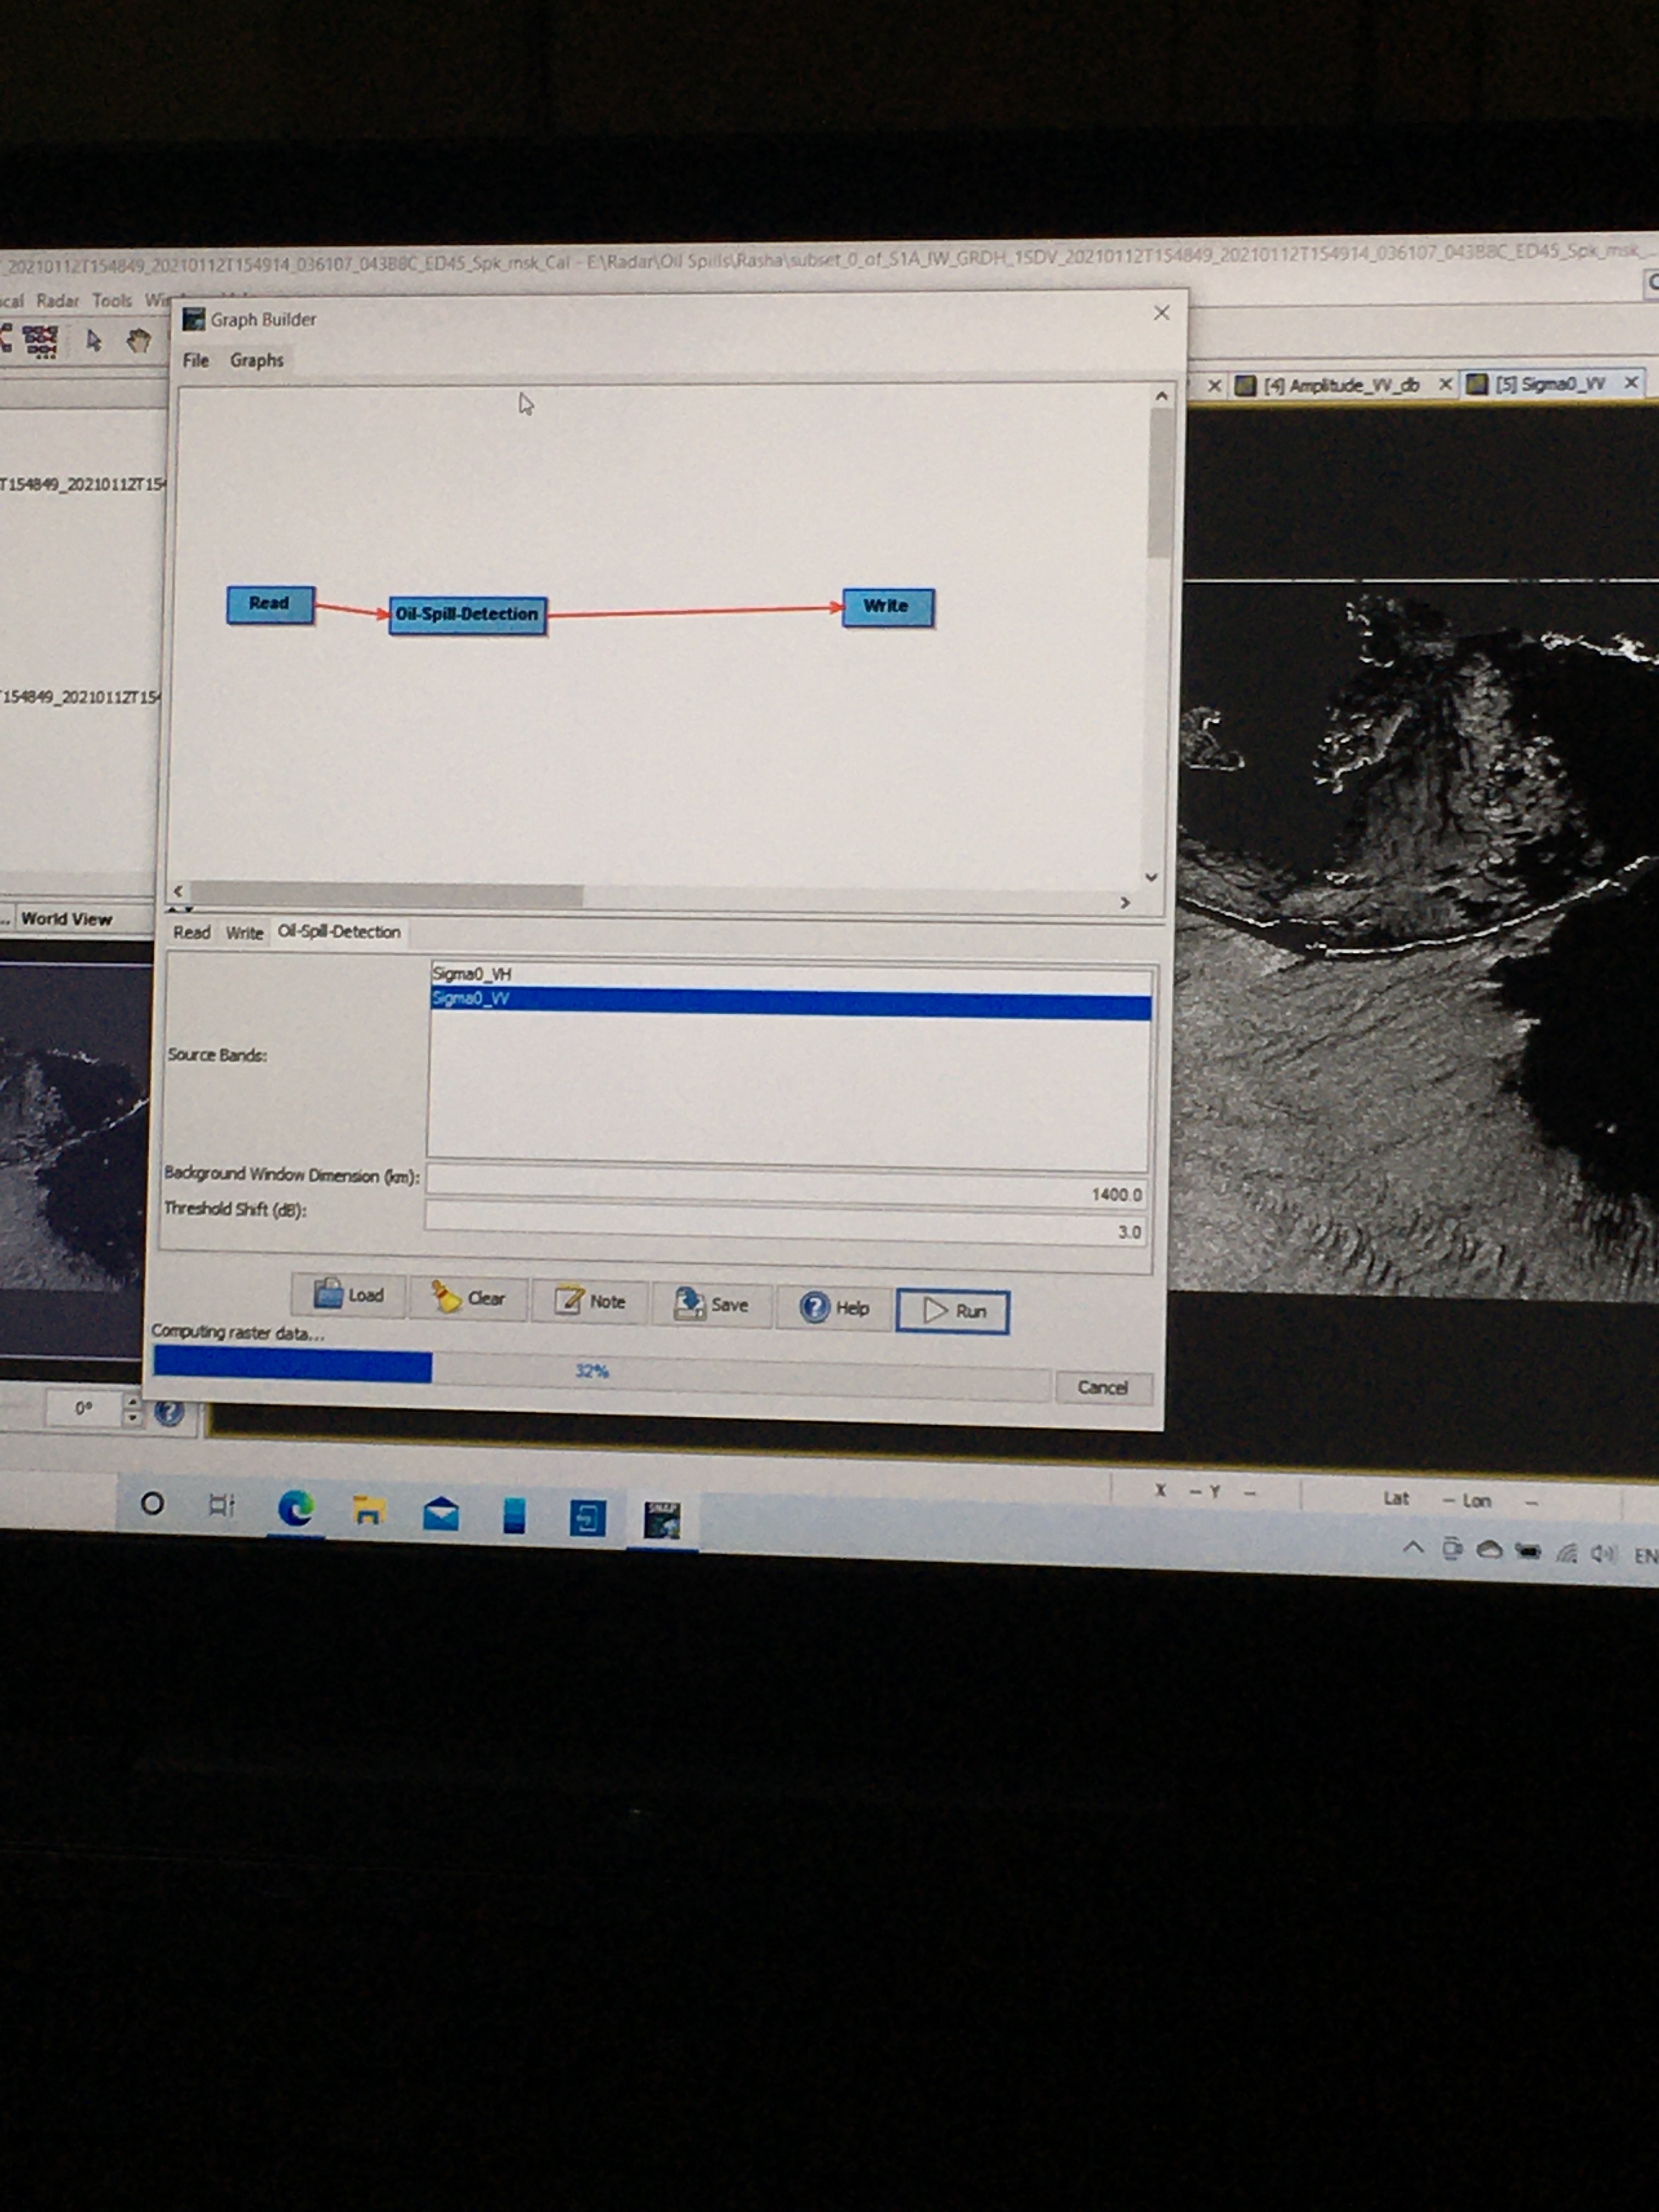
Read > Oil-Spill-Detection > Write
Read > Oil-Spill-Clustering > Write
(maybe these can even be merged into one graph)
Then you can apply Ellipsoid Correction to the result to project it into a coordinate reference system
Thank you very much . You are very helpful. I appreciate your help prof. Andreas Braun
Please prof., I apply all mask and calibrate and do it. Then , l apply oil detection application as you discussed to me but it took 3 hours to reach 38% , is this normal to take this long time?
which step exactly takes the longest?
then it is no longer related to SRTM data, you’re right.
Have you tweaked your memory settings so SNAP can make use of more RAM in the snap.conf file? A description is given here.
If you have 32 GB you can easily allow SNAP to use 24 GB of it, I would say.
Please Prof. The oil spill detection took about 16 hours and finally completed. Is the masked area actually represented oil spills in the study area or It could be indicate another thing rather than oil spills . How can I confirm that the masked area extracted from the application represented oil spills detection?