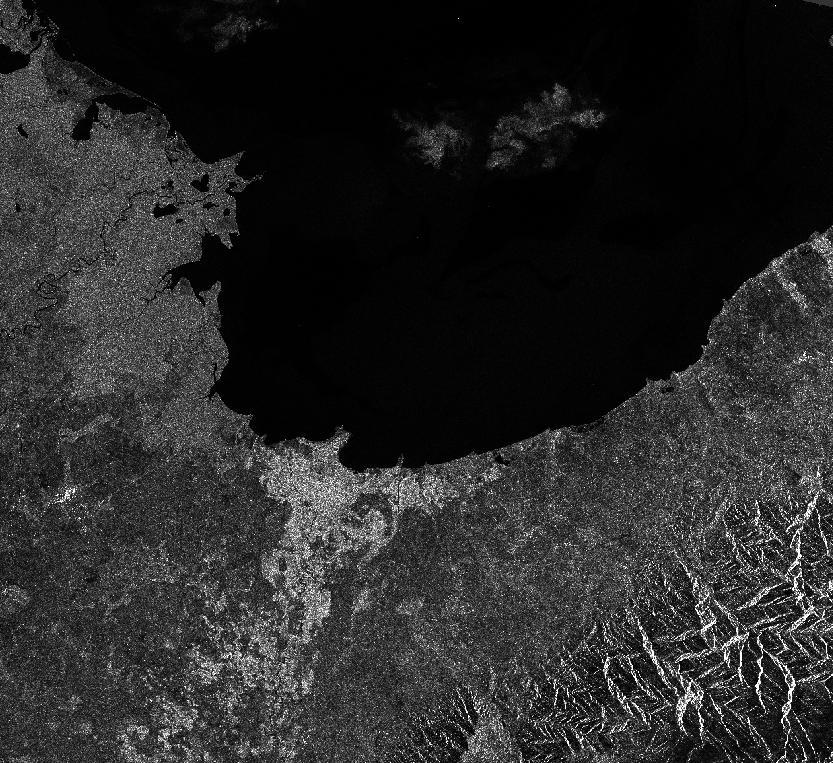
I am working with Sentinel1 SAR Data in order to detect oil slicks in Lake Maracaibo, an area with frequent and massive oil spills easily visible with optical sensors like Pan-sharpened Landsat8 Natural Color. In rainy season, this task is not so easy due to cloud coverage so this is my main reason to use SAR Data. I am using SNAP 4.0.0 tool to calibrate an VV Image and then using Sigma to detect oil spills in the SNAP MENU: Radar, SAR Applications, Ocean Applications, Oil Spill Detection but the result is not even near to the reality. Any help is welcome. Also I have some questions,
-
I am observing some spots very similar to clouds over water. Is this possible with Sentinel1 SAR Data? Could be phytoplankton?
-
Can VHVV data improves the result obtained using just VV Data?
Thanks in advance for any help!