I’ve been trying to use snappy to open the incident_angle tie point grid as a numpy array. But I’m running into some problems. My first effort was to use the getTiePointGrids() command below:
A similar method works with the bands of the image. But with the tie point grids, theta becomes a jclass object, not a numpy array. type(theta) = <class ‘[F’>
So I’ve been trying to use the getRasterDataNodes() command:
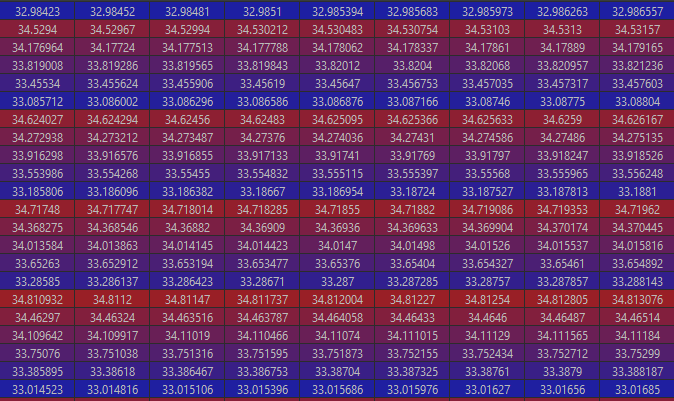
This gives an np array of the size, [width, height], but the numbers seem suspect:
It looks like the smaller, non-interpolated tie point grid was just repeated until the array reached the size [width, height]
Can anybody explain to me how to get the tie point grids as an np array?
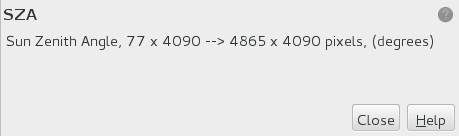
I noticed that the TiePointGrids in S3 OLCI are the same height than the other data bands but much smaller in width. If I understand correctly, when you open the TPG in SNAP desktop, you are actually seeing an interpolation of the product, as seen in the properties:
Here is the example of a script (quickly written, please excuse sloppy coding) where I read in certain TPGs at image resolution and perform operations on them:
Thank you for the response!
I just read through your code. If I understand correctly it takes the smaller tie point grid, processes it into the larger interpolated tpg, and sticks that back into a .dim file. But it doesn’t seem like it makes it so that you can pull the tpg at any resolution into python.
I’d like to be able to read the tpg as a numpy array. If I’m reading it right, the only step in your code that holds the tpg as a numpy array is the current_raster = current_tpg.readPixels(0, 0, width, height, array) line but if I do that I get the same error described above, with the repeated tpg.
Do you know if there is any way to either read the tpg at image resolution in python, or read it at the smaller (non-interpolated) size, and use numpy to interpolate it up to full size?
then you populate with the opened TPG: current_raster = current_tpg.readPixels(0, 0, width, height, array)
So in my case you can set the array to the resolution of the original TPG or the image.
But this doesn’t help you because you are getting a jclass object in return. I don’t have this issue, so I can’t help. Maybe @marpet can figure out why you don’t return a numpy array?
Ah I see now. Unfortunately you’re right, I’m getting the same issue. If I read the tpg using prod.TiePointGrid() then use .readPixels() I get the jclass object. When I use prod.getRasterDataNode() then .readPixels() I get the array at full resolution but with the odd repeating pattern.
Has anybody else run into this issue? Any solutions?
Thank you for taking a moment to look at this, I really appreciate it.
Just a thought: have you tried reading the TPG into an empty array (with your method that works) of the size of the TPG (i.e. 77px wide), then after resample it to the full size using numpy?
This gives me a numpy array of the correct size and shape. But the min value of the array is ~30.74 and the max is ~30.75. However the max value in the metadata (‘incidence_far’) is over 36 degrees, so it seems like this approach somehow truncates the data. Maybe it just uses the upper left corner of the full resolution?
I’m confused about the way these methods are working. When I try and read in the full resolution tpg I get values in about the correct range (30-36) but they’re in an odd order (my first post, above).
For nowthe best I can come up with is to use the metadata to get the “incidence near” and “incidence far” values then use a loop to make an array where each column gets the same value, increasing to the maximum. I don’t think this is very accurate, but I’m not sure how else to do it at this point.
The S1 GRD files have a grid of 21x10 for the tie-points. This is what you get when calling getGridWidth() and getGridHeight(). You can find the data in the annotation folder in s1a-iw-grd-hh-20140607t205125-20140607t205150-000949-000ec8-001.xml
In a section like this:
readPixels(...) reads from the upsampled/interpolated data. The interpolated size can be retrieved by getRasterWidth()/getRasterHeight(). It is 24890x16656.
@ncate you only read the upper left corner, I guess. You have assumed this already.
If you only want to get the raw tie-point grids without resampling you need to do the following.
In both cases, an object is returned. And needs to be converted into an array, I guess.
Probably this way:
inc_array = np.asarray(inc_data, dtype=‘float32’)
returns an object is normal. It is actually the same object as provided as ‘array’. The data container provided as ‘array’ is filled with data and it is returned too. If ‘array’ would be null/None a new data container would be created and returned.
Thank you for the response. I was finally able to get the tie point grid at full interpolated resolution! The solution was sort of a combination of all of the above posts. I used:
to get the data into a java object. I converted the java object to an array with:
theta = np.asarray(theta)
This placed all the data onto a single row, so theta.shape gave something like (268573002, ) but the array is easy rearranged with:
theta.shape = (height, width)
I checked the values against the interpolated ones I saw in SNAP desktop and everything seemed to match up. Thank you both for the help, and hopefully this helps out anyone else running into this problem.