I reached the point has mentioned via this post in the last few days,
I found that unfortunately there’s still no method via SNAP, to calculate the intensity threshold of VH, VV,
That’s why I edited and created the Otsu’s method via skimage library to be compatible with GRDHR images, and full preparing the intensity VH, VV, and also getting the threshold is available within my github repository.
Yes, you’re right I miss-interpreted your previous comments, the results of thr. are required in order to create water extent mapping as it’s explained here, make_water_map
Dear @falahfakhri ,
thank you to share this code. Indeed it is very useful.
I am working with the same kind of data (IW GRDH) and I would like to apply the Otsu filter to separate land from the sea and extract a coastline.
I have a question about your code.
Firstly, is there any reason in your preprocessing any calibrations is applied? It seems you are working just with the DN and then after the Terrain correction you transform your data from linear to db space.
Secondly, before applying the conversion with
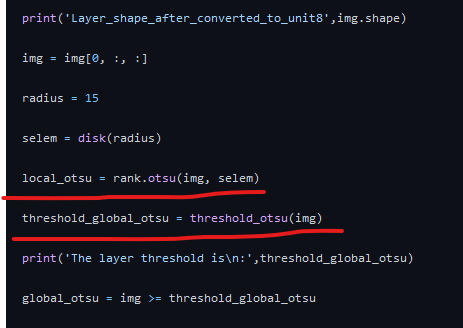
img = img_as_ubyte(vvvh)
, you divide your image by 255. Are you doing that to scale it? If yes, shouldn’t it be something like
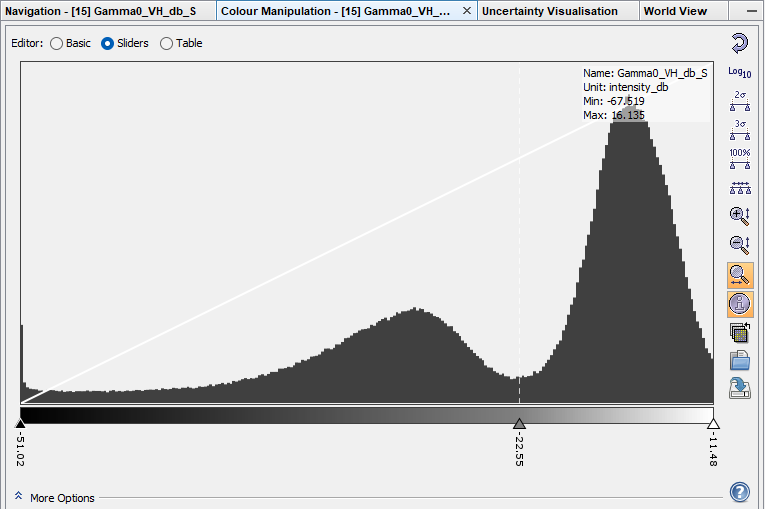
I’m asking because my data after my preprocessing (that include several steps like calibration, Terrain Flattening, etc.) has values in the range in dB [-54.40889358520508, 16.46017837524414].
When I divide them by 255, they are in the range [-0.21336821013805912, 0.06454971911860448]
and so when I transform the data with img_as_ubyte they become in the range [0,1] and the filter doesn’t work.
On the other side, if I scale using the formula above, I will get values between [0, 255] and in this case, the filter gives a reasonable output.
I would like to have your thoughts about this. Any guidance is warmly appreciated.
Hi and thanks a lot for your comments and questions.
First of all I already shared the graph you can update it and follow the same steps. The last step is to follow what I mentioned.
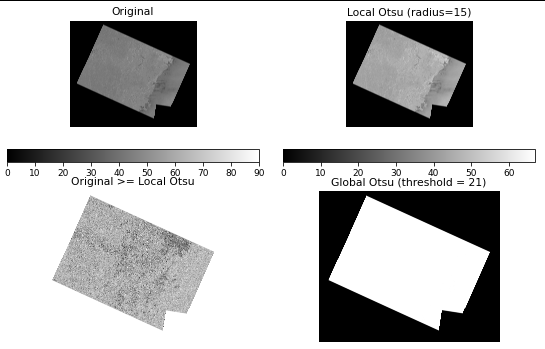
– Thresholding works best when backscatter tiles are provided on a decibel scale to get Gaussian distribution that is scaled to a range of 0-255, and performed on a small tile that is likely to have a transition between water and not water.
– In SNAP after the graph has been run and the intesity of the two pols. has been prepared, in the product explorer expand the bands, right click and select Linear/to from dB. Extract the new dB band and from File tab export it as BigGeotiff.
Hi,
it’s clear what you mean but I don’t understand when your data is scaled. After running your graph, you get a .dim file with 2 bands. Then you convert in SNAP from linear to dB and finally, you export it as a Geotiff image.
Now my question is: if your data is in dB, how you can be sure they are in the range [0,255]?
is it the rasterio command in python that scales your dB values in that range?
Sorry to bother you, but I would like to use your function but I would like to understand how to suit it to my data.
Hi @falahfakhri ,
maybe there is a misunderstanding.
My data after the preprocessing is already in dB as you can see from the plot above.
I am asking, when and how do you scale your data in dB to have them in the range [0, 255] that is a compulsory requirement to apply Otsu?
I don’t see this scaling once you applied your preprocessing.