I am trying to using pconvert tool as well, to convert from single band tiff to png, but it’s not working
I got this kind of error
SLF4J: See http://www.slf4j.org/codes.html#multiple_bindings for an explanation.
SLF4J: Actual binding is of type [org.slf4j.impl.SimpleLoggerFactory]
creating histogram for band ‘newVirtualBand’…
creating RGB image…
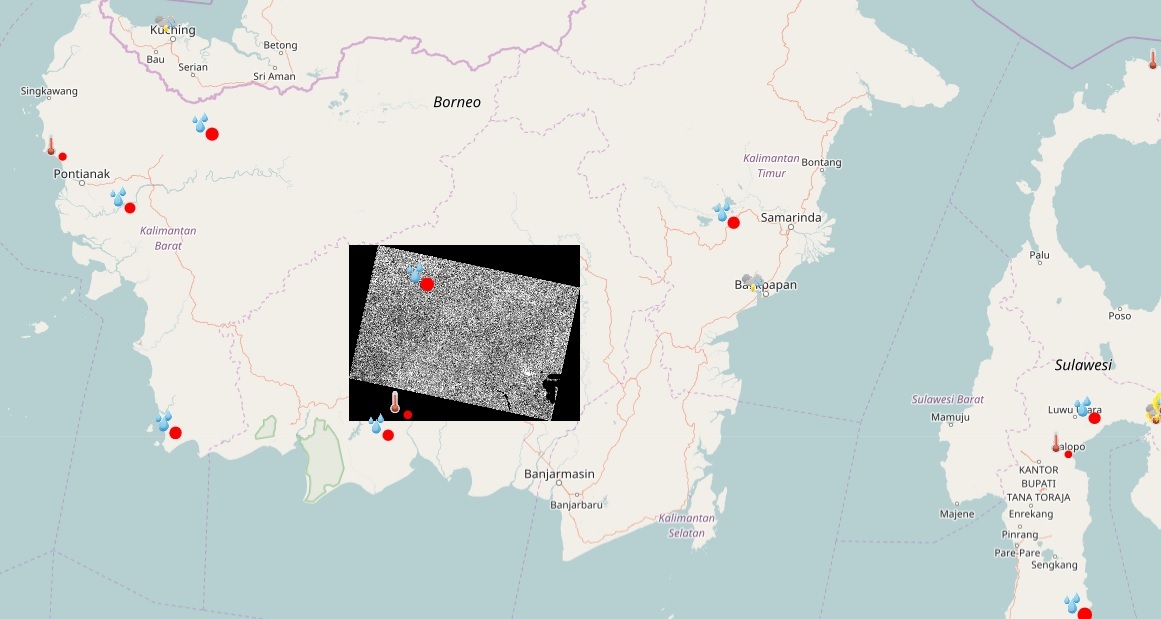
writing RGB image to ‘RBR_4_4_VH.png’…
error: failed to write image: FileStore IOException encountered in file creation test: Access is denied
I don’t understand why ‘Acces is denied’
I can run gdal_translate, and it works
but I don’t wanna use gdal_translate because I only get grey color (or I am wrong?)
I try to use gdaldem with color tables but it take an ages to convert 1 scene of S1 (multilook 3x3), while gdal_translate is only matter of second
I also try to do it in graph builder by setting the format of output in “write” module to png, but it doesn’t work either, even after converting data type to uint16.
You need to specify the full path to the target file.
In your case it is written to the same folder where gpt executable is located (<install_dir>/bin). There you don’t have write access.
Use the -o option for specifying where you would like to write the data to. Or step into this directory and invoke pconvert from there.
In the graph I’m not sure how it works. Maybe you need to specify as format PNG. Uppercase.
Maybe you should think about updating to the latest version. Were already at version 5.0.
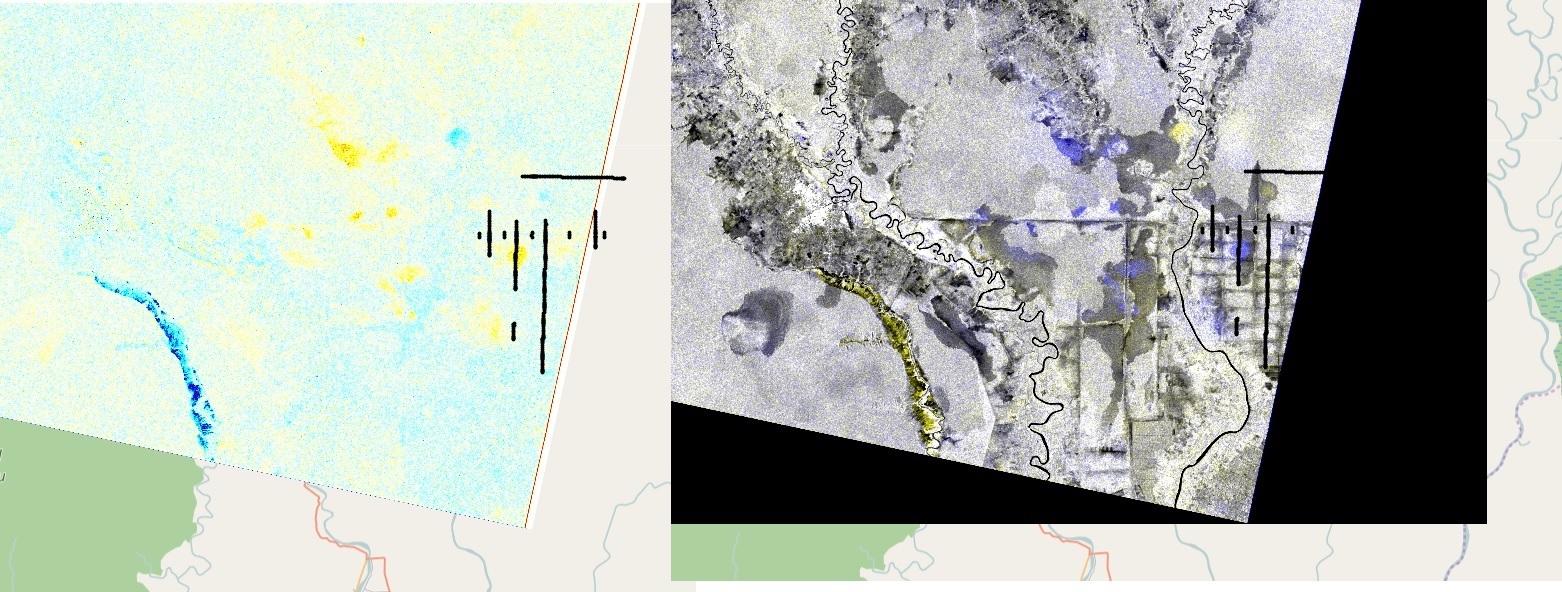
I wanted to use single band of multi temporal analysis (db ration between ‘after’ and ‘before’), but it looks like that RGB (R:after, G:after, B:before) visualize the ‘temporal changes’ better. or probably my color palette for single band is not that good. I wonder if the command can optimize the color palete to get better contrast. I assume the command does it for RGB, that’s why the results is better.
anyway, no worries if the integration with graph is not priority. As long as it can be executed trough terminal, that’s already awesome. I am now able to process the GRD S1 from calibration until conversion to png, and then pass it to server for webGIS using automatic batch script (combination with python). It save a lot of time and energy than using GUI.
Maybe the black area you see is not marked as no-data in your input data.
You can try to create a RGB profile and use it for conversion.
Then you can use in the expression for the channel something like.
Band_1 == 0 ? Float.NaN : Band_1
This will check if the band has the value 0 and replace it by NaN. I assume here that 0 is the value of the black area.
You can try it in the SNAP GUI and store the profile. Afterwards you can use it with pconvert.