Phase to Displacement Units?

We cannot tell you which point is suitable als a reference, this is based on field experience and knowledge on the local conditions.
Again, look at the coherence, as I suggested above. The reference area should be a point with high coherence.

2 Likes

Hi @ABraun , I would like to ask. According to @zealandia_sarah’s post above, the settlements spread around the volcano (at the center of image). We assumed the settlements have high coherence. If the reference took place at the south-west (which vertical displacement is lower than the volcano’s), the volcano would be an uplift area, and if the reference took place at the north-east (the higher value), it would be vice versa. Which one the reference point that we should choose? Thank you

to me it seems that there is a ramp in the unwrapped interferogram that doesn’t reflect the actual conditions. But you guys are the experts for this area - to me it is just colors… I don’t even have an idea about scale.
So, I would advise not to blindly trust these colours and values and think if the results are reasonable at all. I am no expert in volcanism, you will have to check if it is likely that one side of the volcano is uplifted while the other subsides. As these patterns are quite large, I rather think there is an atmospheric distortion or unwarpping error superimposing the actual changes.
Don’t just assume high coherence at cities, check it.

@zealandia_sarah Hi there, Just by looking at your displacement image results, I can tell that the unwrapping didn’t work properly probably due to low coherence. It is not normal for a result to hold very low values in one corner, and increase to a high number in an even fashion all the way to the adjacent corner. This looks like error to me. Land use linework will not help you with this. The purpose of this image is to show you how the land had changed between 2 time periods. The very first thing you want to do is check the modeled coherence of the coregistered pair of images before you run the interferogram tool. If this number is pretty far from 100% coherence, there is no point in moving forward with that pair of images. This can be a very frustrating step in interferometry, but it’s your fist sign that will direct you to move forward or not.

To find your zero, you can use google earth to find mountains or areas that haven’t changed. @ABraun is right, finding a zero area is not easy in an area with high vegetation. You need to have good understanding of your project area and understand it’s geology to find bedrock areas.

On another note, I see that you are using data from 2014 and 2015. I would be very cautious using data close to the satellite launch date of April 2014. I have found that the data is not very good until late 2015/early 2016. With any new technology, it takes time to work out the bugs and errors. Just be extra cautious. Checking coherence is a must.

1 Like

Hi Johngan,

thank you for sharing. I am currently converting my unwrapped phase to LOS displacement and also vertical displacement. To my understanding the vertical disp after conversion should be smaller than the LOS disp itself (due to the pythagoras relationship). The formula should probably look like this
vert_disp = (unwrapped phase * wavelenght*cos(rad(incidence angle)))/ (-4pi )

or I can be wrong, can you comment on this please?

1 Like

Hi,
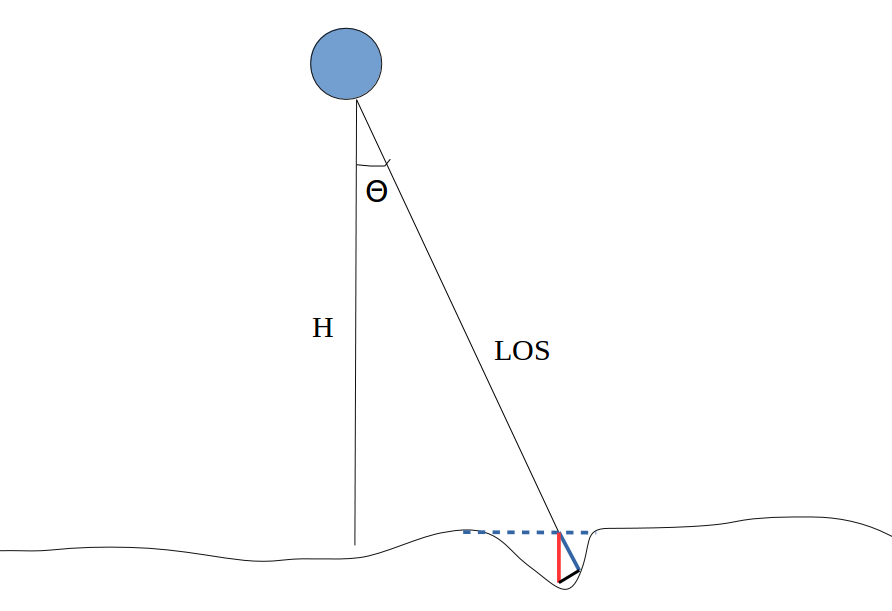
Below, i tried to sketch the relationship between LOS and vertical displacement (not the ideal diagram though). In order to find the real displacement, we need to do some geometrical calculations between the incidence angle and the direction of the ground movement. In the (beautiful :stuck_out_tongue: ) diagram below, the blue line denotes the LOS displacement and the red line the vertical displacement (this is what we are trying to find.).

using your formula vert_disp = (unwrapped phase * wavelenght*cos(rad(incidence angle)))/ (-4pi ) the results we get are much smaller compared to the following formula (unwrapped phase * wavelength) / (-4 * PI * rad(cos(incidence angle))). If the ground in your area of interest has moved vertically(we must assume that the horizontal component is zero) , then the vertical displacement values should be bigger compared to that of LOS.

You can have a look at the following website (https://vldb.gsi.go.jp/sokuchi/sar/mechanism/mechanism04-e.html) where after ALOS measurements, they found out that the amount of subsidence is 1.3 times the amount of deformation in LOS direction.

In order to validate this equation, the only way is to have precise GPS measurements over your area of interest and compare the GPS results with your vertical displacement map. As long as scientists use the following equation (unwrapped phase * wavelength) / (-4 * PI * rad(cos(incidence angle))), then that means that the equation was validated and produces the expected results.

6 Likes

@johngan,

Thanks for your post it was a great help. However, in reviewing the process in preparation for new images I noticed the formula you used (and I used successfully as well) is slightly different than the one often quoted in these forums in various threads.
Instead of: (unw_phase * wavelength) / (-4 * PI * cos(rad(incident_angle)))
Others have stated it is (unw_phase * wavelength) / (-4 * PI * rad(cos(incident_angle)))

These of course give different results that are differently signed.
(The second version, at least in my AOI, gives wildly unrealistic movement results and in the opposite direction of ground referenced data.)

Any insight you, @ABraun or others might have in this would be helpful.

Thank you,
Todd

It depends on whether cos() ingests and outputs degrees or radians. The units need to be in radians when you multiply with 4*PI.

1 Like

Makes sense of course. Thanks @mengdahl

It seems then, and I guess it would be good to find clarification on this, that SNAP’s band math cos() expects radians as input. (Much like excel). This would suggest the rad(cos version referenced on these forums was being used outside of SNAP’s band maths expression editor.

1 Like

There are two problems that confuse me.

Some literatures add negative signs to the deformation displacement formula, but some do not add negative signs. What’s the difference?
image
Another question: when the image value is positive, does it mean that the deformation direction is far from the satellite or close to the satellite?

1 Like

this always depends on which of the images was selected as the master. If the earlier date is selected as the master, negative values indicate movement away from the sensor.

1 Like

Will the calculation formula be different?

I used the “Phase to displacement” operator most of the time so I can’t really say.

Can you please name the literature sources which use the formula with and without leading negative sign?

The formula (2) in the following two literatures is not added with a minus sign


and do you also have an example of a study with the negative sign?

There is a minus sign in the formula of page 27 (3.9) in the following linked book.

I had a look into Hanssen (2001) which was referenced for this forumla and there is no negative sign for the calculation of displacement

\Delta R

is never starting with a sign, however, some of the other variables contributing to it.

1 Like

I am investigation a land subsidence. After unwrapping, i use phase to displacement of snap to obtain the displacement in the LOS direction. Then I applied terrain correction. In order to get more accurate results, I create a stack of DInSAR corrected product (DInSAR_ML_Flt_TC) and the displacement corrected product (DInSAR_ML_Flt_TC_disp). The minimum and maximum are respectively -0.031 m and 0.028 m. I export the color palette. From the stack product, I create a displacement_mask using band math to remove the area of low coherence. On the displacement_mask the min and max has changed and become -0.01 and 0.009 without indication of the unit.
Why the values of min and max has changed?
What is the unit of the displacement_mask?
in case the unit of the displacement_mask is in meter also. which values of min max shall I consider to be more accurate?

2 Likes

As you see in the maps, the mask removes pixels with low coherence where the phase quality is bad. This leads to a removal of outliers from your data and the value range decreases.

More important than minimum and maximum is if the fringe patterns in the interferogram make sense to your and if the are free of noise and atmospheric patterns.
Bad interferograms lead to bad results, so this should be checked initially.

1 Like

thank you for your reply. I herewith attach the interferogram result. Honestly i am not sure if it make sense or not but according to my understanding, you can notice that we have higher coherence in the right side of the coherence file corresponding to the fringe in the right side of the phase image. the fringe space are large mean that there is small deformation. therefore on the left side of the the phase image, there is noise since the coherence corresponding to this are is low.
what do you think about my fringe. does it make sense?
image