Hello, I’m building a map of the shifts to this area. Why does water stay on the latest model? After all, the model should be built only where the land.
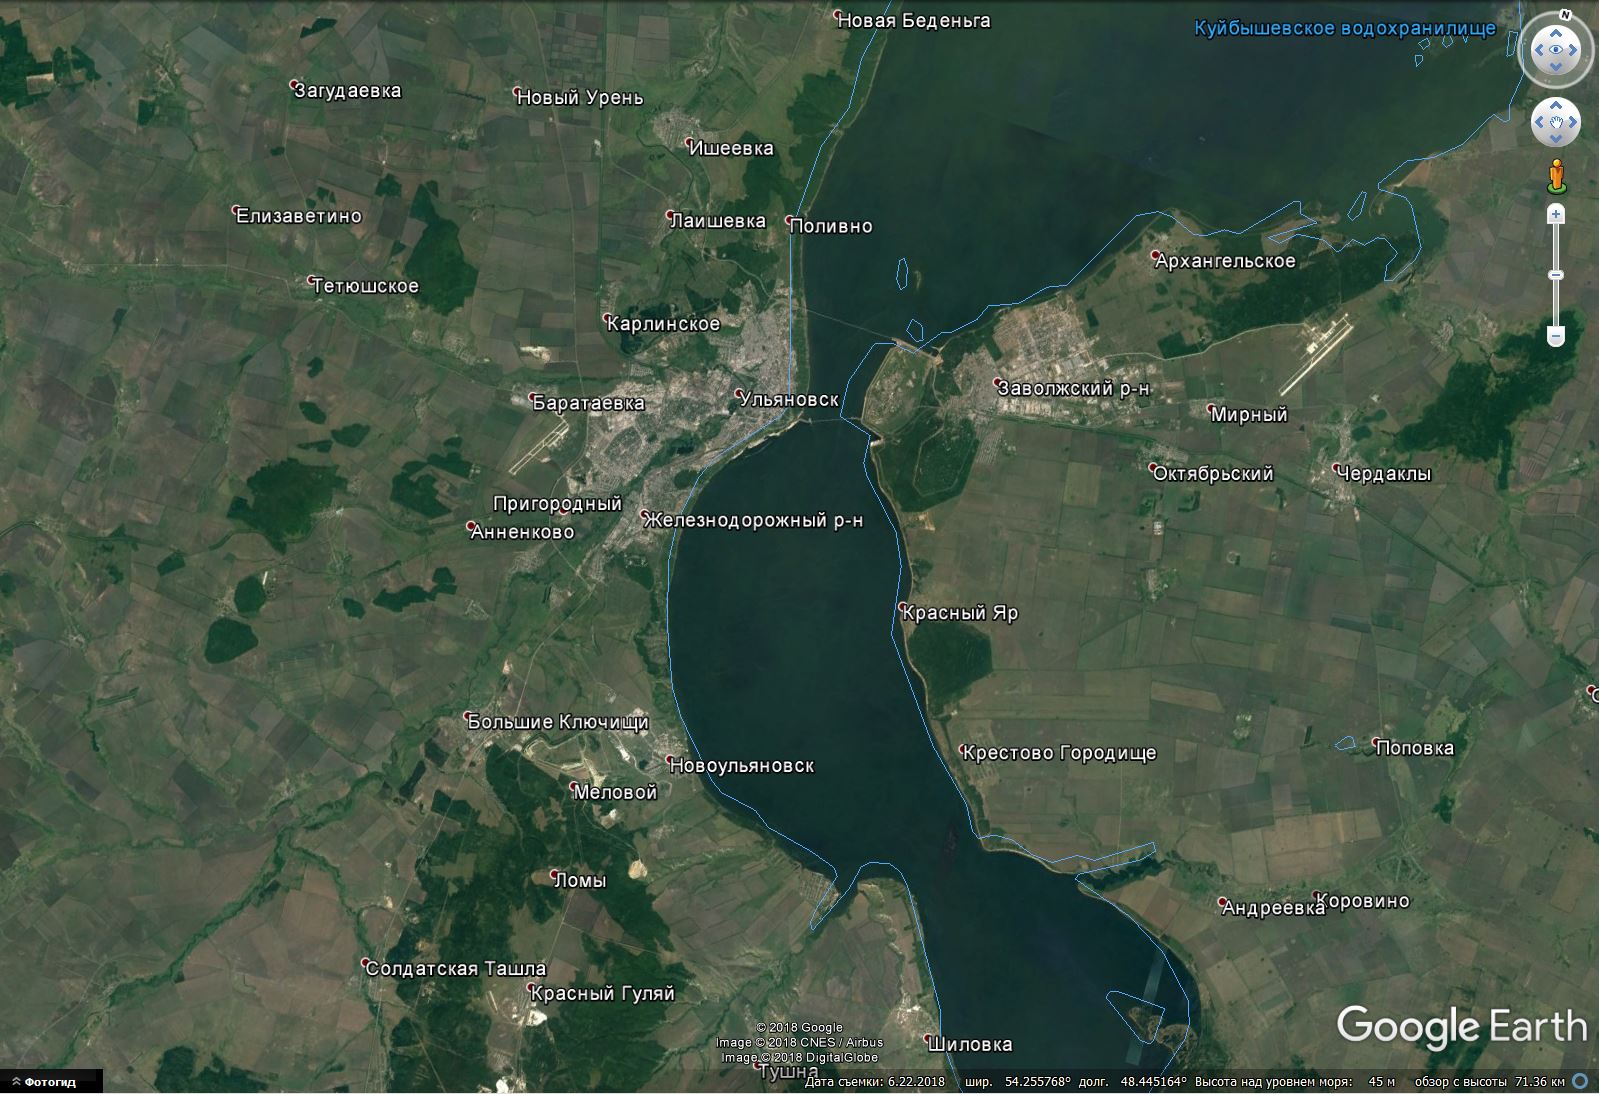
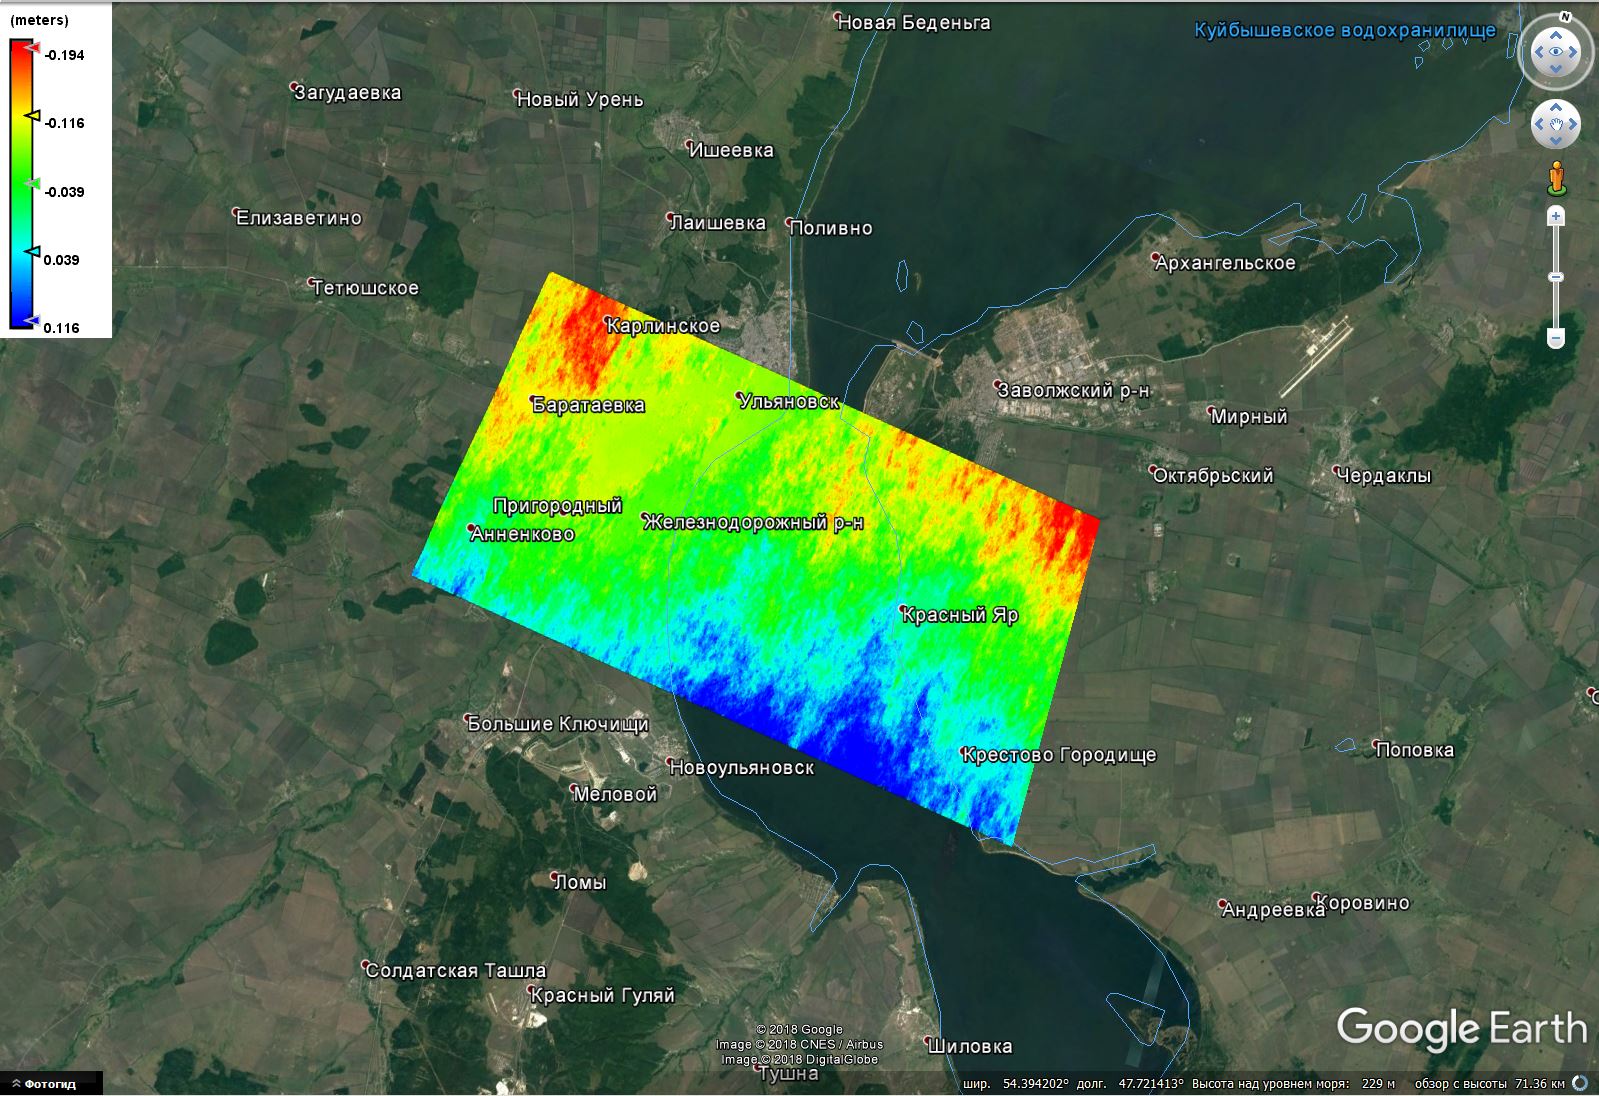
phase information is nearly wothless without coherence. You will find low coherence over the water area, which you can then mask out with the valid-pixel-expression in the band properties.
But it looks like there is a ramp in your image superimposing the trends observable with InSAR.
What are your temporal and perpendicular baselines?
You can try
- increase the number of gcps for the coregistration process
- use a higher interpolation factor for the orbit files
- another image pair with a more suitable baseline.
Baselines = 4.23 m
B perp = 324 days
4.23 m is probably too small to detect topographic variations. I would suggest searching an image pair with larger baselines, maybe around 100m.
You can use the ASF baseline plot tool: http://baseline.asf.alaska.edu/
Is it better to build a displacement map than the lower the value of the baseline?
You’re right, sorry. For differential InSAR, short baselines are more suitable. But there are also limitations.
Please have a look at these ESA notes on the selection of suitable images and potential error sources. http://www.esa.int/esapub/tm/tm19/TM-19_ptB.pdf
These are the criteria for building a DEM, and I need a displacement map. Am I wrong?
The facts in chapter 1.3 are still correct and applicable to DInSAR as well. For example that interferograms from baselines < 30 m are easy to unwrap but very sensitive to phase noise and atmosphere.
These might also be helpful:
Then the ideal baseline value for constructing a displacement map from 30 to 150 m? Or from 150 to 300 m?