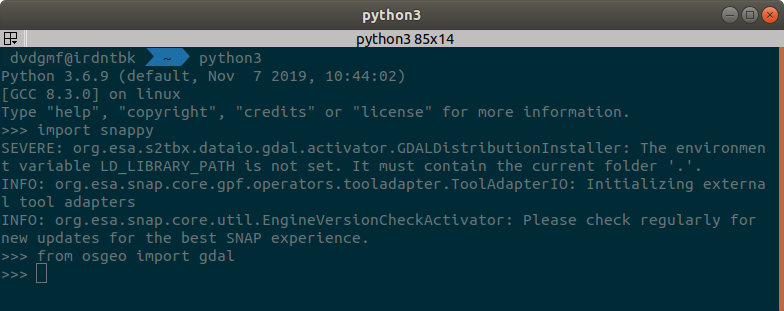
This is my python3 code so far, but it is not very efficient because it loads up in memory all the NetCDF data from all the S3 bands of a given image:
bands_dictionary is a list of numpy N-D-Arrays containing the NetCDF data for ALL the bands
lon and lat are the longitude and latitude dimensions inside de file geo_coordinates.nc
target_lon and target_lat are the point of interest to be extracted like: -60.014493, -3.158980
def get_point_data_in_bands(self, bands_dictionary, lon=None, lat=None, target_lon=None, target_lat=None):

    lat = lat[:, :, np.newaxis]
    lon = lon[:, :, np.newaxis]
    grid = np.concatenate([lat, lon], axis=2)
    vector = np.array([target_lat, target_lon]).reshape(1, 1, -1)
    subtraction = vector - grid
    dist = np.linalg.norm(subtraction, axis=2)
    result = np.where(dist == dist.min())
    target_x_y = result[0][0], result[1][0]

    rad_in_bands = []
    for b in bands_dictionary:
        rad = bands_dictionary[b][target_x_y]
        rad_in_bands.append(rad)

    return target_x_y, rad_in_bands
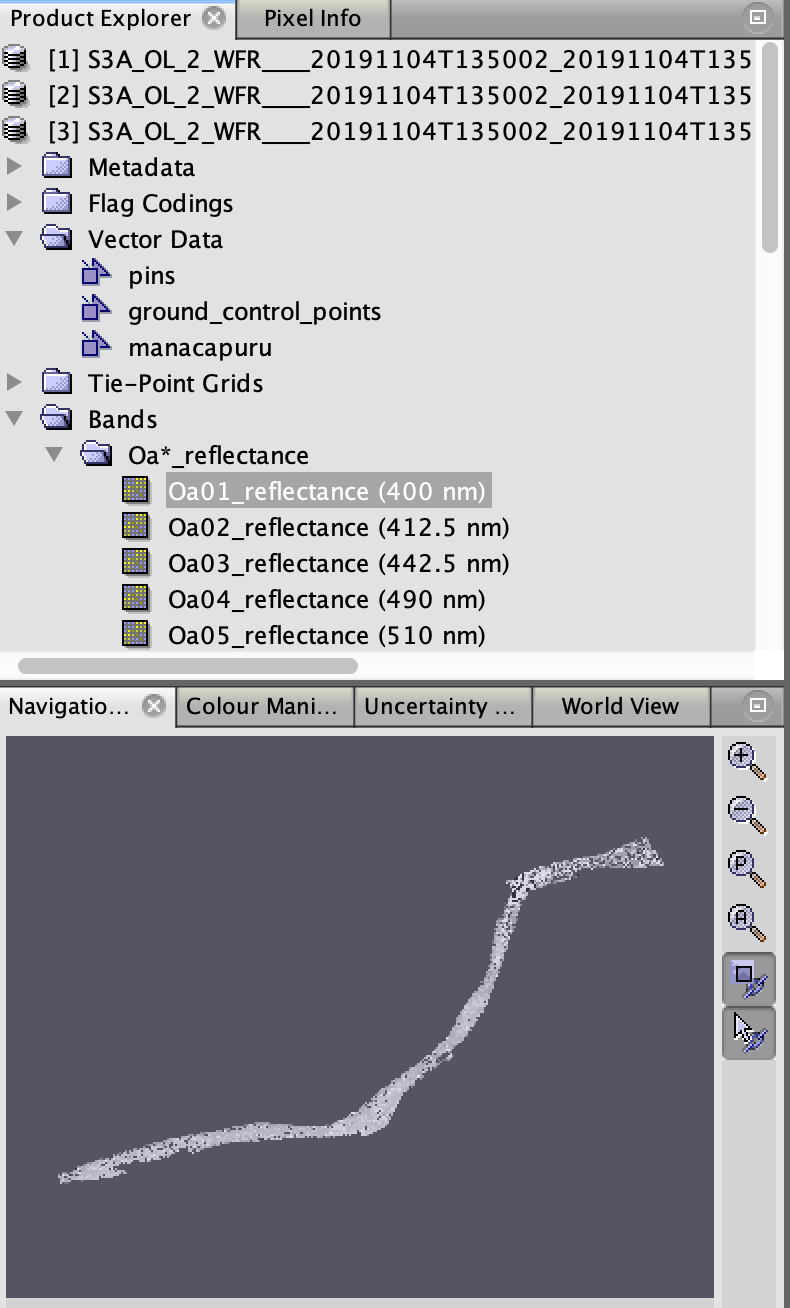
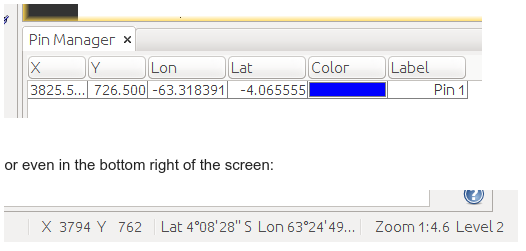
The output target_x_y is just in case I want to re-use it later, and represents a tuple containing the absolute X,Y position ex: (3825, 726) in the image matrix (like SNAP in the Pin Manager tool):
And rad_in_bands is what I actually want, a list with the radiance of the pixel in each band e.g.:
[-0.01853694,
-0.013849303,
0.004828036,
0.029529706,
0.043244734,
0.083712265,
0.11280863,
0.12397839,
0.12610249,
0.12782373,
0.11899777,
0.070143744,
0.07380597,
0.04839015,
0.042658776,
0.02198553]
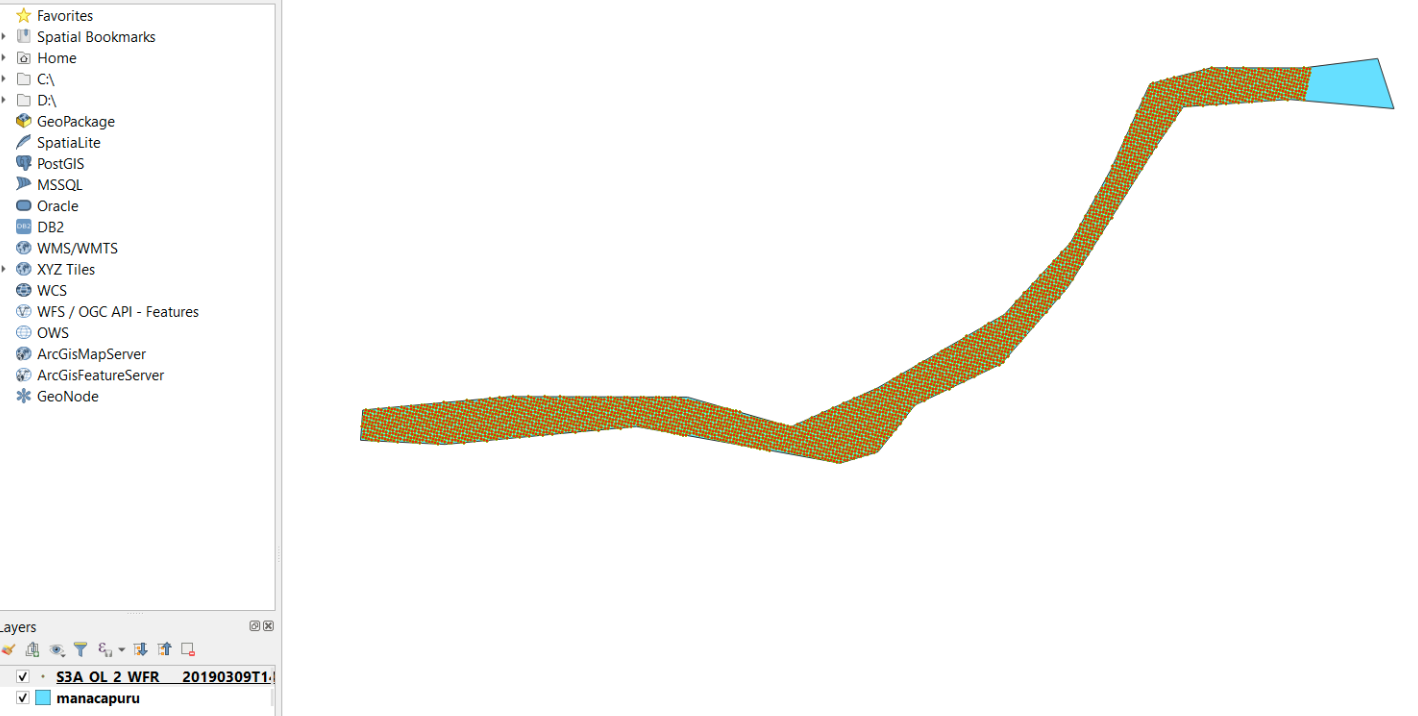
I feel like I just did way too much code gymnastics to do something that probably has a better way of doing. And before I started writing more spaghetti code to do the same above for all the pixels inside a given ESRI shapefile:
I thought it would be smarter to ask you @marpet how to do it the correct way