Hello Everyone,
I’m a beginner in spatial analysis. I’m trying to process Sentinel-1 SAR polarimetric parameters.
I’m interested with the time series analysis, I have generated the Entropy , Alpha and Anisotropy of 10 images and I want to make plots showing their variation with time. Can you please guide me about how I can generate graphs like this one
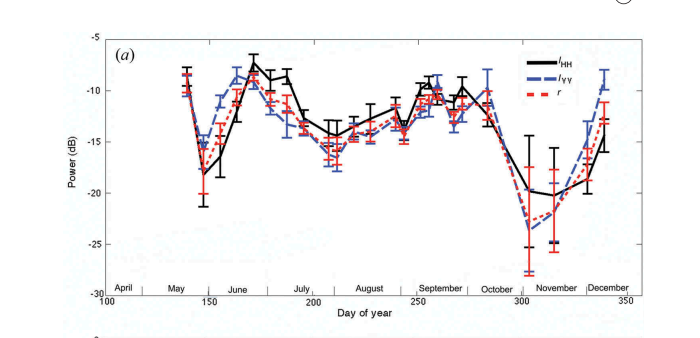
It shows the variation of HH and VV backscattering intensity, and the correlation ratio with time.
Best regards.