First my apologize if it is not the proper place to ask this question, please let me kown if it is the case.
I am using s2 L2A images provided by the copernicus sci-hub to monitor difference between dry vegetation over some areas and bare soil, and I have a question related to the results I get and if I should apply extra calibration correction from maybe shadowing effets or other effects I may not have condisered in the preprocessing steps.
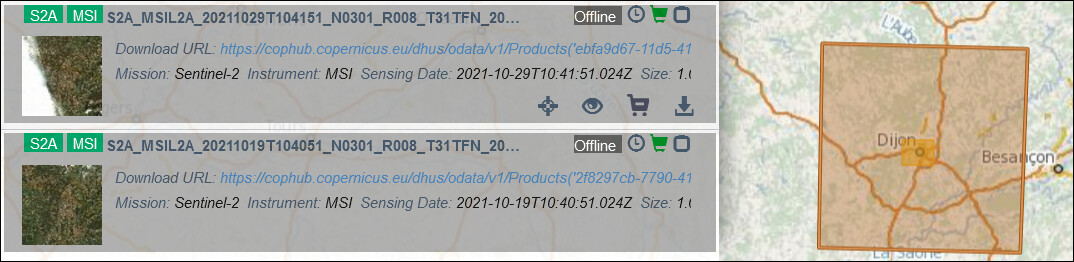
So far, I am using out of the box data from tiels provided by copernicus, with a cloud filter that ensure my data are not considered as clouds.
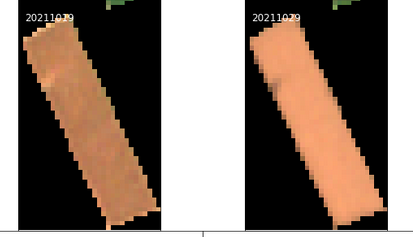
At two different dates, I get the following image
From field data, I know that the dry vegetation present on the 2021 Oct. 19th has been removed before the 2021 Oct. 29th.
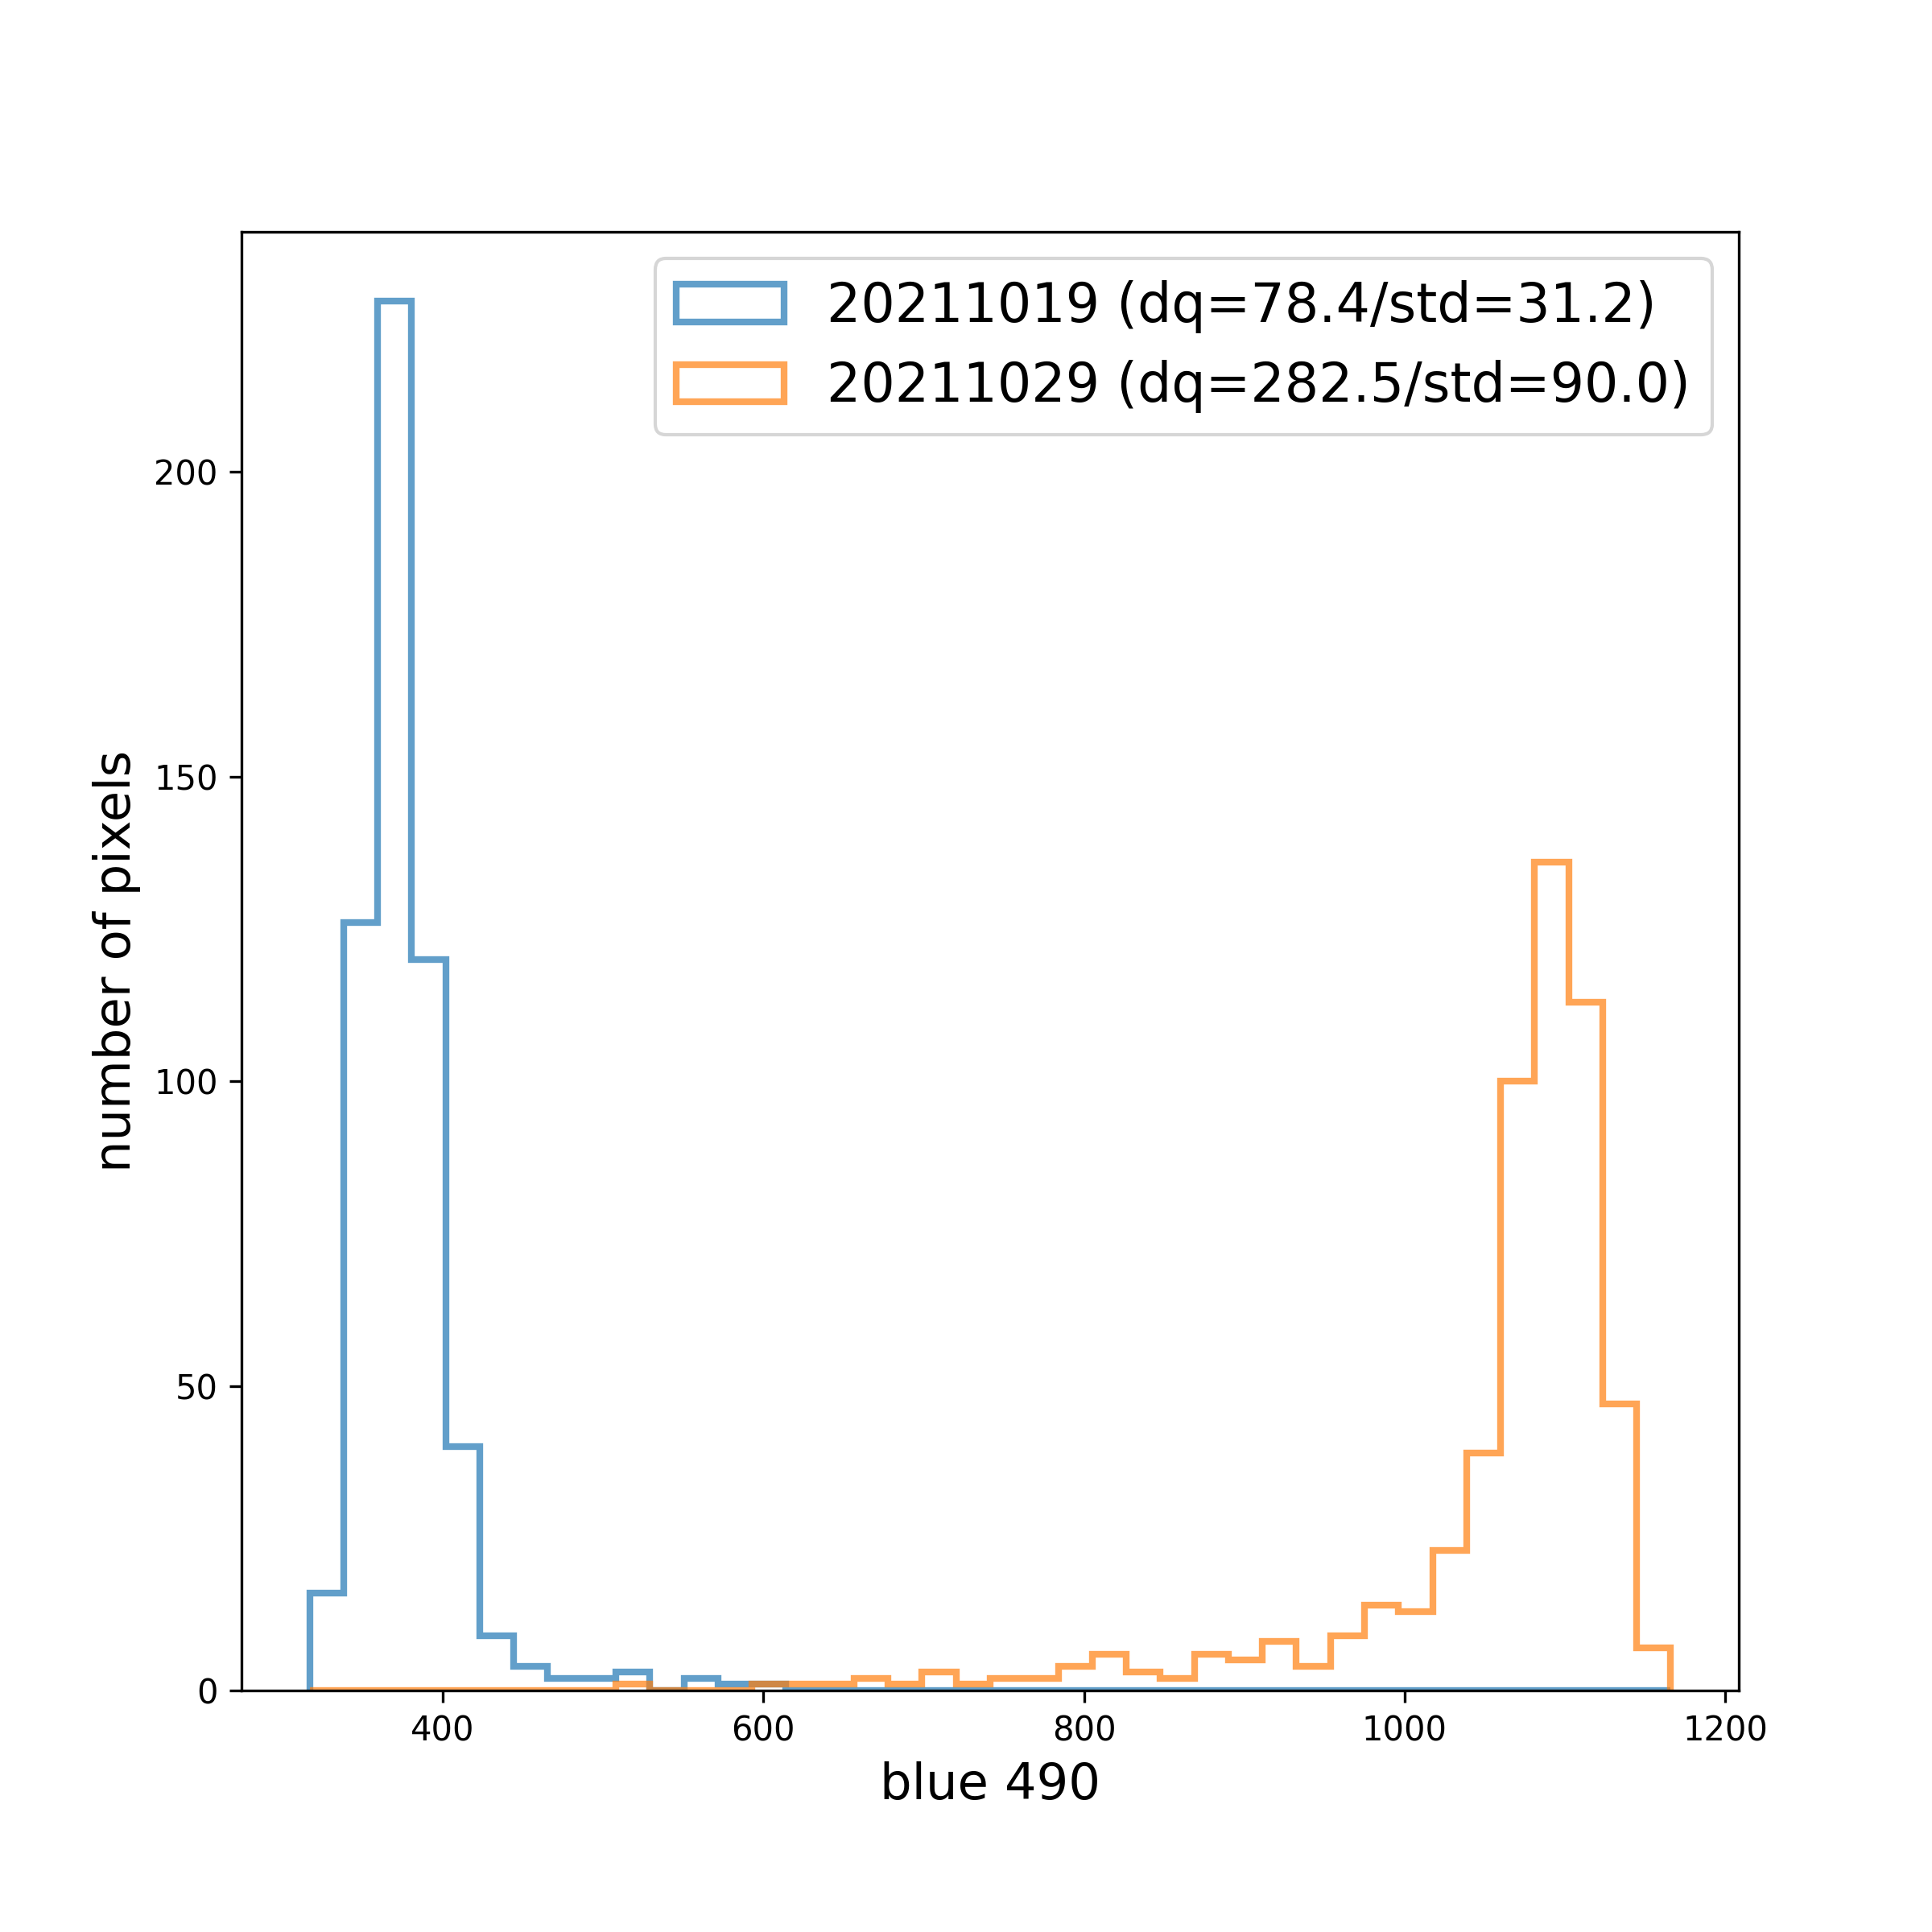
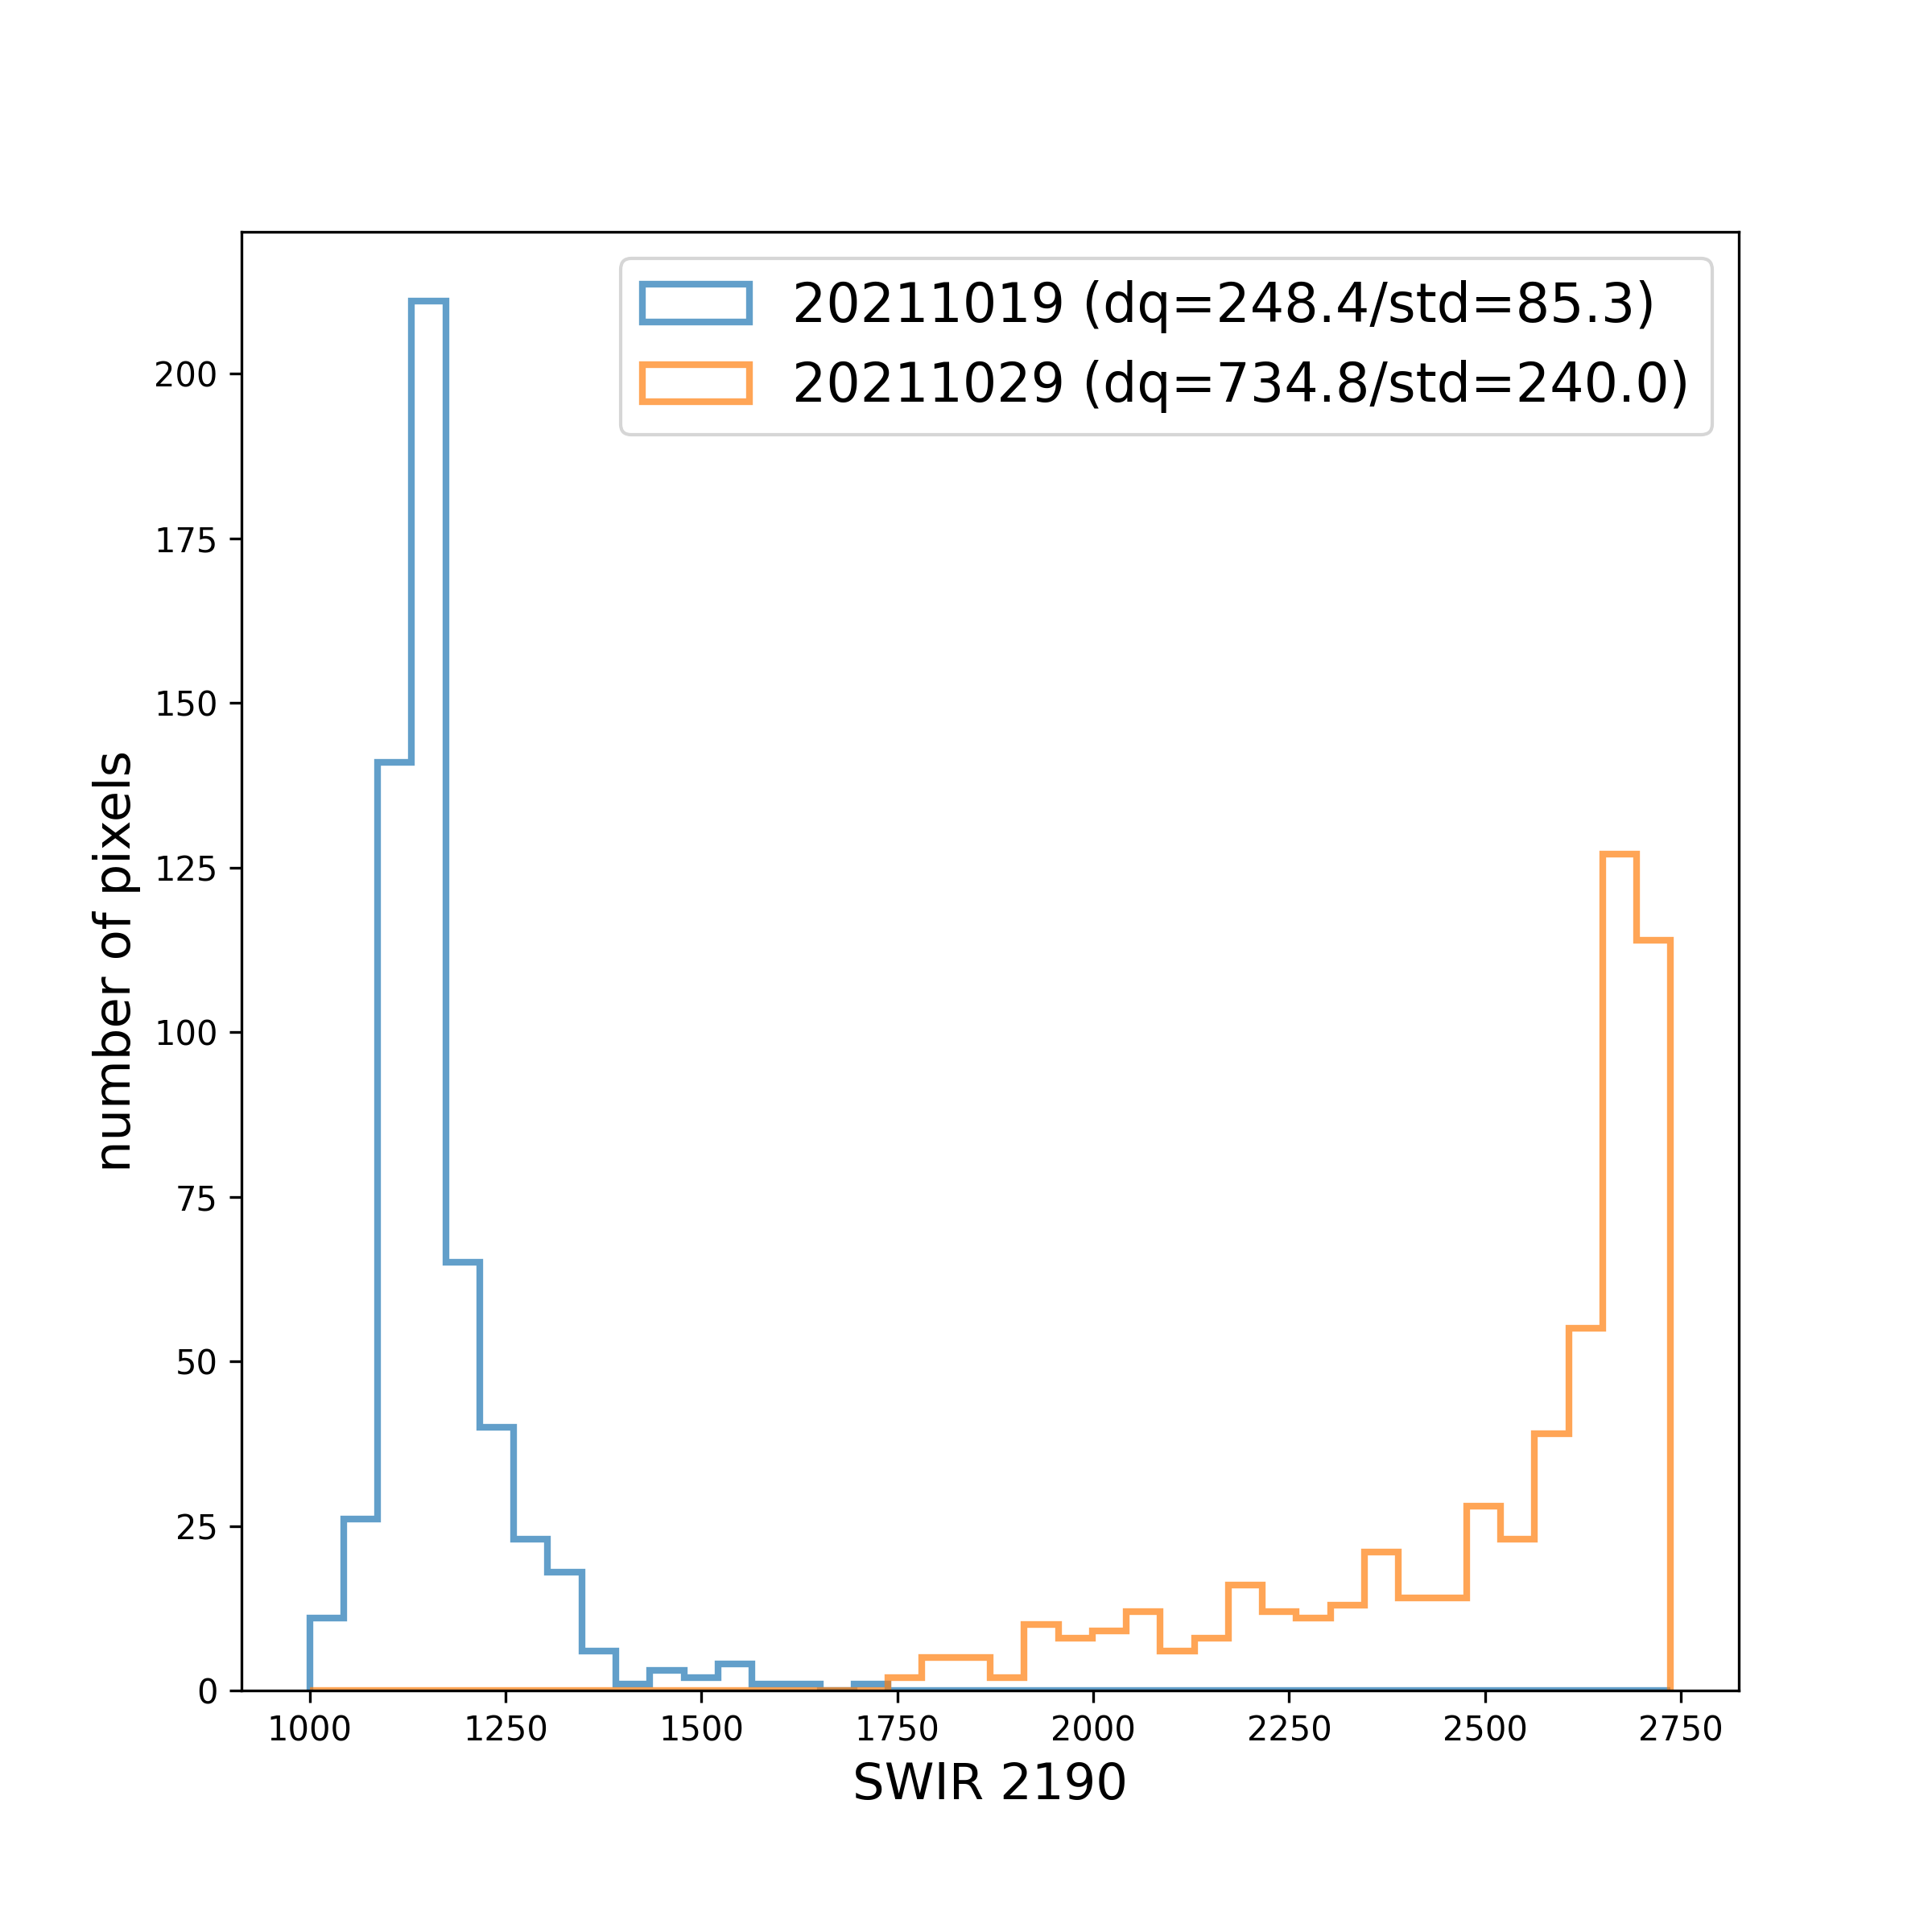
Looking at the reflectance spectra of the different sentinel 2 bands, I see the following results (for a subset of S2 bands, B2, B8, B12)
I did not really expected the overall increase of reflectance in most of the wavelengths. Therefore my question, is there some external effect that can affect the reflectance (other than the changes at ground level) ? A shadow effect on the first one that would affect most of the bands but the B12 one? Maybe a missing calibration?
If so, is there any SNAP filter or correction I can use to mitigate those effects? (I can of course work with relative reflectance over a date but I want to understand every aspect of the problem before doing so)
Thank you very much by advance for your help!
Matthieu Marionneau
P.S. : is there a publication/reference document where I can find a good summary of the different utility/use of NIR/SWIR wavelengths ?
There is also an Anomaly Report page https://s2anomalies.acri.fr/ that - along with the information in the DQRs - provides Users with information unresolved anomalies, and instrument events leading to product degradation (and in extreme cases, removal of the affected products from the Data Hubs).
I haven’t looked at the cloud Cover Statistics; the products are offline on SciHub, so I will download them and check. I note from the Browse images that there are cloud differences between the products.
One of the most difficult things to assess - I find - is the presence of thin cirrus. I wonder what sort of results you would get processing the L1C with the latest version of Sen2Cor?