Dear all,
I am doing RF classification. I have three images that I made a stack for them. I used ‘linear stretching’ in bandmath for any of those images. It means I have 6 images but I do not know why classification does not work same as three images for images by linear stretching.
I used this formula in bandmath:
(image - 976.709)/(79124.711-976.709)
Do you know why?
what is the reason for linear stretching? You can also do that automatically with the “convert datatype” module.
As I want to do classification, whole values in all images should be between 0 to 1. I have three images:
intensity (values: 976 to 79124 )
coherence (values: 0 to 0.94)
phase (values: -0.08 to 2.25)
then I used ‘linear stretching ’ formula in bandmath for making all values between 0 to 1 although I do not know why the classification does not work good and same as original images.
I used ‘convert band’ but it did not help.
The random forest classifier actually doesn’t care about different units and value ranges of input data. But if you really want to transform them, you can convert the whole product to uint8 (resulting in values between 0-255) and divide the product by 255.
What do you mean by “the classification does not work good”?
After you use “convert band” you have to save your product again.
-
The random forest classifier actually doesn’t care about different units and value ranges of input data.
What do you mean? Do you mean, we do not need to do ‘signal stretching’ for random forest? -
But if you really want to transform them, you can convert the whole product to uint8 (resulting in values between 0-255) and divide the product by 255.
How can I convert to unit 8, is there any option in bandmath for it? -
What do you mean by “the classification does not work good”?
It mixes between one class and NAN values like here:
Classification mixing problem after using PCA
I do not have this problem in original bands. This is strange. -
After you use “convert band” you have to save your product again.
I know I saved it but still does not work.
yes, I would say that. A RF works like a classification tree, it splits your input data using thresholds so it can be used to describe your target variable. It doesn’t matter if one of them is Intensity and another is coherence.
Please see here: random forest - Do I need to normalize (or scale) data for randomForest (R package)? - Stack Overflow (answer of Hong Ooi) It is discussed there that stretching is even harmful for RF applictions.
Conversion is in the Raster menu:
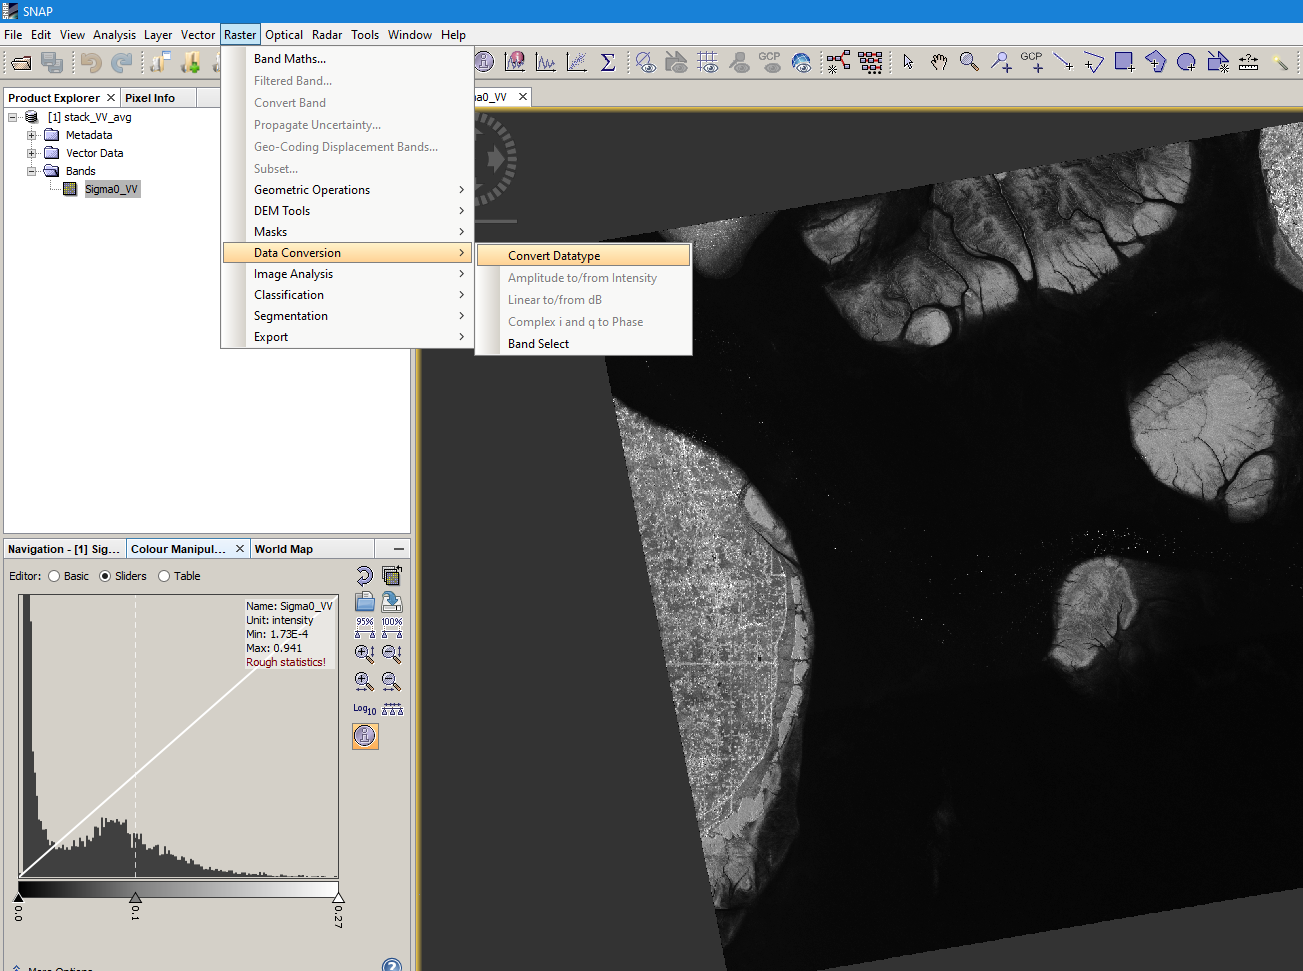
Please see the corresponding help section for the different options.
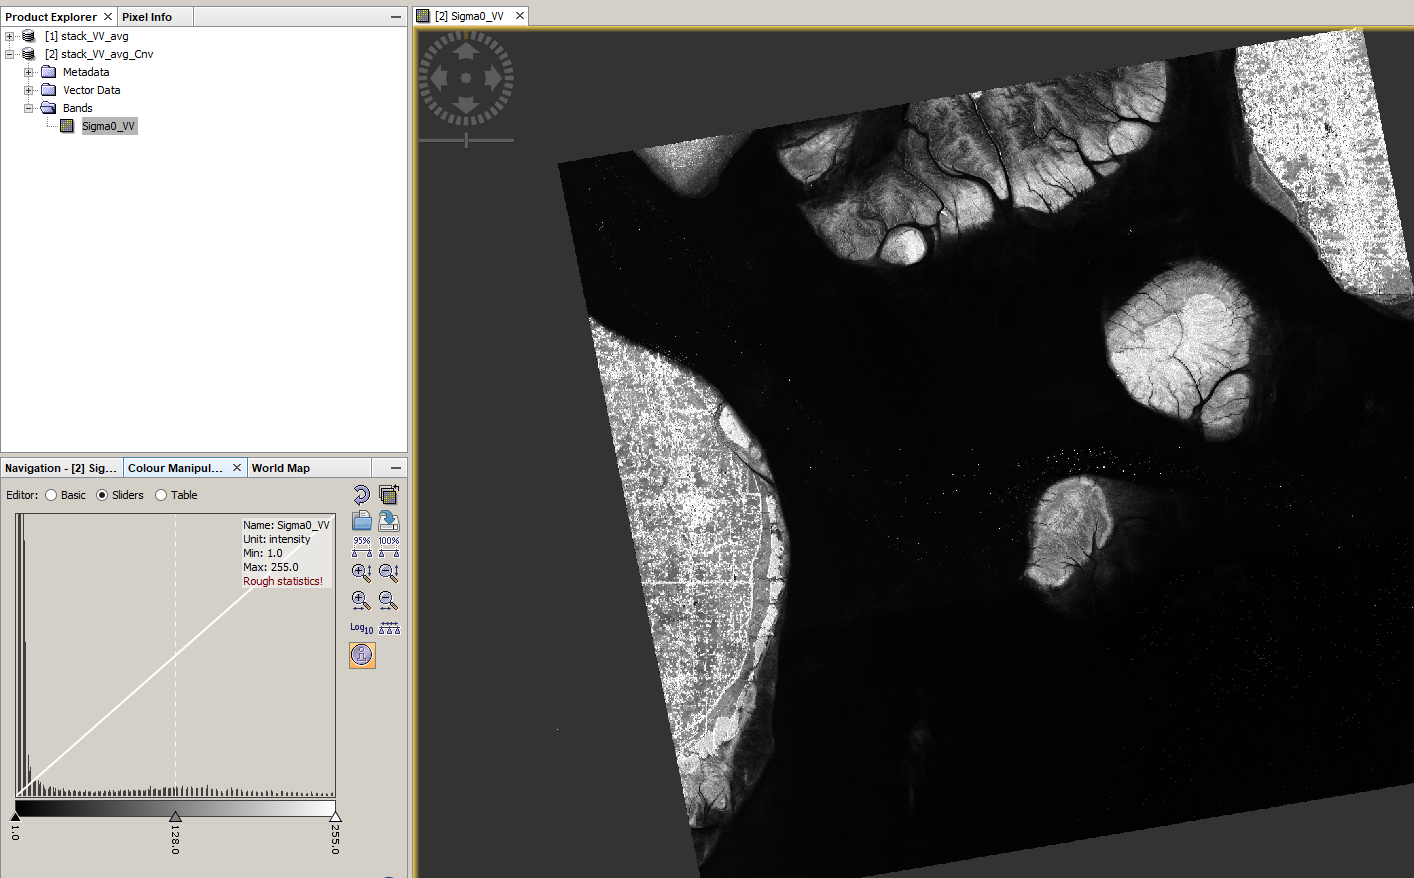
After conversion, note the new range:
If you have trouble with NaN areas you have to work with the NoData Value in the band properties. This user has had similar problems: Value error: Water boundary with the image background is gone!
OK. This is good and it means I do not have to do everything from the first. Good news @ABraun:slight_smile:
I am doing classification with RF and KNN at SNAP. I did step by step like in SNAP forum but then he told me first of all, I should do ‘signal stretching’ and then do classification in SNAP.
How about KNN in SNAP?
Nearest Neighbor does need equal distributed values. It is based on proximity in a feature space. If one variable is of extreme dimensions [0-1000] and the others are of smaller range [0-1] you won’t get clusters as described here:
Source: Mathworks
Try to understand how the classifiers work if you want to retrieve reliable results.
Three images (intensity, coherence, and phase) has the same dimension (for example 1800*1500) by using stack option in SNAP but value ranges are different (As I explained above). I think you mean values, not the dimension. Am I right?
yes, i mean the dimensions / ranges / units of the values.
1 Like
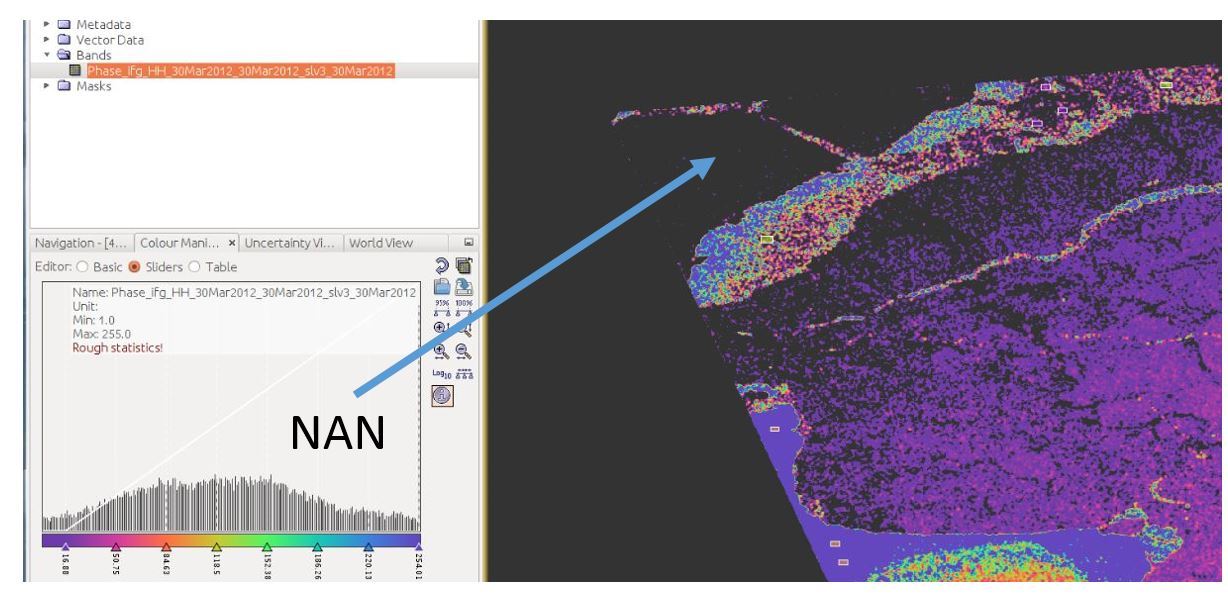
Sorry for asking so many questions. I used ‘convert band’ but I do not know why SNAP converts my data to NaN in some areas?
Before converting:
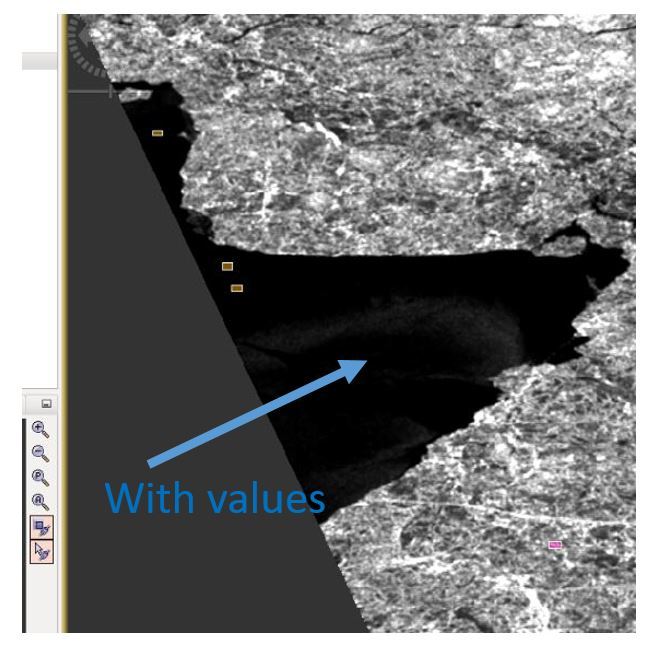
After converting:
disable the NoData value in the band properties. It is most likely zero.
Summary
This text will be hidden
Yes. It works. I converted whole bands to unit8 (raster----convert datatype). All images values are between 0 to 255 now. This can be a signal stratching between 0 to 255.
intensity : 0 to 255
coherence: 0 to 255
phase: 0 to 255
I applied RF classification and it works well but when I divided intensity result (I mean after converting in unit8) by 255 (as you told me) and applied RF classification, again it gave me faults classification result.
I do not know why classification result changes after using bandmath?
to cite Jeffrey Evans at stackoverflow:
Not only is scaling not necessary, it can smooth out the nonlinear nature of the model. If you have complex nonlinear relationships in p-dimensional space and you have transformed your data, when you back-transform y these nonlinearities are not reflected in the estimate
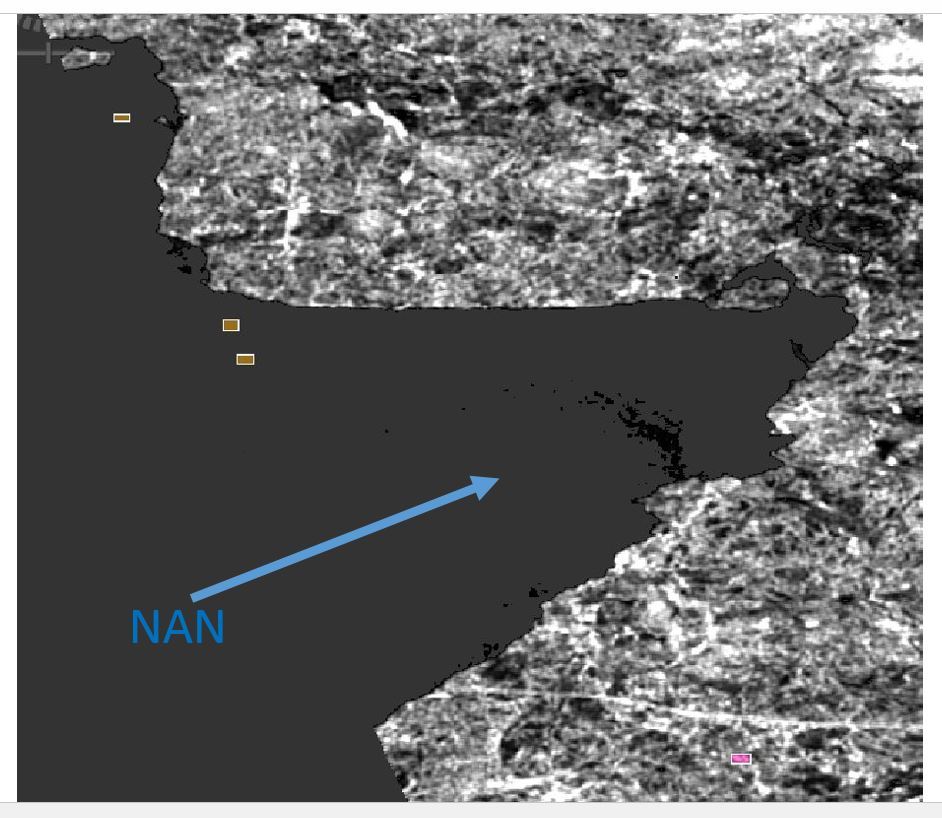
OK. As I told you, I converted whole image features (intensity, coherence and phase) to unit8. All images values are between 0 to 255 but some NAN values are in phase result (converted to unit8).
Why this one is happened?
Original phase values were between -0.08 to 2.25.
sorry, I don’t know your data. I guess they are just 0 after the conversion to int8 as one possible value between 0 and 255. Just unckeck the nodata option and they should be displayed.
I unchecked it but those data with around data in my image converted to zero and it did not help…hmmm…anyway thank you so much for the help:slight_smile:. I should try to understand what is the problem
