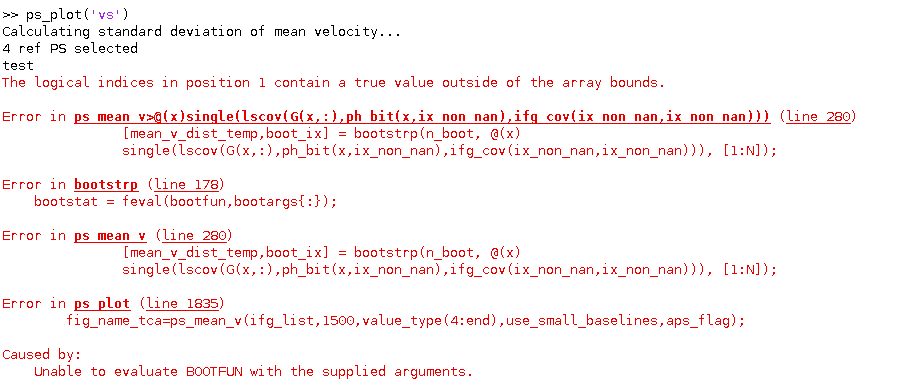
ps_plot(‘vs’)
Calculating standard deviation of mean velocity…
4 ref PS selected
test
The logical indices in position 1 contain a true value outside of the array bounds.
not yet!!
It works with one dataset and not with another, may there is some fault in data. I re processed the multiple times with StaMPS but still the same error arises. I find a lot of NaN values in the exported time series data too. These NaN values might be the problem but i dont know how to sort it out.
Dear @ABraun ,
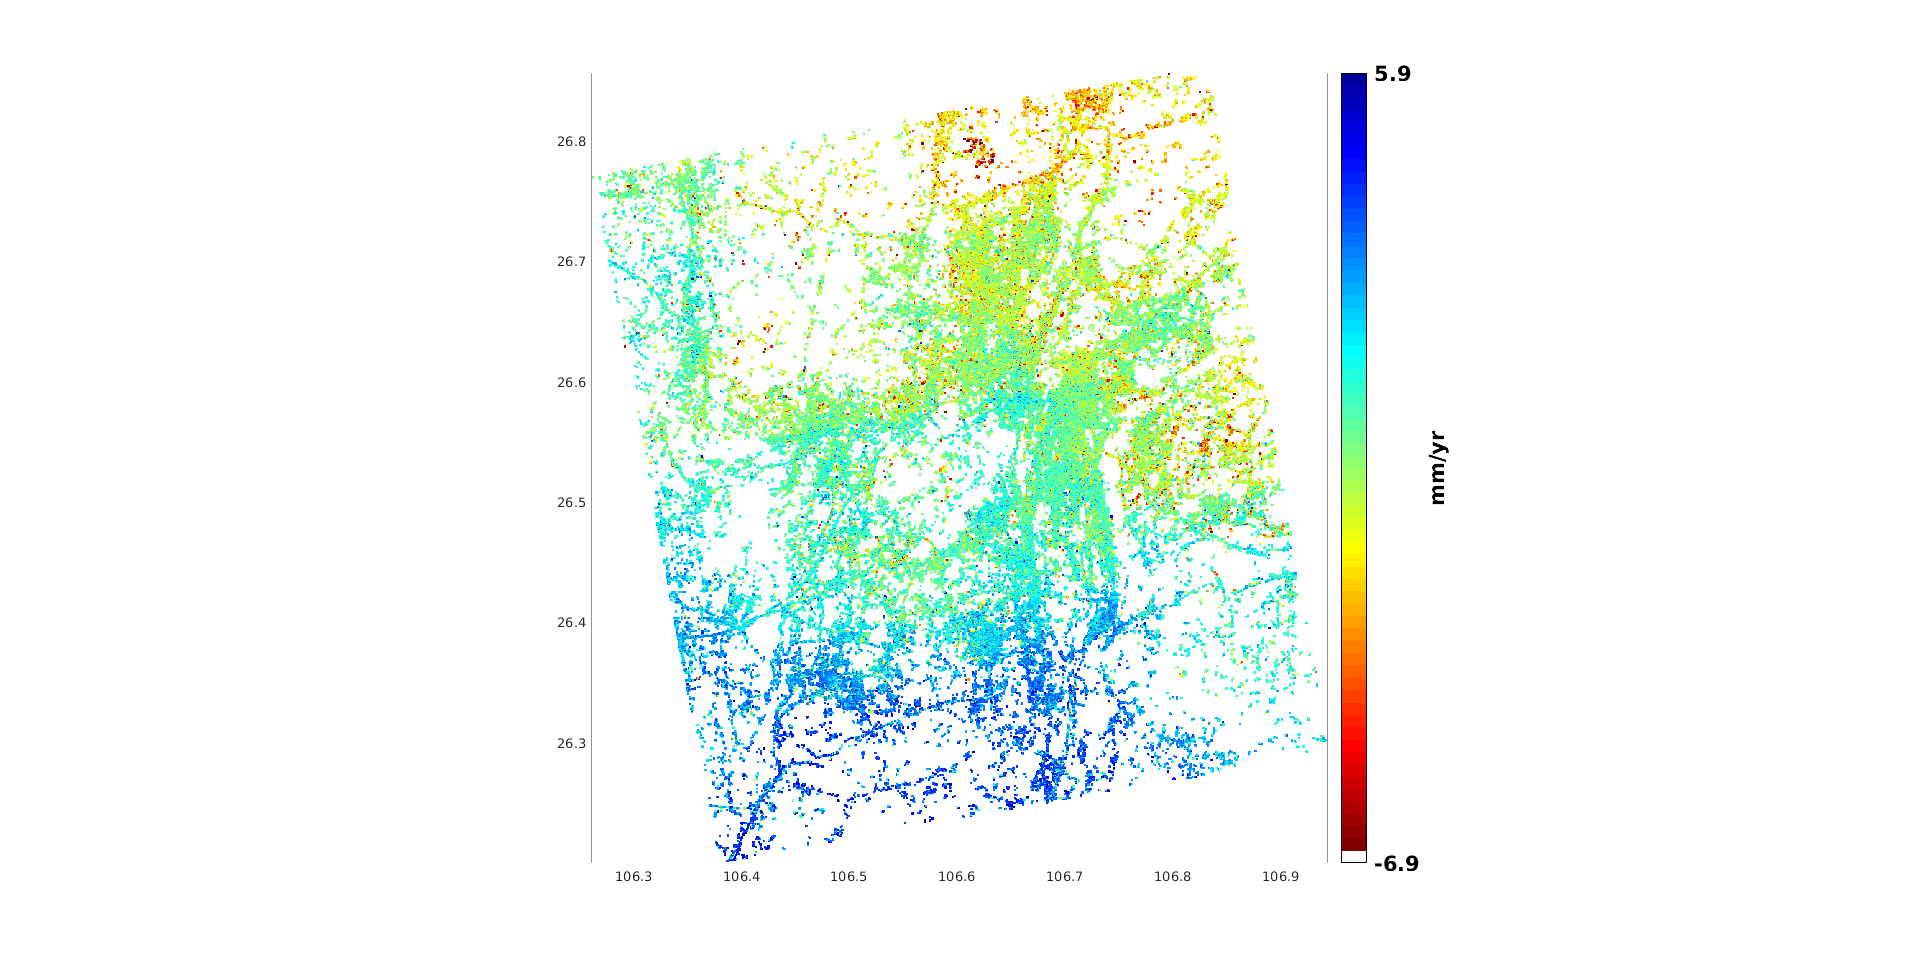
I just started using STaMPS and this is the rate graph I got with PSI after isce2 preprocessing, I am not able to explain this result( i.e. the settling point is scattered). PSI result figure v v-dao vs-dao…
Is this normal?
When I processed with SBAS (multilook20X5) there were not so many discrete settling points.
Help me
Thanks in advance
The result looks okay at first sight, but of course you have to know the area to determine if these are feasible.
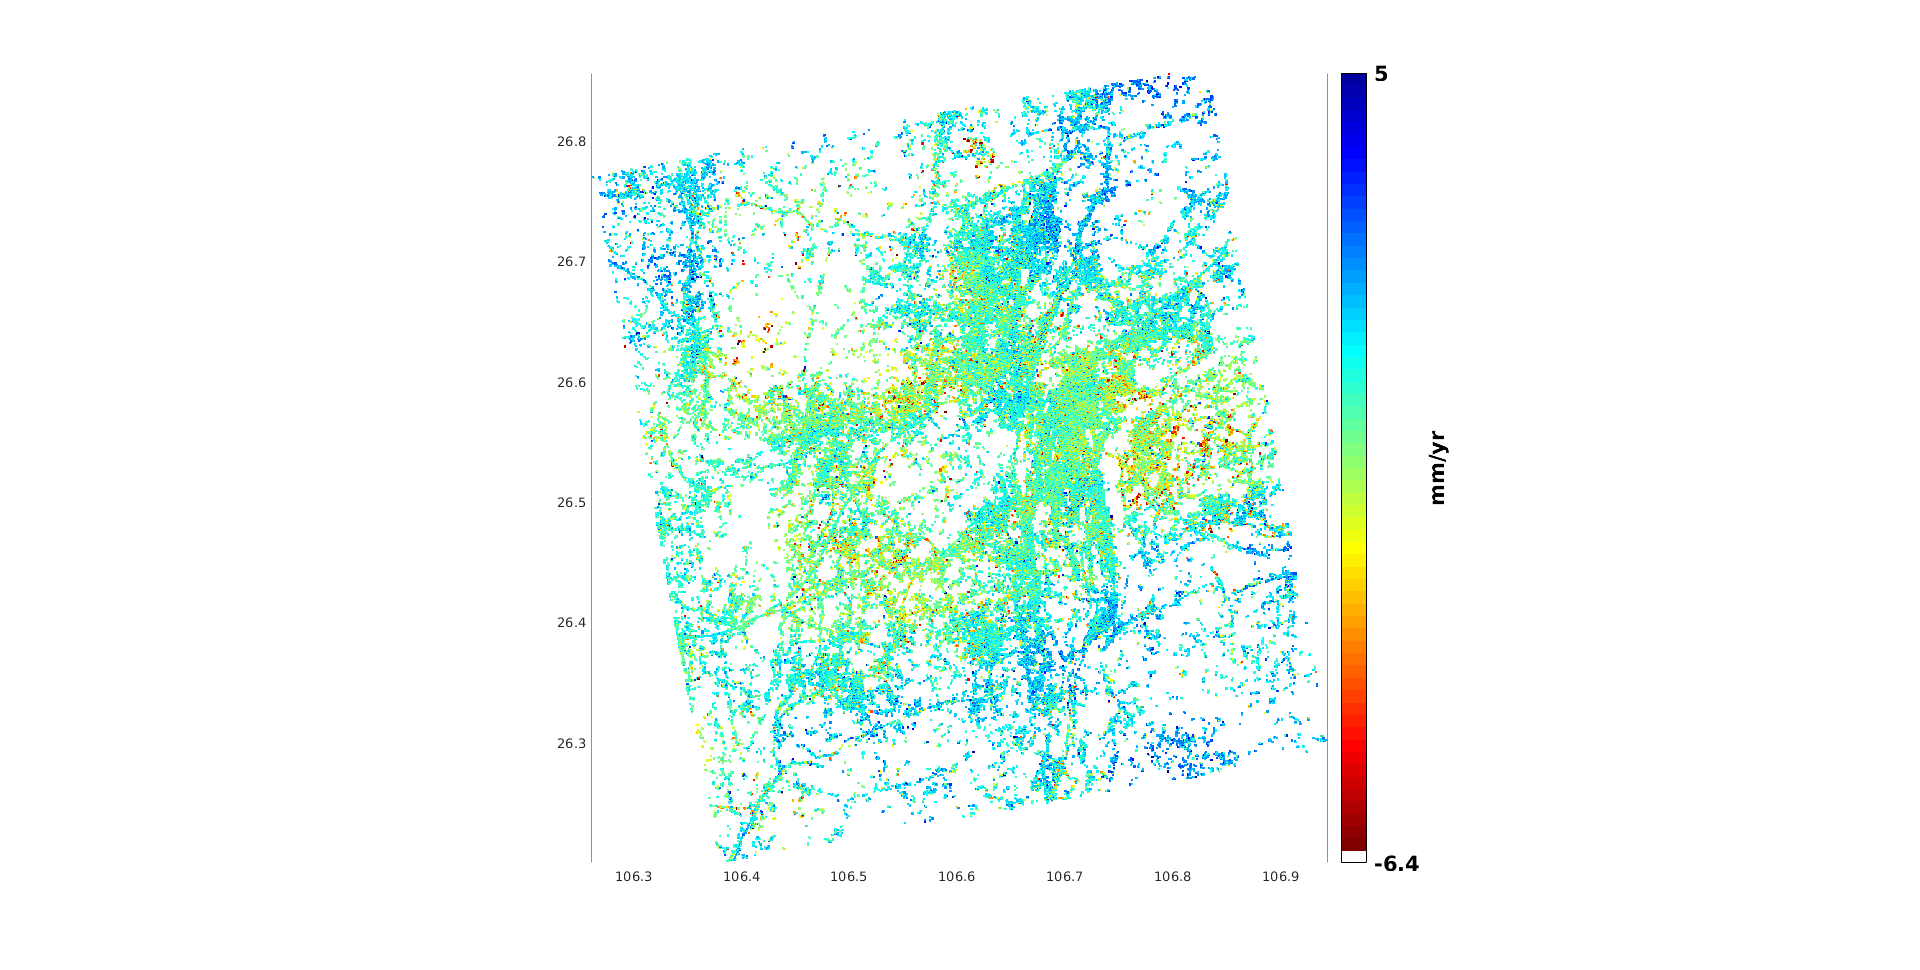
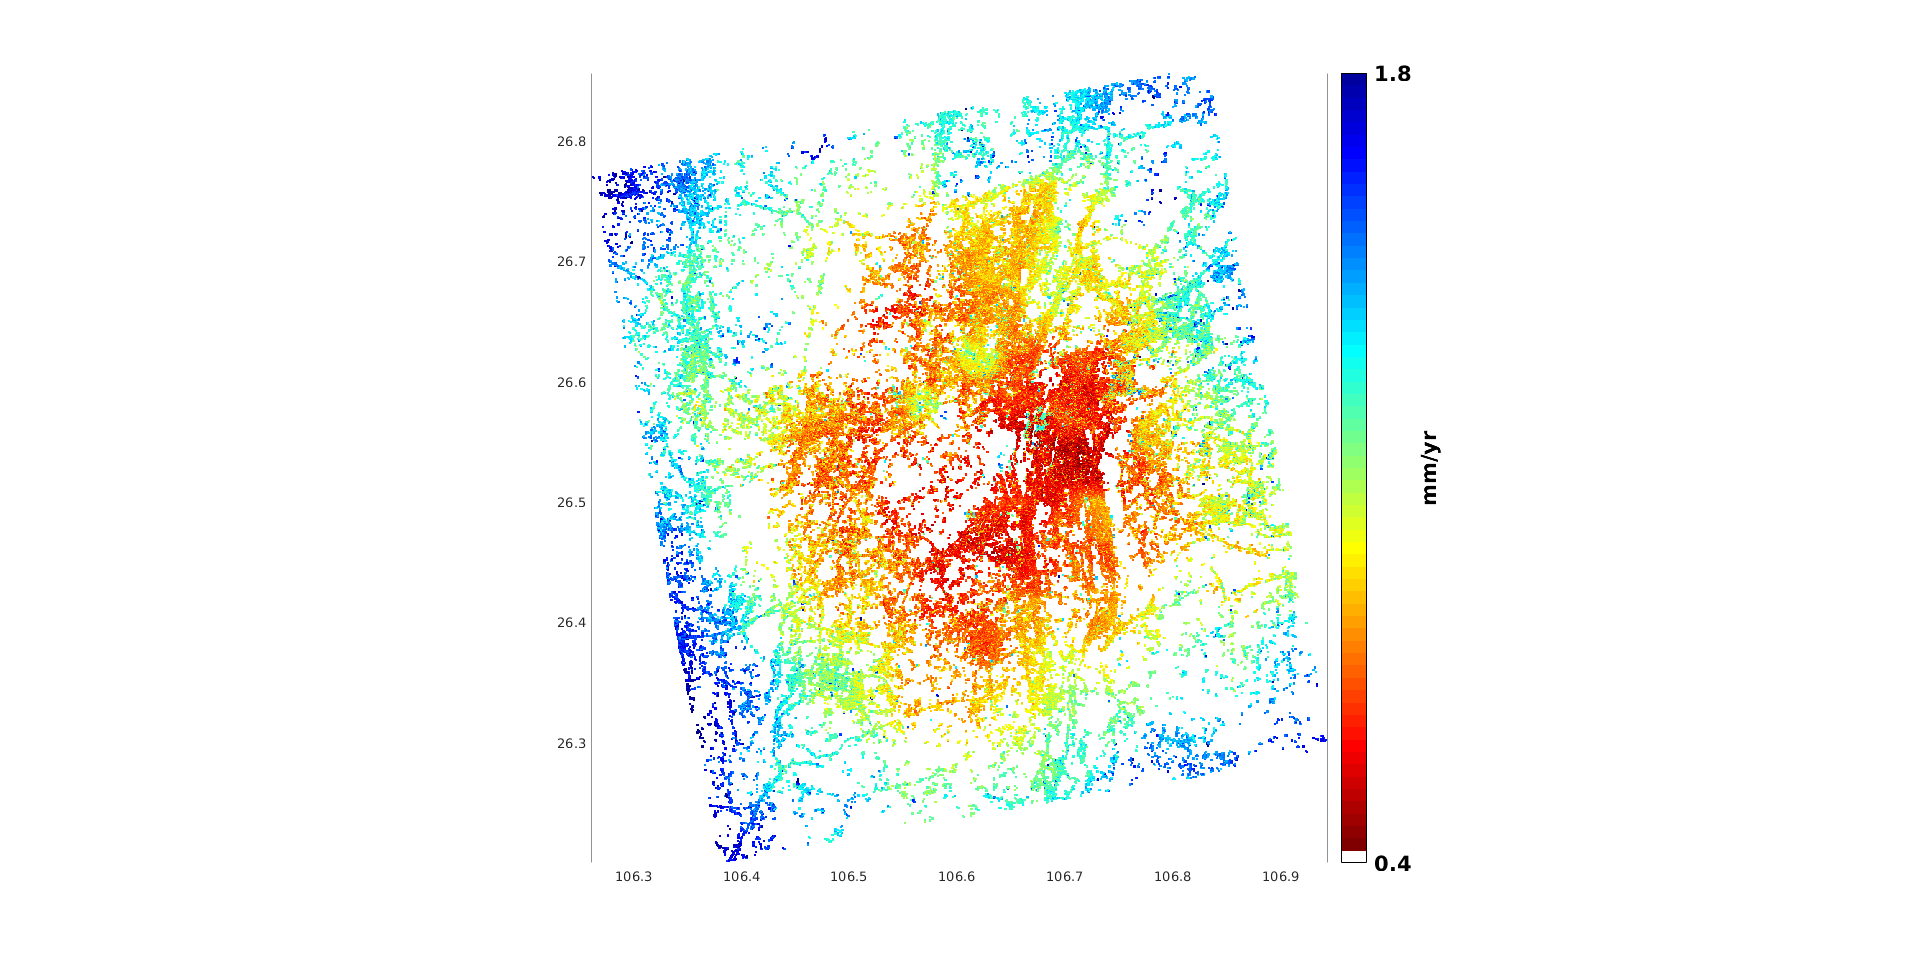
vs is the standard devisation of displacement which is lowest in the center and highest at the edges - this looks a bit too systematic to me but I can’t tell where it comes from. Could it have been introduced after applying GACOS?
Dear @ABraun ,
Thank you very much for your reply!
First of all, my AOI about 1500 square kilometers, located in Guiyang City, China, and I processed 72 S1 , during three years. full resolution,not multilook,about 270000 point.The current results do not introduce reference points.
From v-dao results, the subsidence area is not aggregated, but scattered, so from my current experience, I am not sure about the accuracy of this map.
VS-dao was drawn after step 7, I don’t know if this is correct.
Forgive my ignorance,Thanks in advance.
-vdao means you remove DEM errors as well as atmospheric and oribtal trends. Depending on how well this works, your data can be improved but in some cases new errors are introduced.
I cannot tell you which of the results is most feasible because I don’t know the study area. Explanation and interpretation of the result is your duty
Dear @ABraun ,
Thank you sir for your help!
I understood this information earlier, but my AOI does not cover,
I will come back to share good news when I have it.
I am still struggling with the methodology on how to apply such corrections either to the raw interferograms before exporting them into StaMPS processing or alongside with it after applying phase unwrapping. I was wondering if you have any tutorial to guide users through that correction process or if you could direct me into a step-by-step manual for how to use GACOS’s Binary-grid or Geotiff products with Interferograms. Most of what I know for now is that we need to do time differing between two delays maps of two dates and space differing for the resulted Zenith Path Delay Difference Map (ZPDDM) by subtracting the delay value of a particular reference lat/long location on (ZPDDM) from the remaining phase delay values from the same entire map. Hence, the differenced in time and space map should be either subtracted or added to the interferograms depending on whether later or earlier is the master date for each interferogram. The problem is that I do not know how to practically apply such process using matlab nor SNAP toolbox if possible, and based on what may a choose the previously mentioned reference point ?