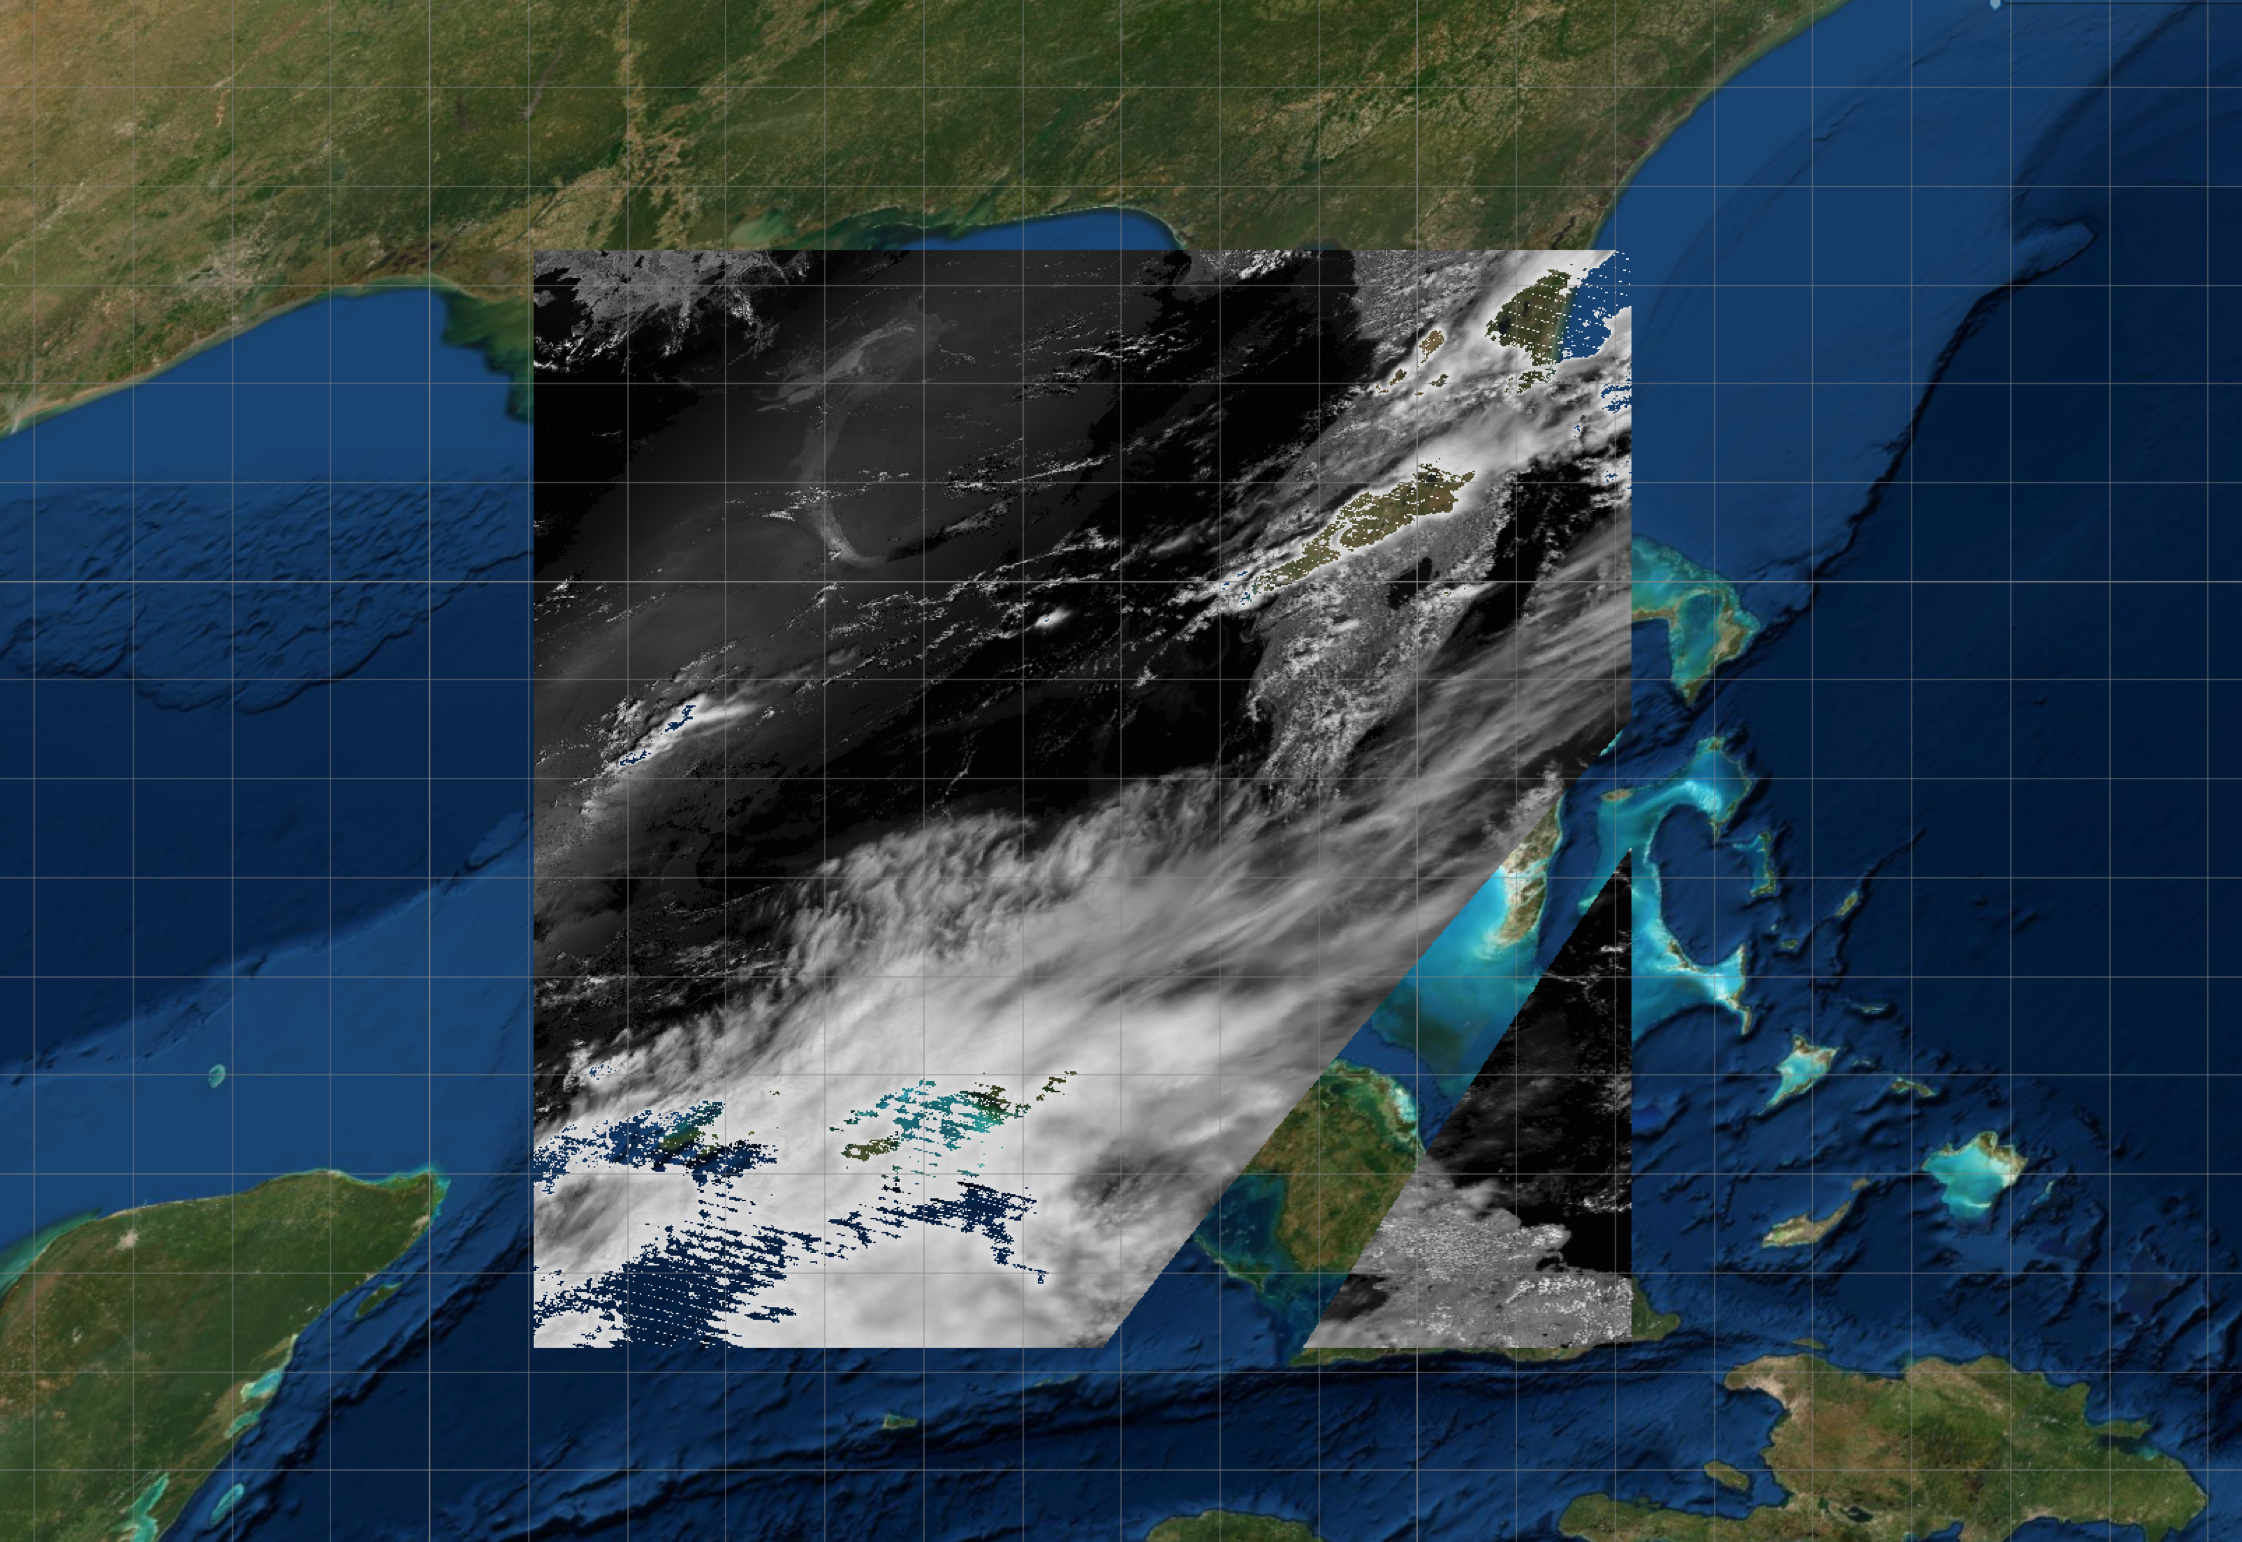
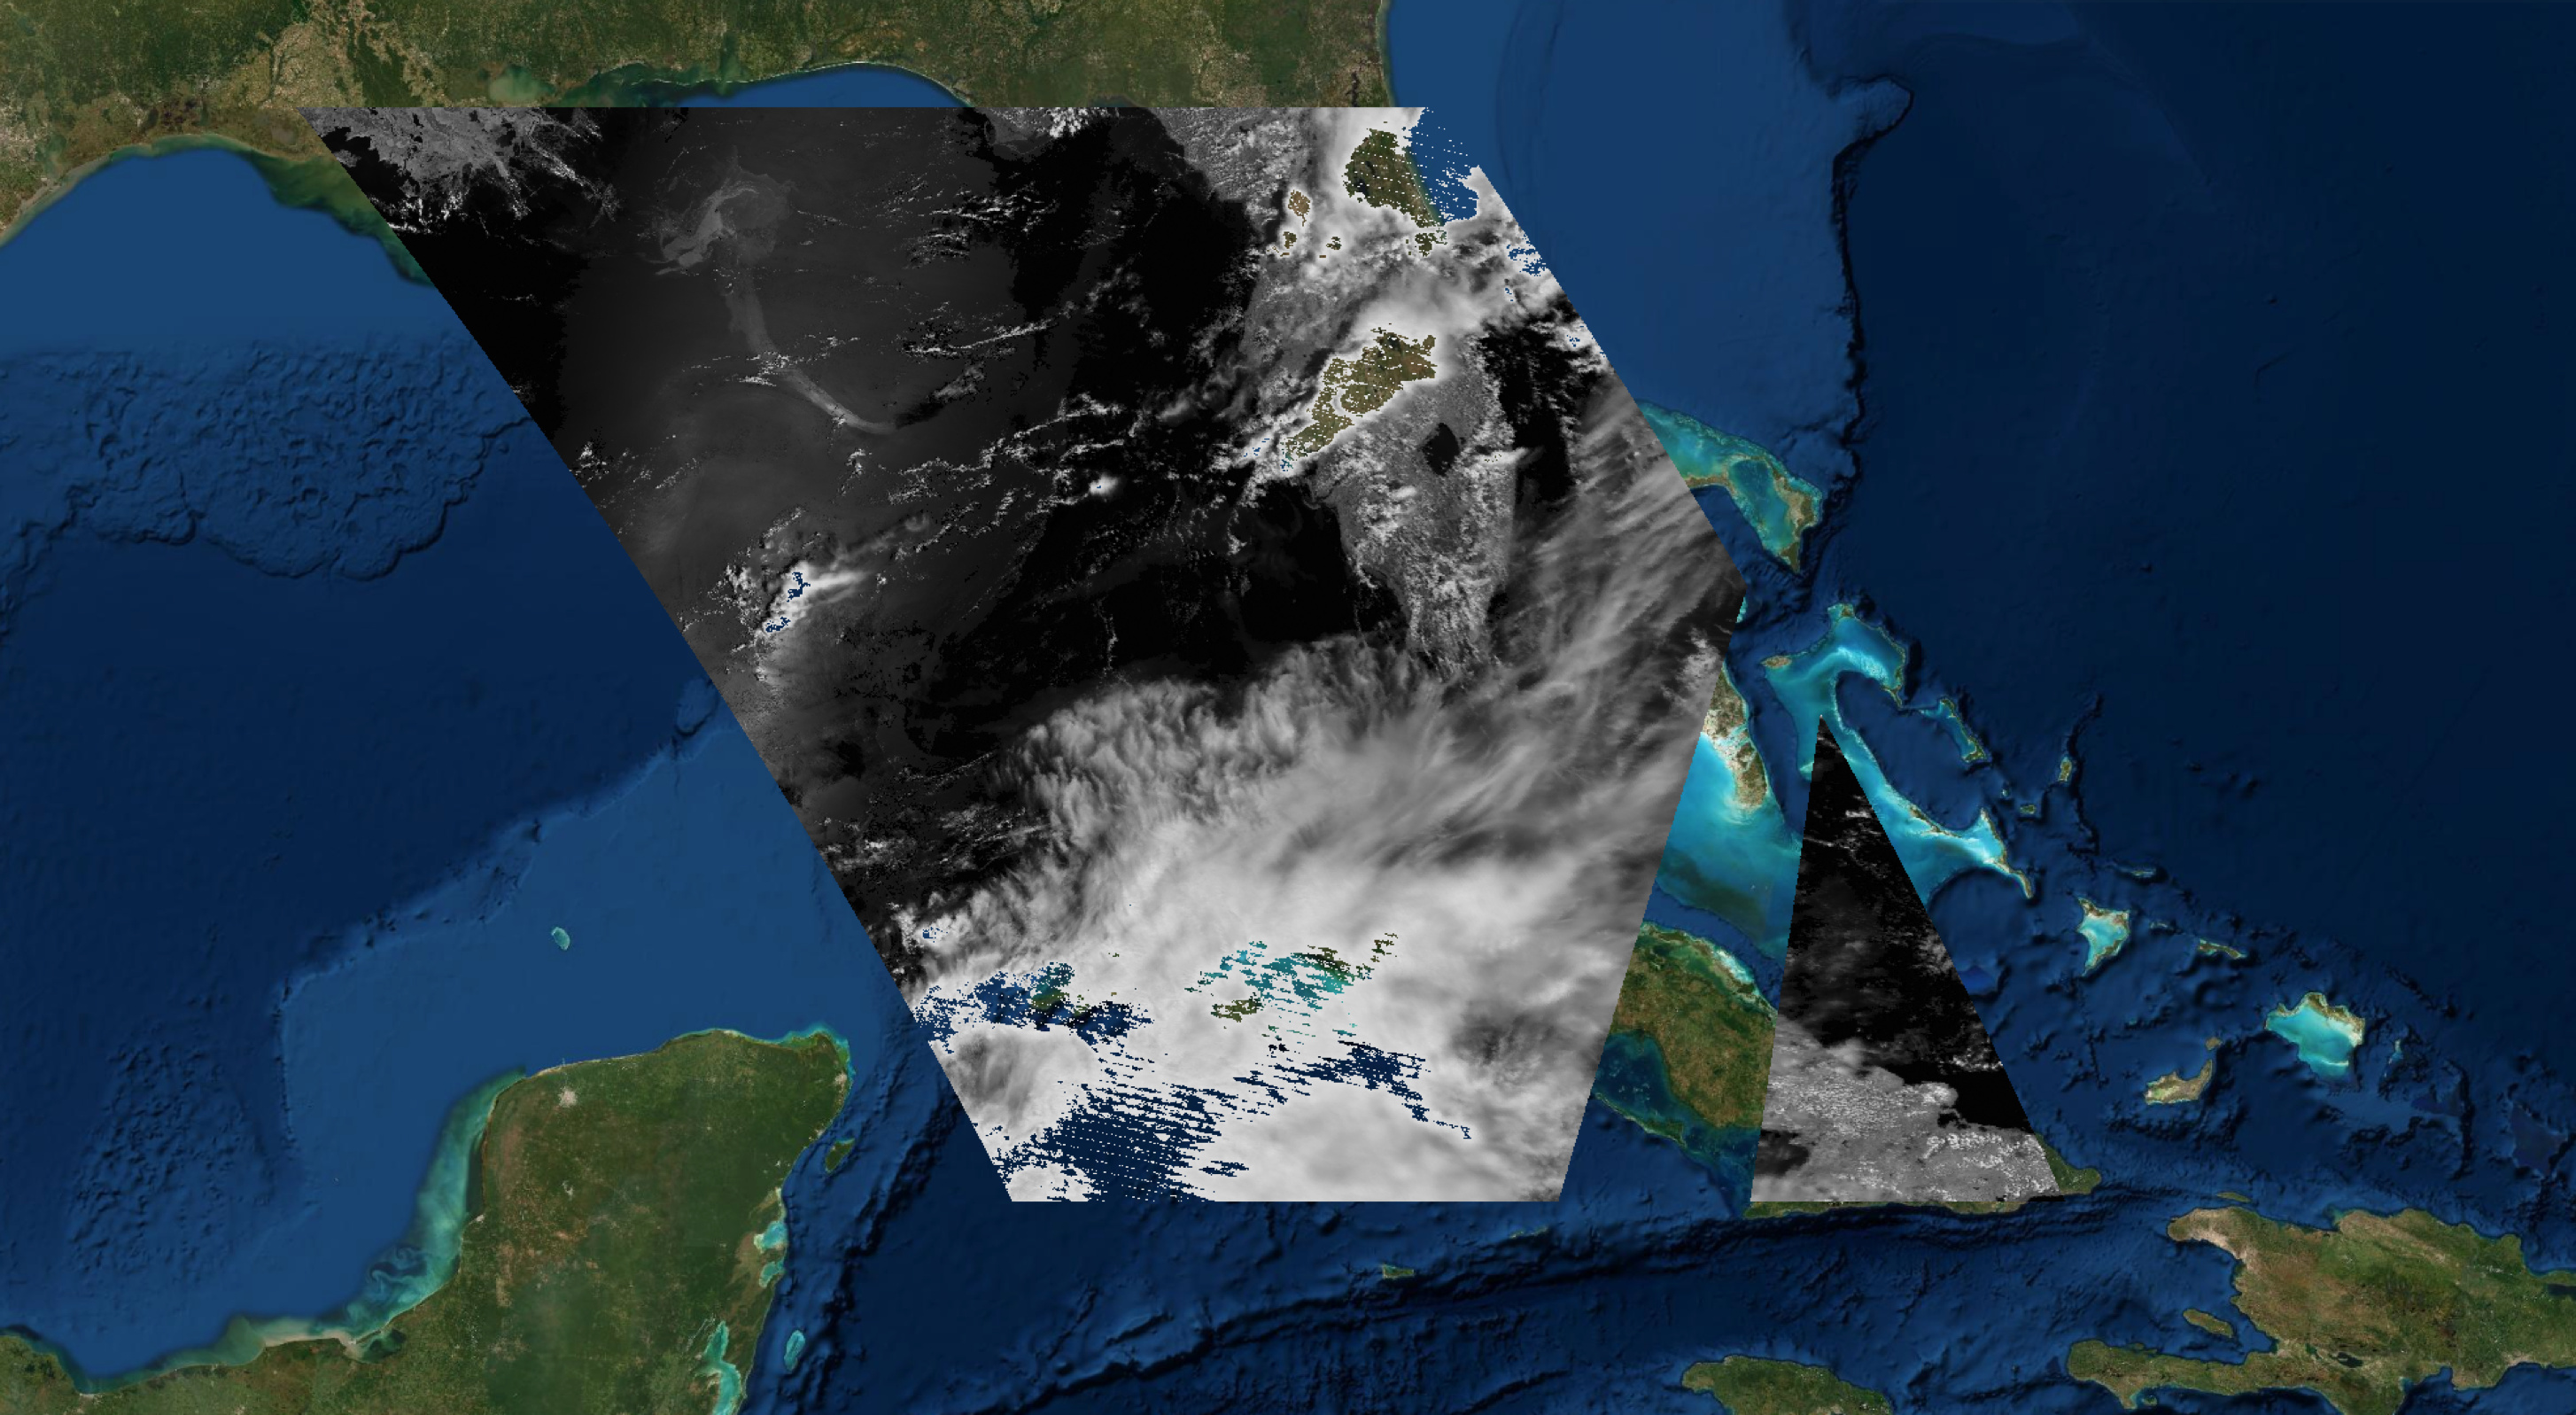
I am currently working on a project to map oil plumes in the Gulf of Mexico using MOD09GA data (MOD09GA.A2010137.h10v06.006.2015207160843 specifically) and I am confused about the actual pixel size of this data.
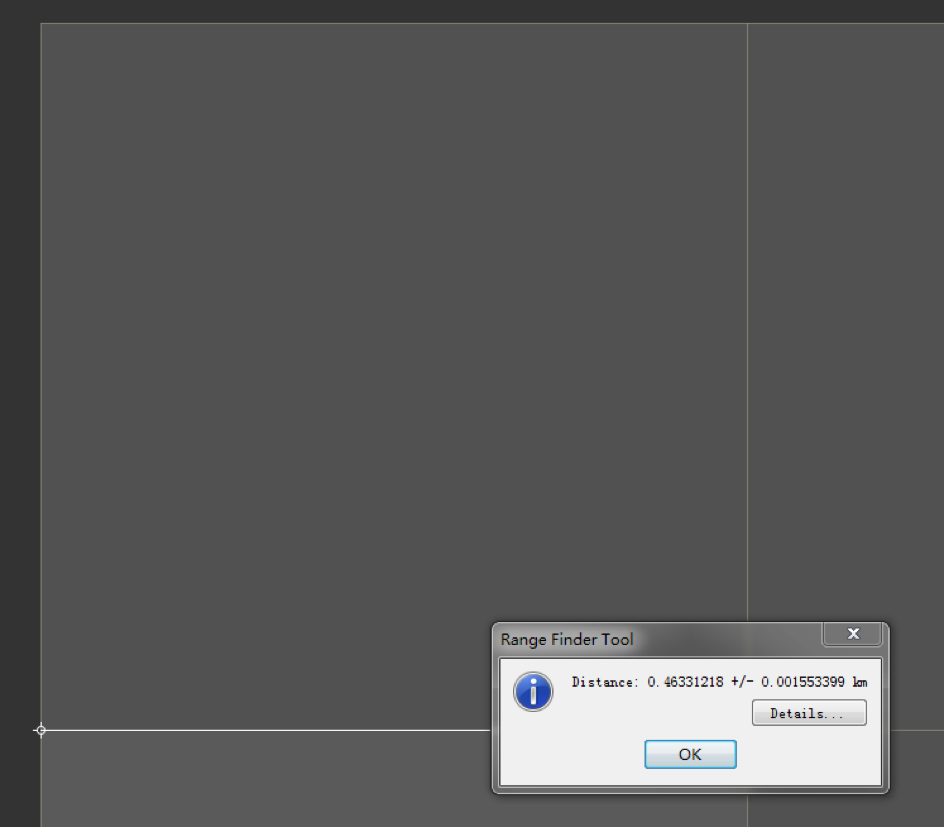
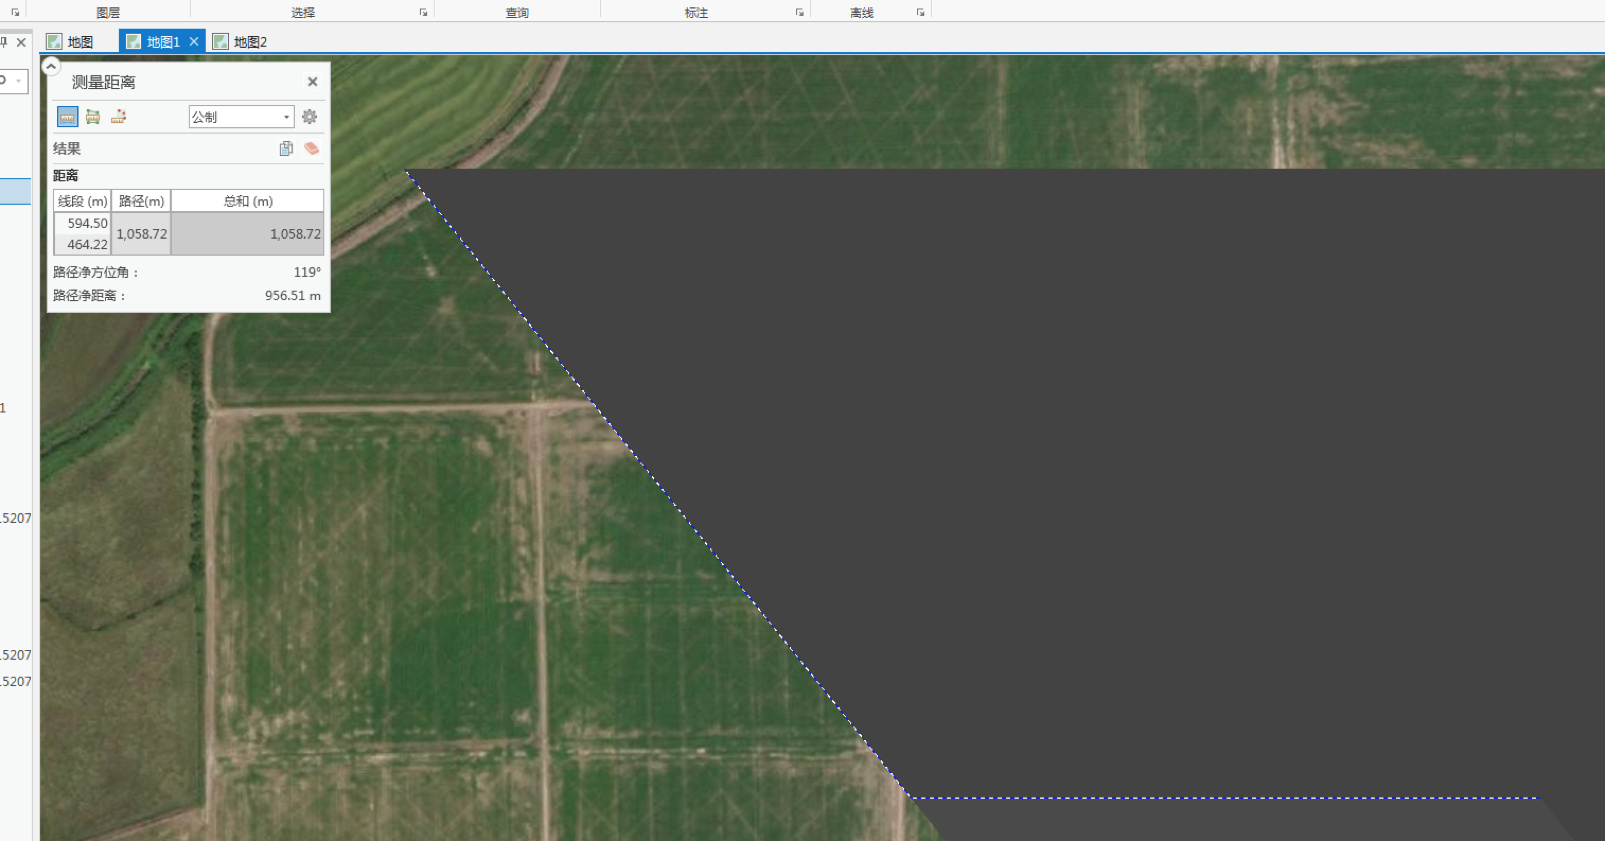
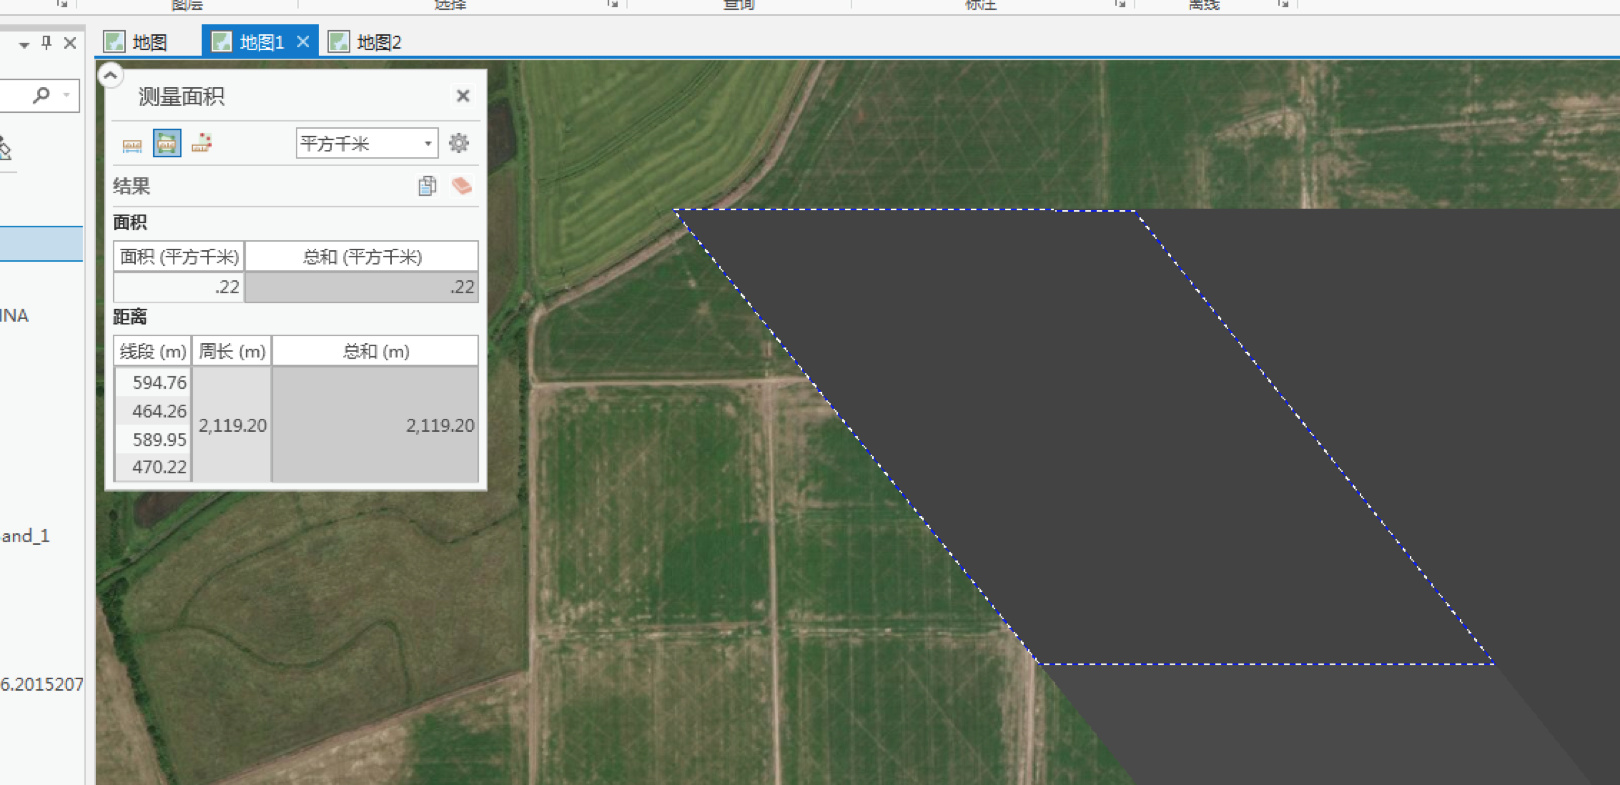
Taking the first pixel (x=1, y=1) as an example, the length, width and area of this pixel is 595m, 463m and 0.389km^2:
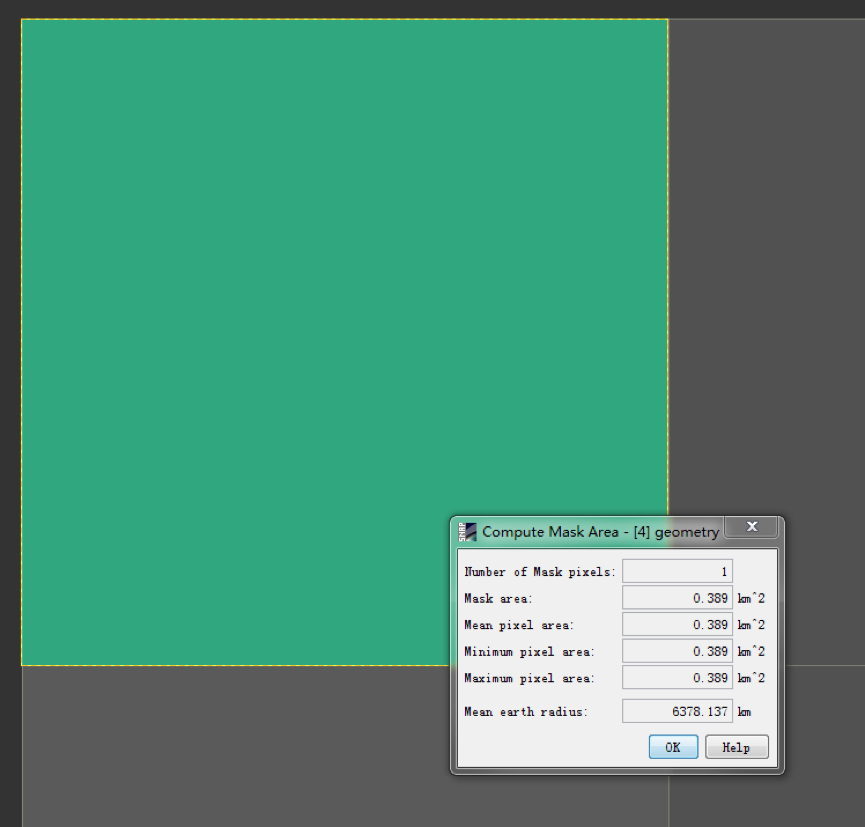
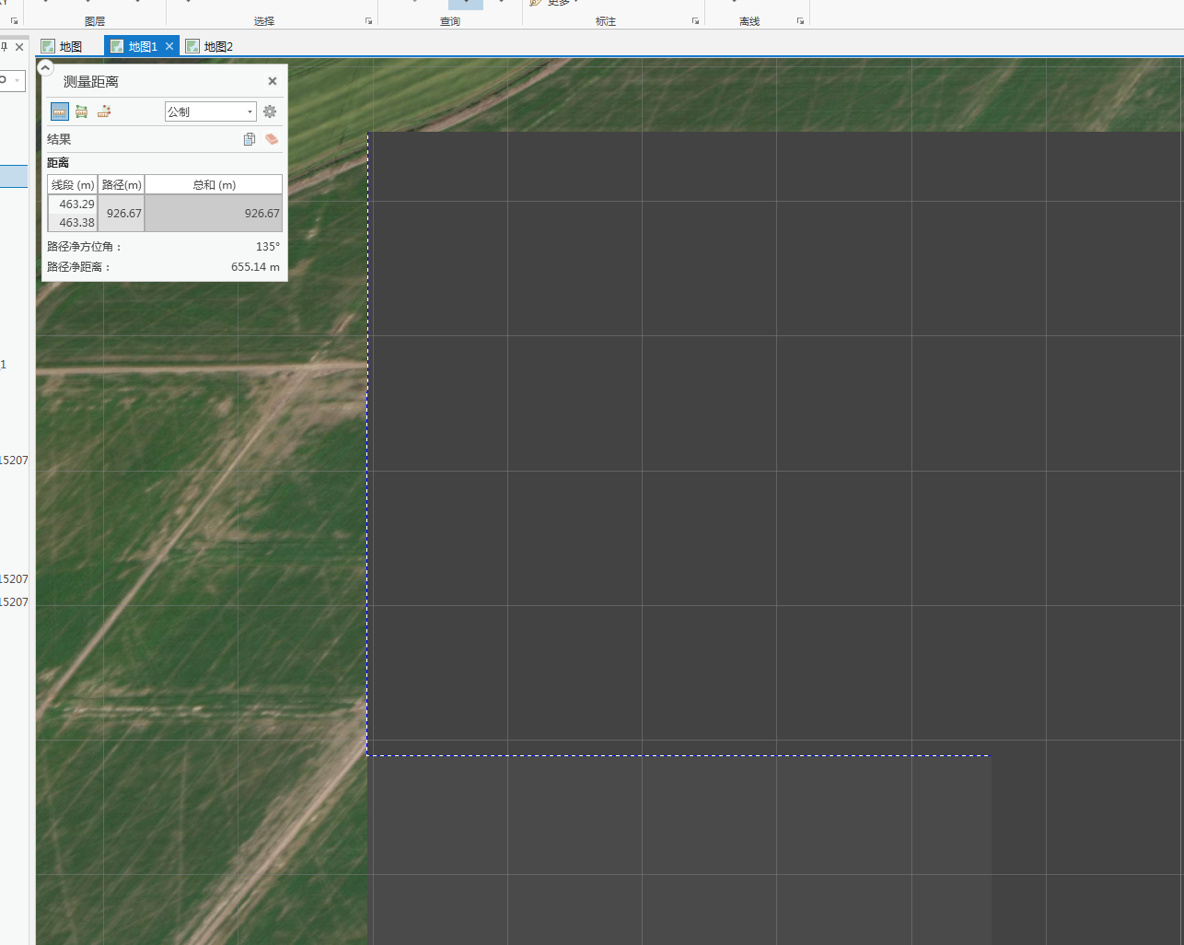
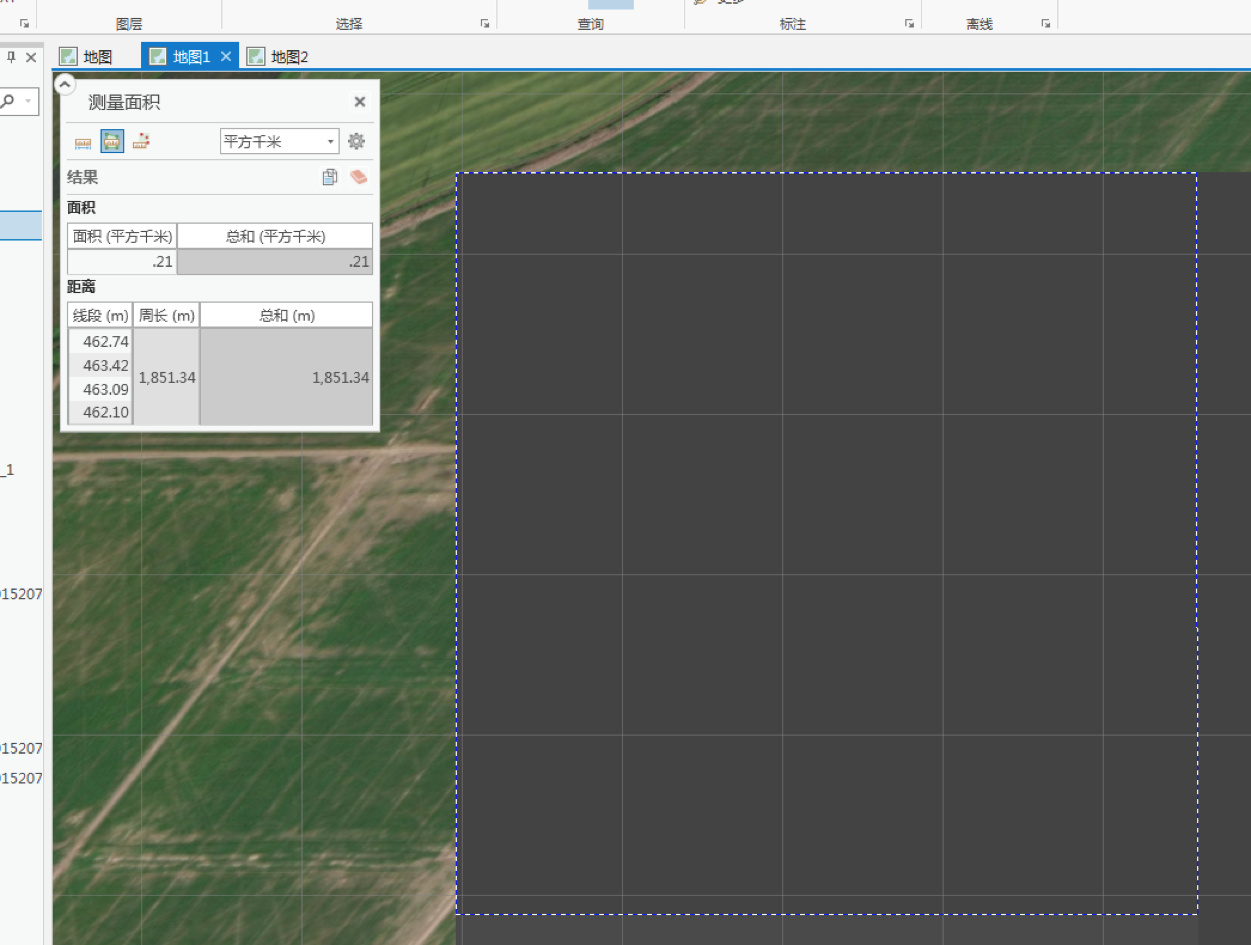
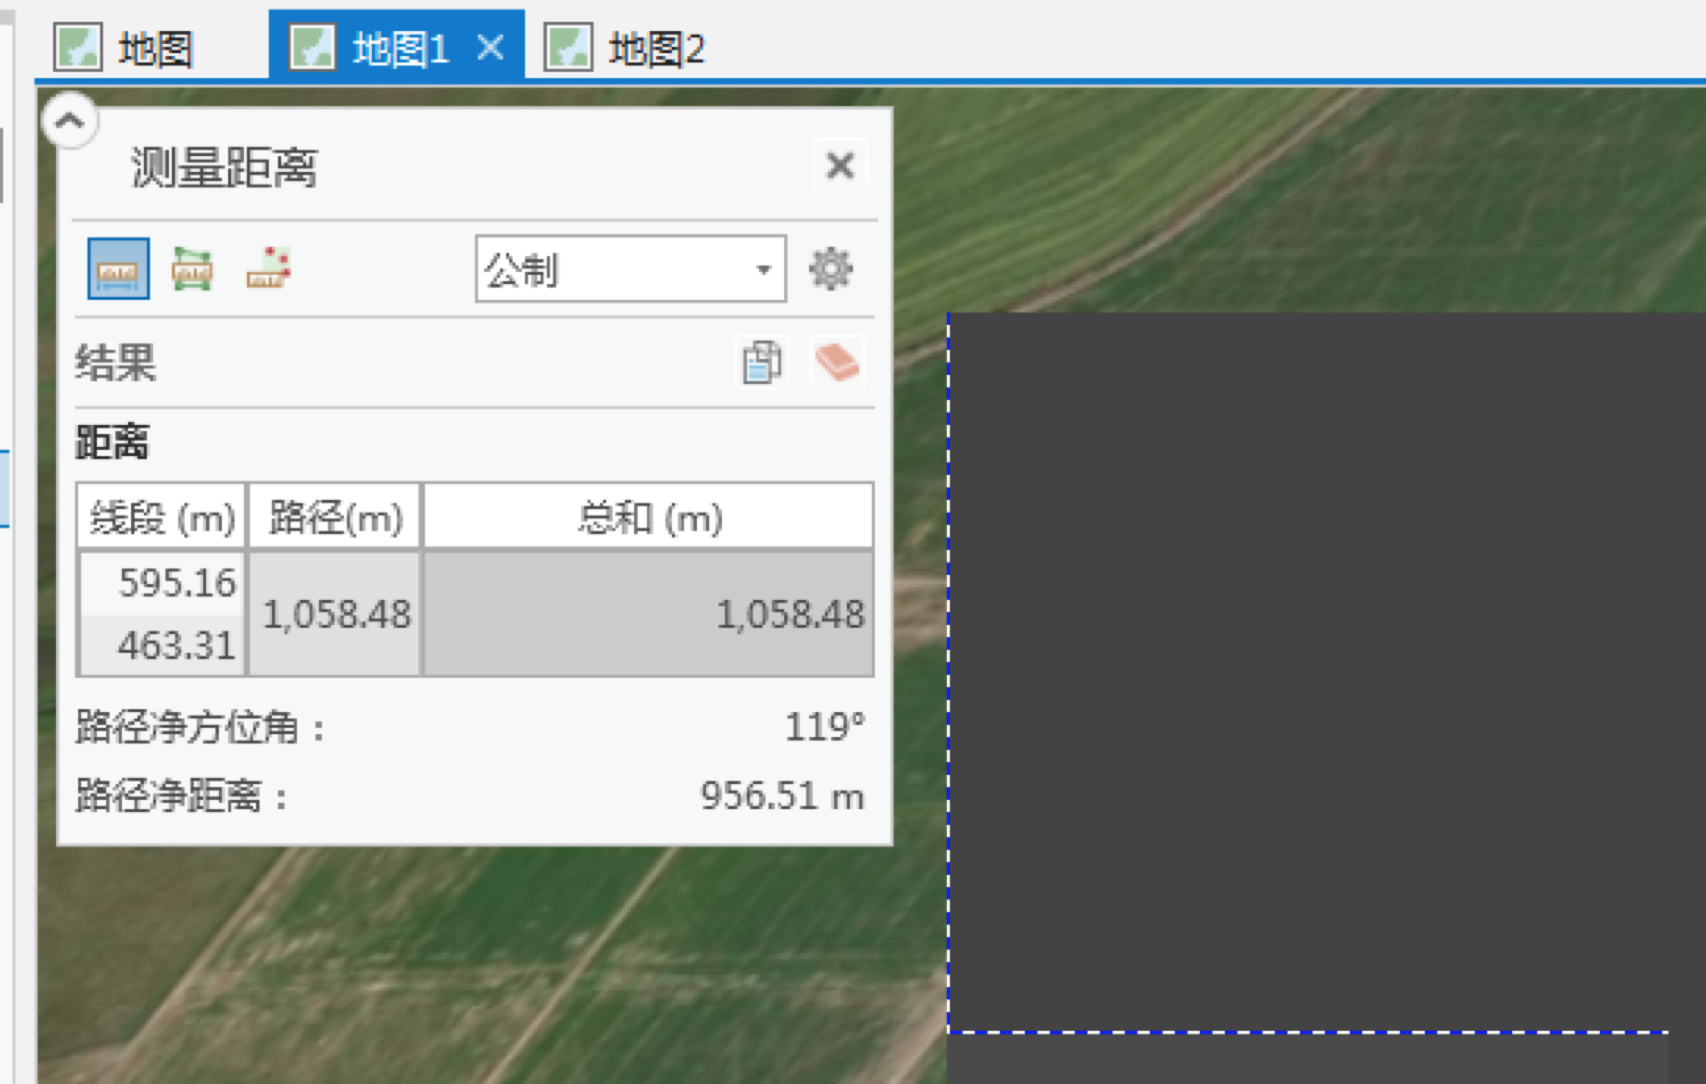
But when I import the same data into ARCGIS pro using the same coordinate system, the length, width and area of the same pixel became 463m, 463m and 0.21km^2 as shown below (sorry for the Chinese in the images):
I try to explain this a bit. But I don’t know what ArcGIS is doing.
The pixel of MODIS Level-1 do not represent a square area on the earth surface.
Their size vary also across track. At nadir they are smaller. This is due to the sensor.
The pixels are only rectangular if the image is rectified by a reprojection step. Then the data is usually called as being Level-2. That’s what you have done in ArcGIS.
In your case it looks like ArcGis is not resampling the data but stretching it. I’ve heard that there is also some feature ArcGis which is resampling the data. But I can’t tell where you can find it.
ArcGis is definitely not resampling it as I looked through several pixels at the same XY position in SNAP, ArcGis, MATLAB and they have the same values (loading the same MOD09GA level-2 data) with no signs of reprojection.
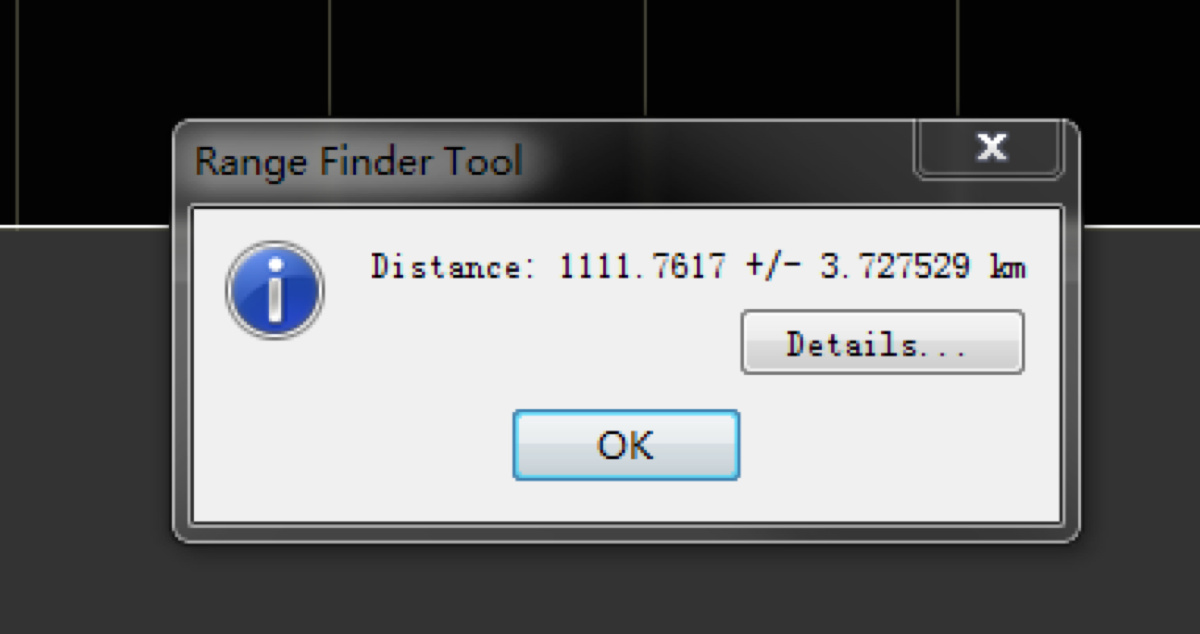
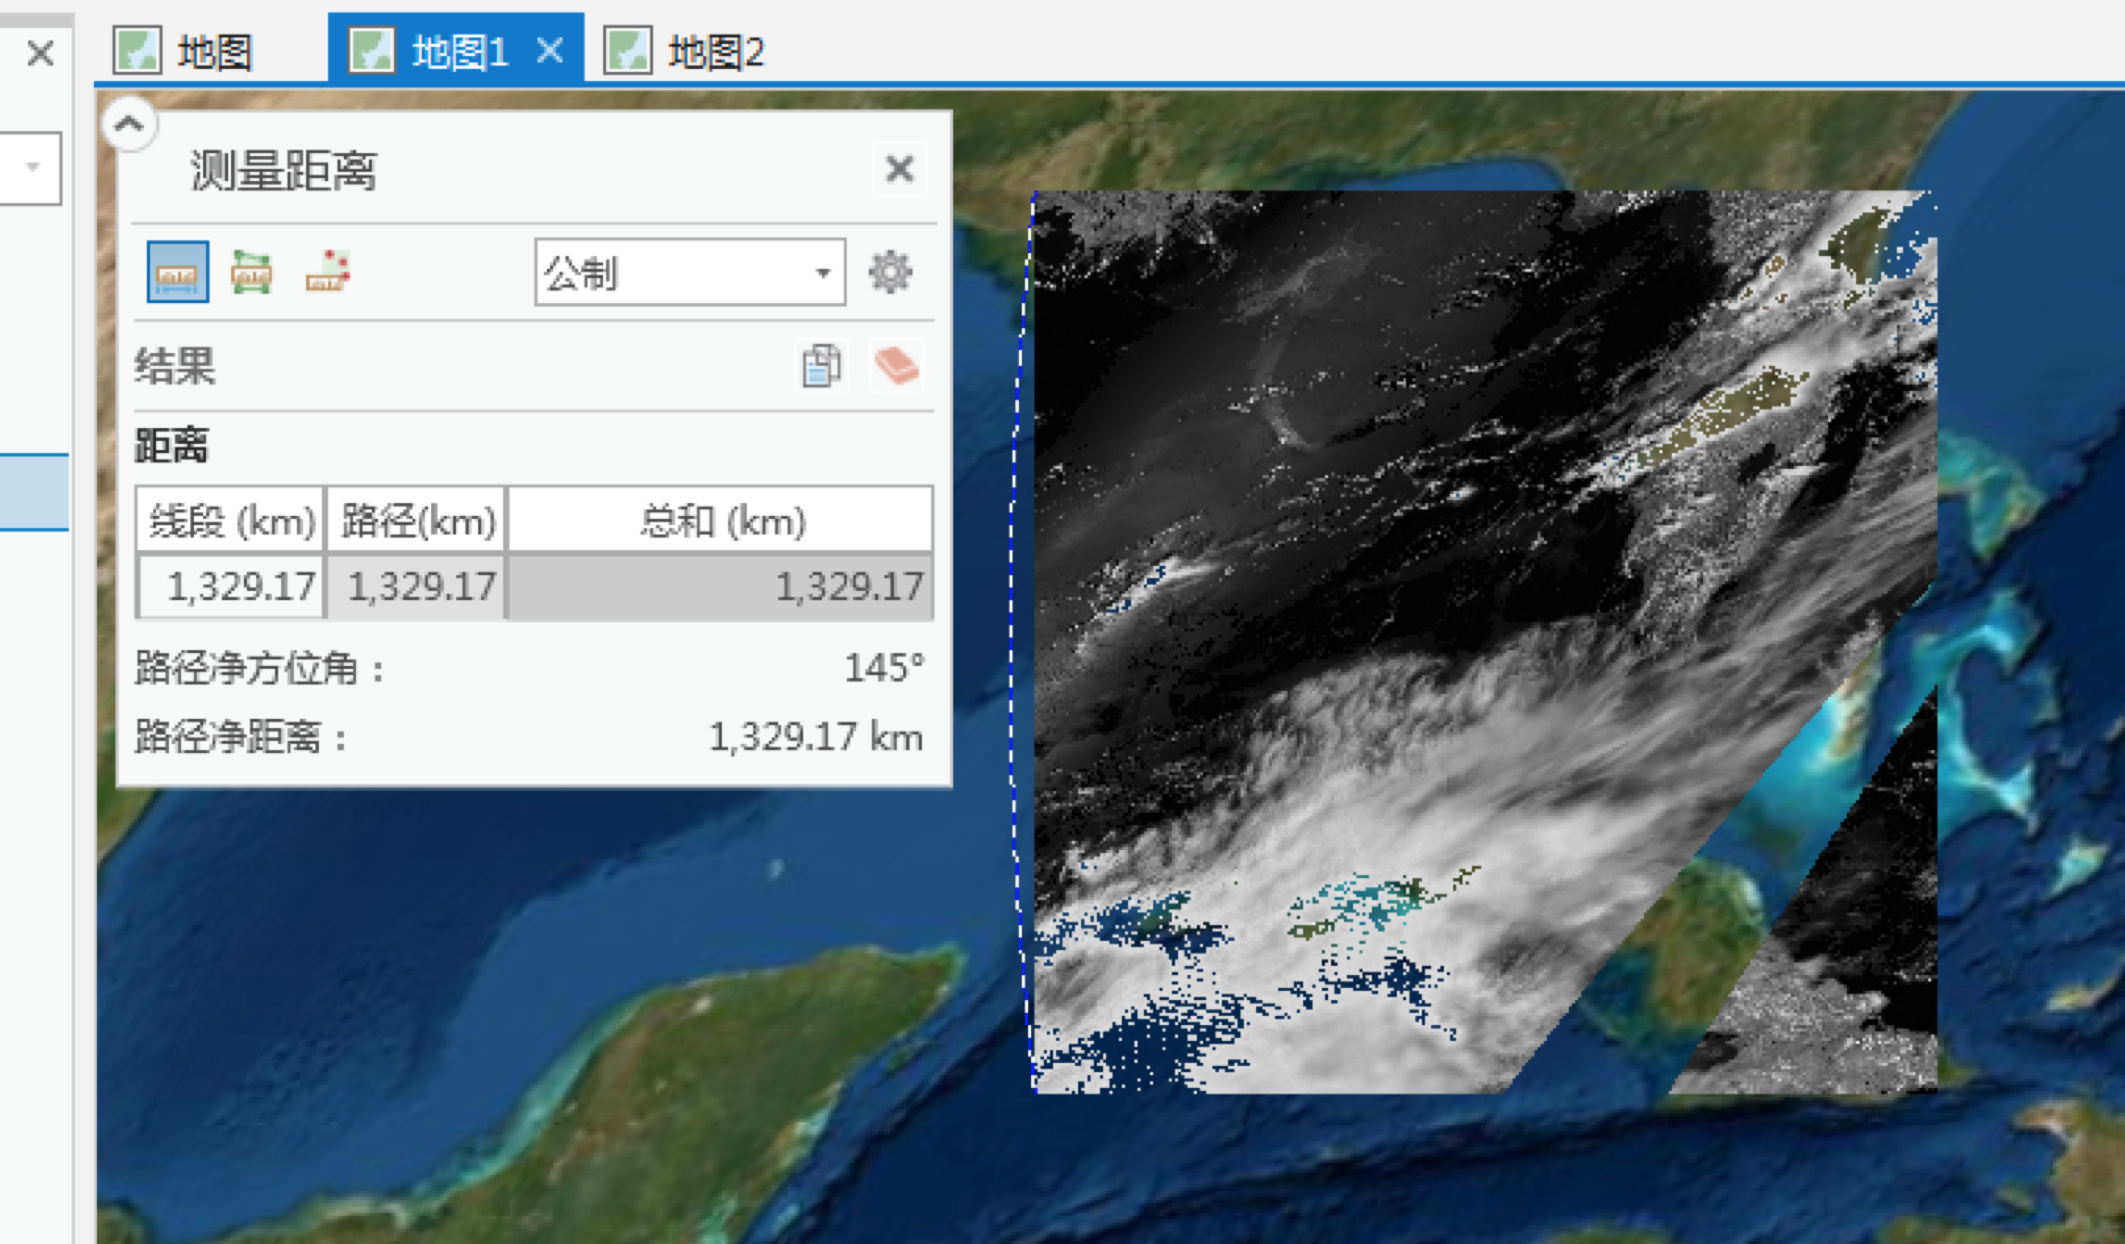
If this is the case, then the overall dimension in SNAP and ArcGis should have been the same. In Arcgis, the length and width of the image are 1111.95km by 1111.95km as shown:
On the website of MODIS (https://lpdaac.usgs.gov/products/mod09gav006/) they mentioned that the Geographic Dimensions are 1200 km x 1200 km, larger than 1111km but appeared to be the same in length and width, so will it be safe to say that Arcgis is right at this point?
Hope you can answer my questions, thank you very much!
You can also ask in the SeaDAS forum. They are the experts for the data.
SeaDAS is based on BEAM (the predecessor of SNAP).
When you work with SeaDAS you should see the same results.
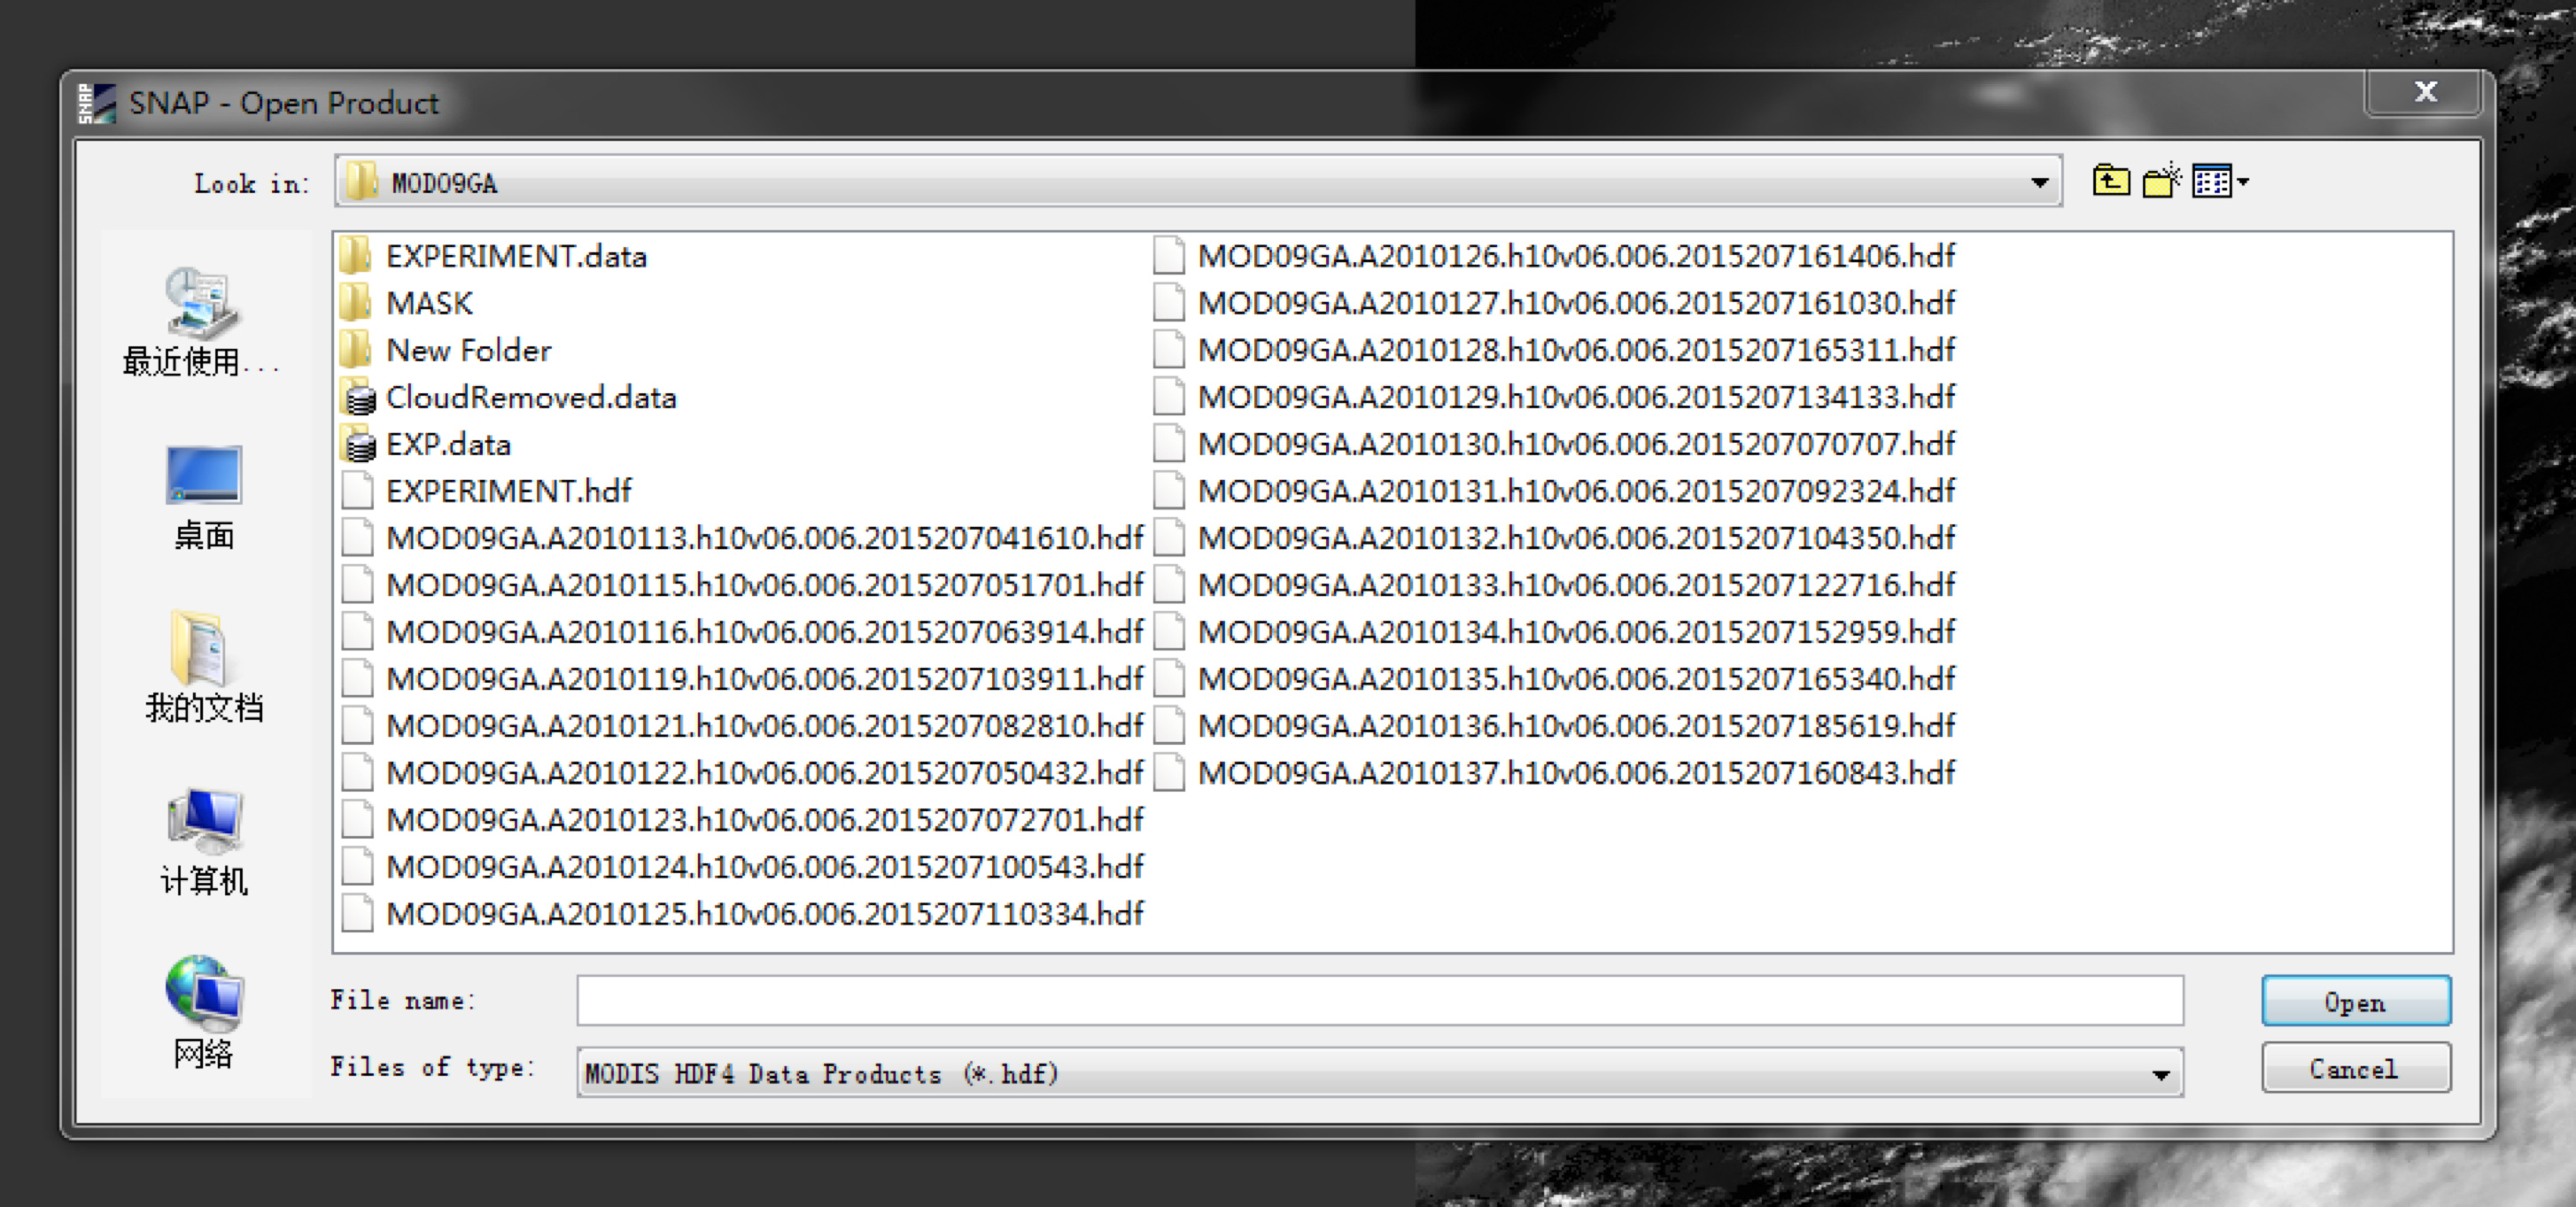
To obtain the the geo-coding information of MOD09GA data, the files of type must be ‘MODIS HDF4 data products (*.hdf)’ when importing it: (In addition, geo-information also seemed to be lost if you transform the data into other format like geotiff or dim.)
The tile is located at where it was indicated on http://search.earthdata.nasa.gov/, so I am assuming that the geo information is correct. Hope you can reproduce my steps correctly and hear you soon! I will also post this issue on SaeDAS Forum and see if they have the answer.
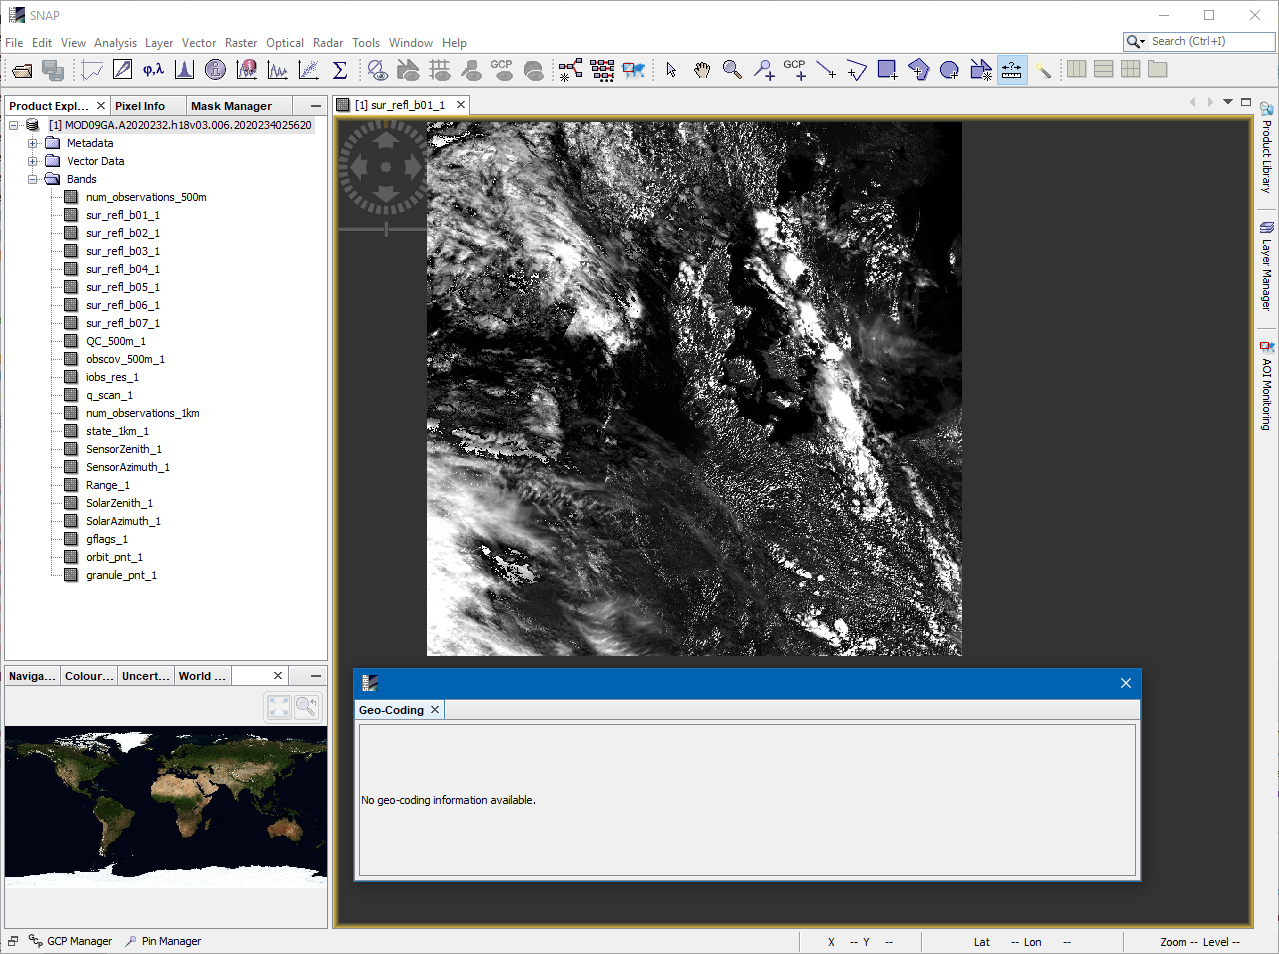
Now I was able to open the data with geo-coding information.
I had to use import instead of just open.
The data is provided in sinusoidal projection.
This is an equal-area projection. Those projections preserve area measure, generally distorting shapes in order to do that.
The wikipedia article shows this quite nice.
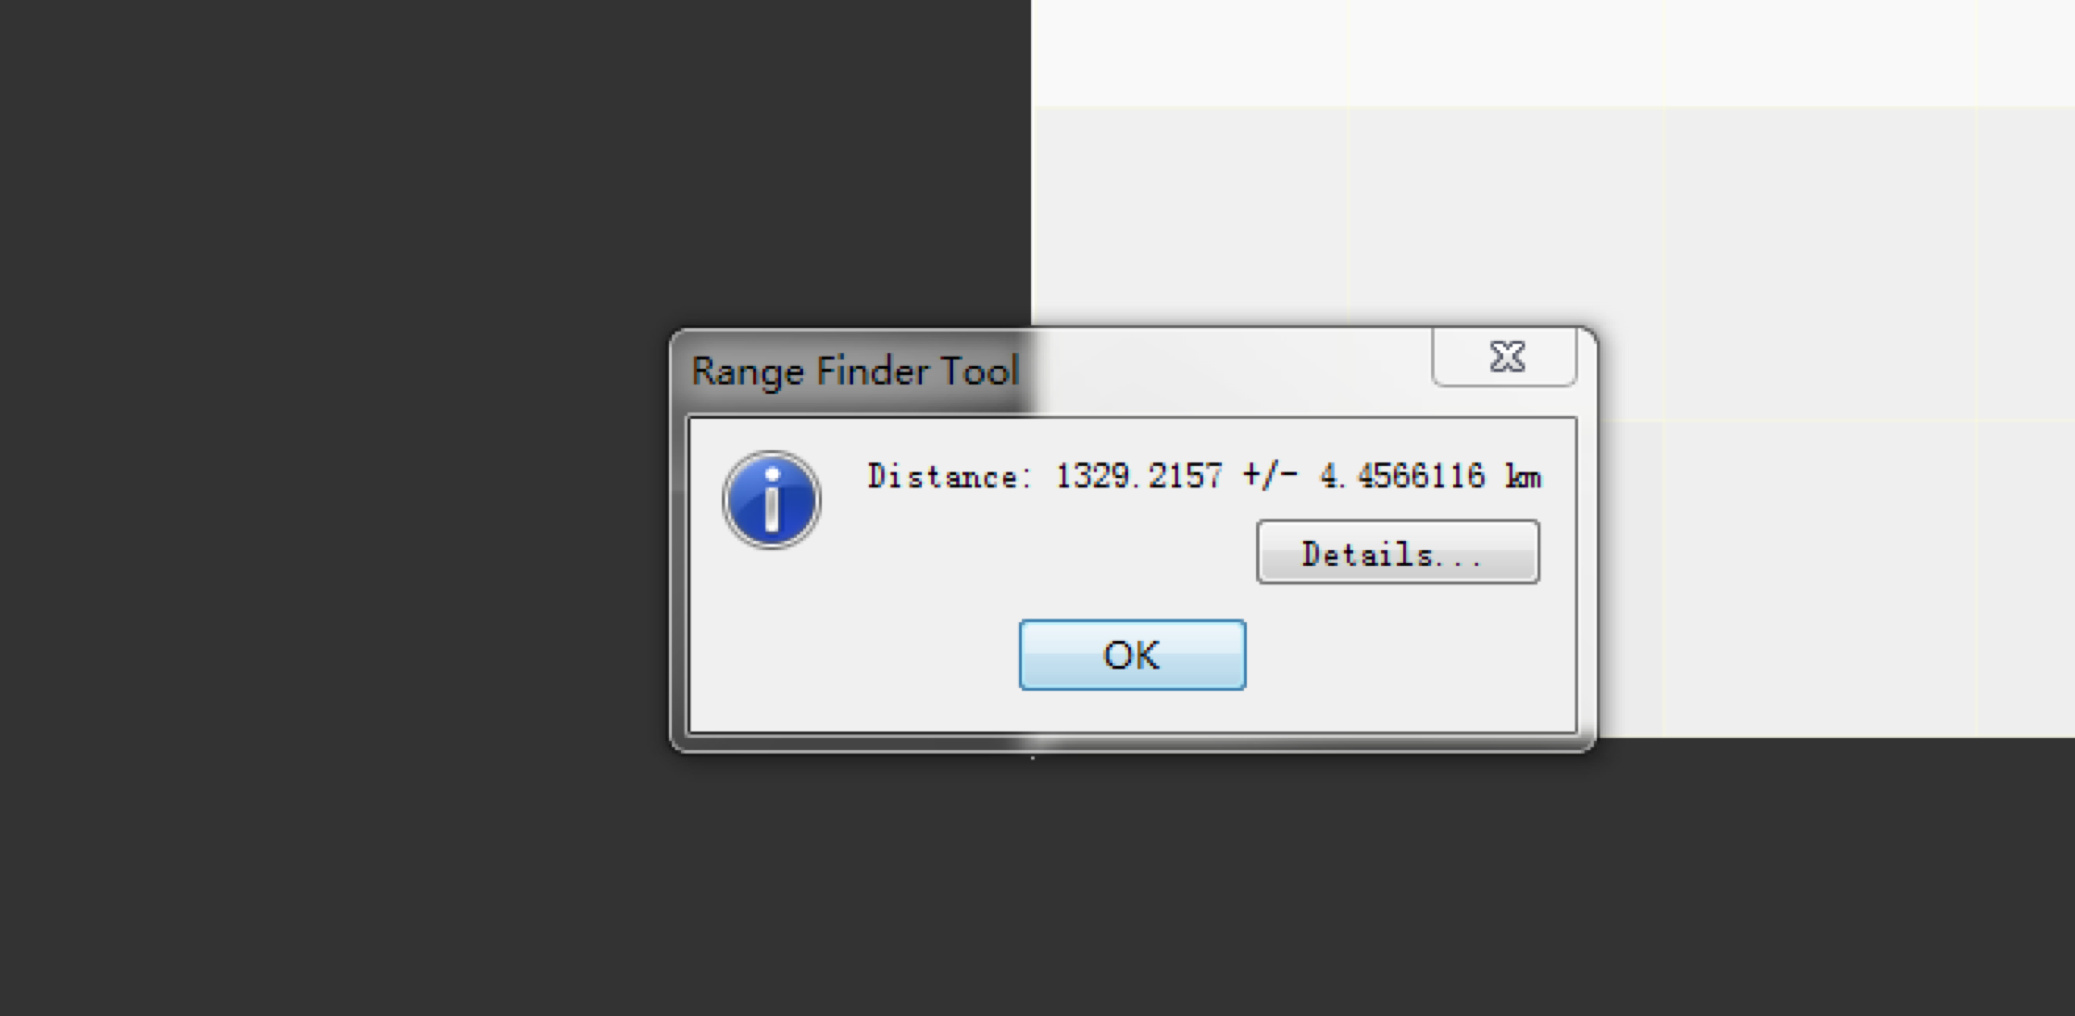
If you measure the height of a pixel at the top of the scene it will give you a different result as if you measure at the bottom. The value changes with the location on earth.
I’m quite confident that SNAP shows the correct values. What ArcGIS is doing, I don’t know.
(Not sure why the measuring line is curved)
But the area of the first area is the same as reported in my previous reply.
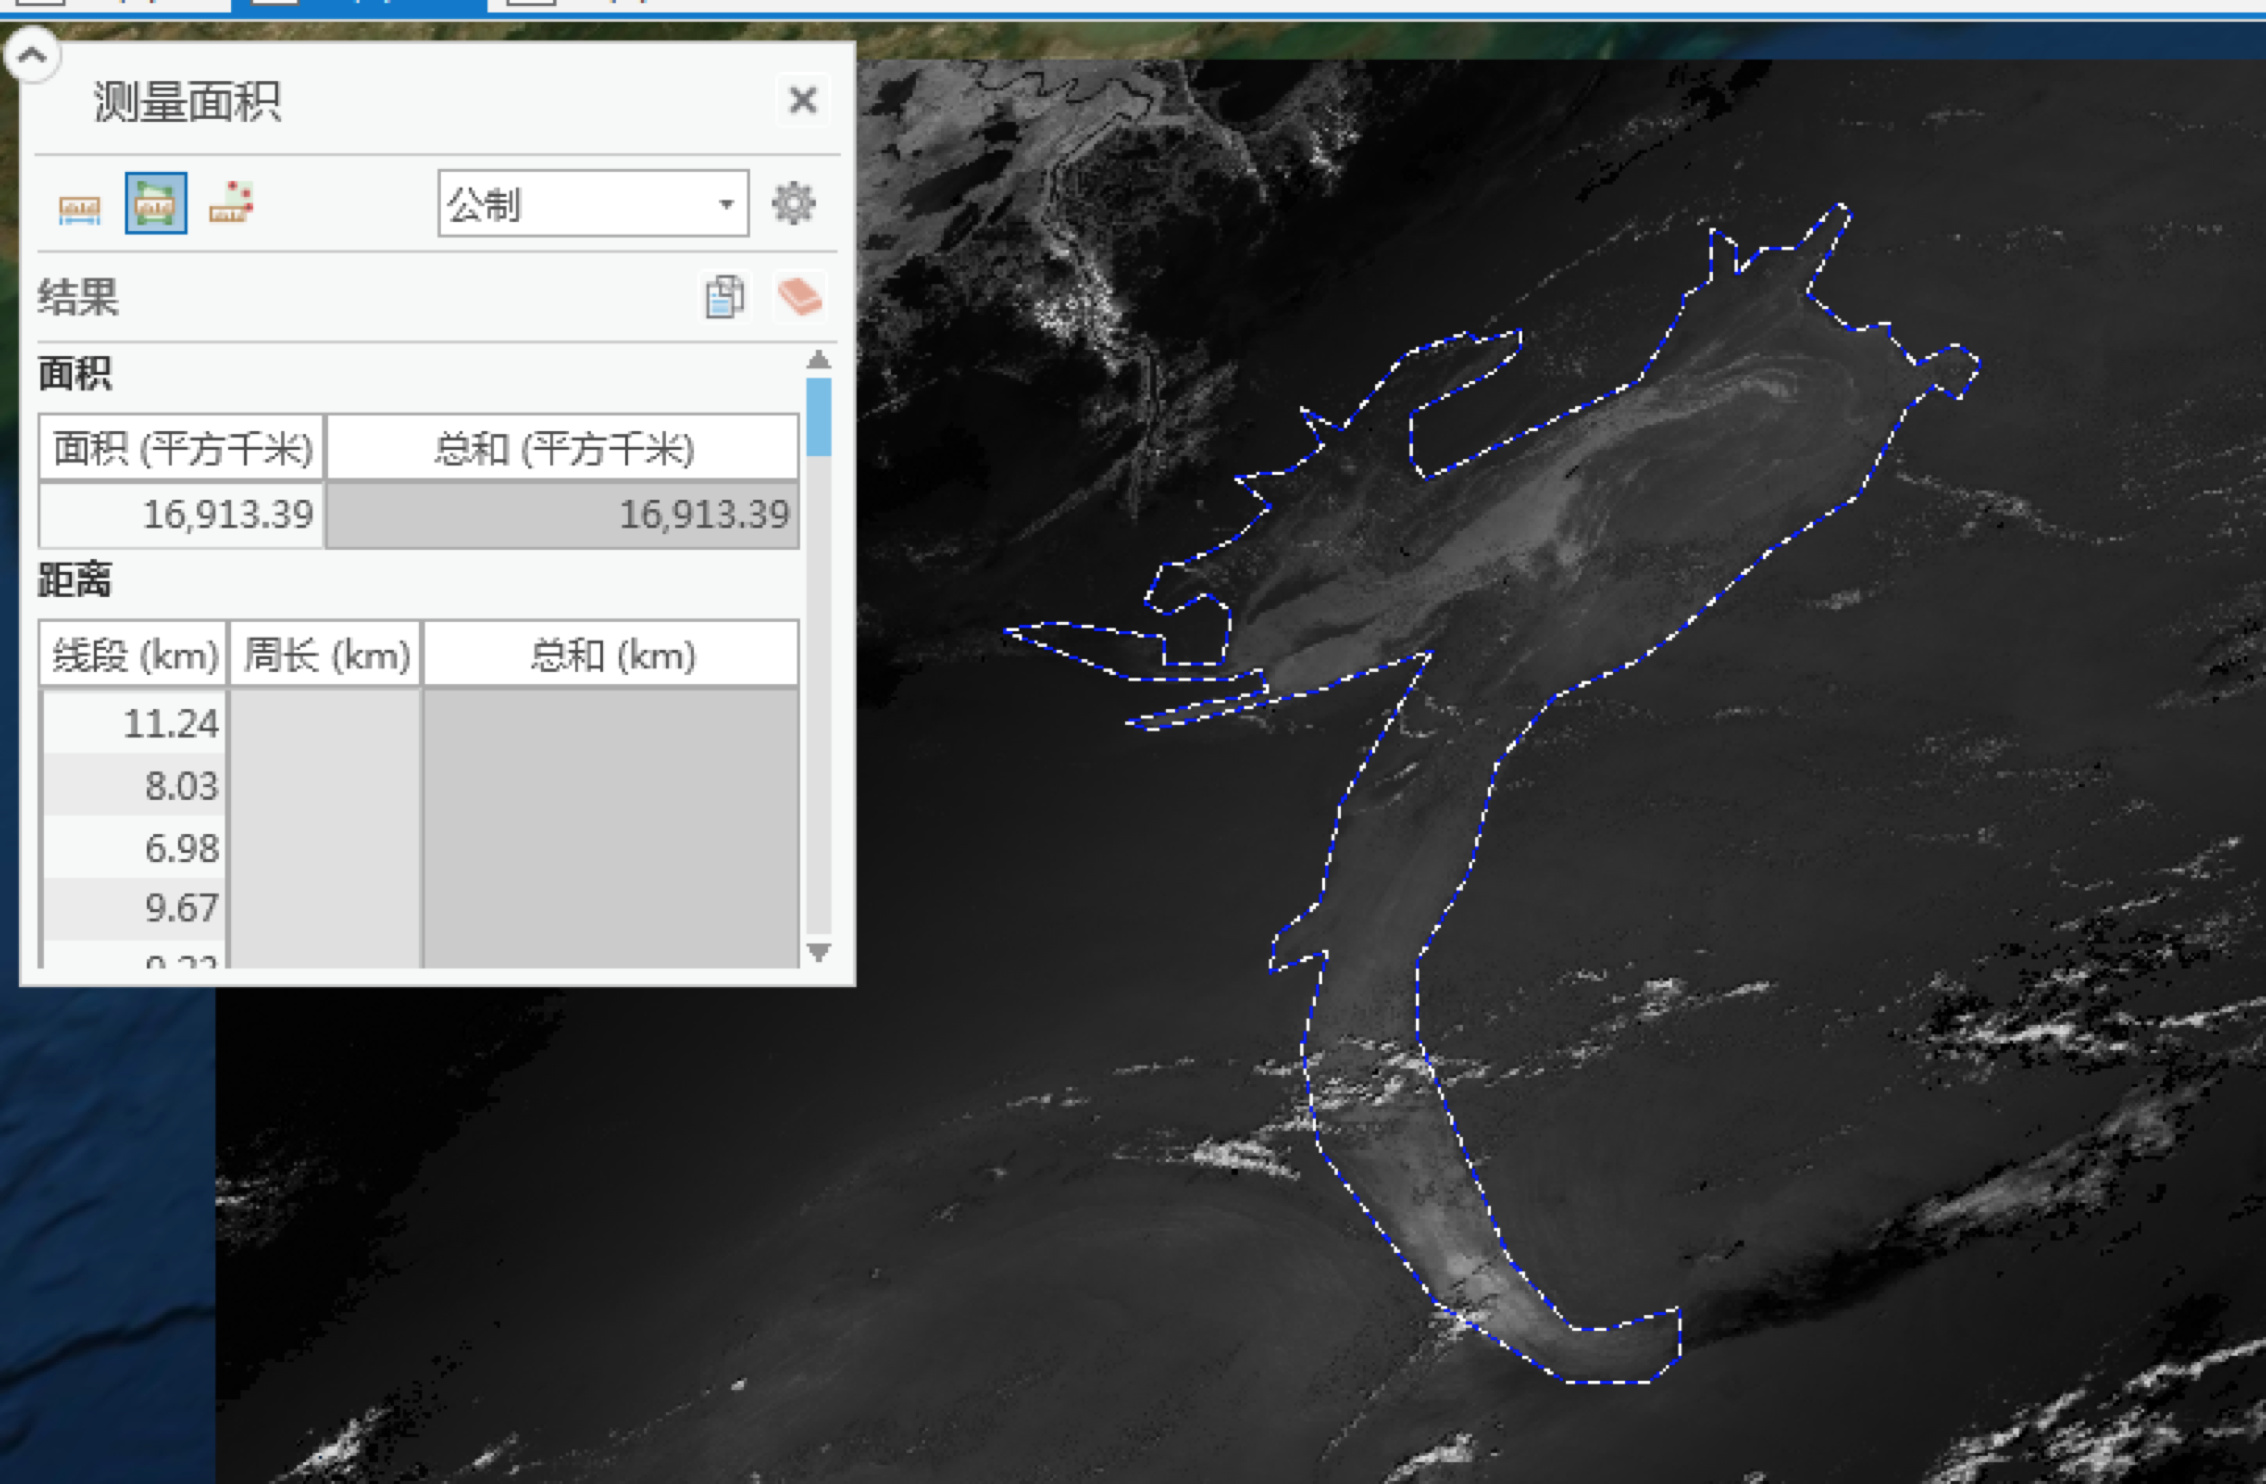
In Clark’s study (Clark, R., Swayze, G., Leifer, I., Livo, K., Kokaly, R., Hoefen, T., . . . Dominguez, R. (2010). A Method for Quantitative Mapping of Thick Oil Spills Using Imaging Spectroscopy. USGS. Retrieved from https://pubs.usgs.gov/of/2010/1167/downloads/pdf/OF10-1167.pdf), there is an oil covered area approximately 14400 km^2:
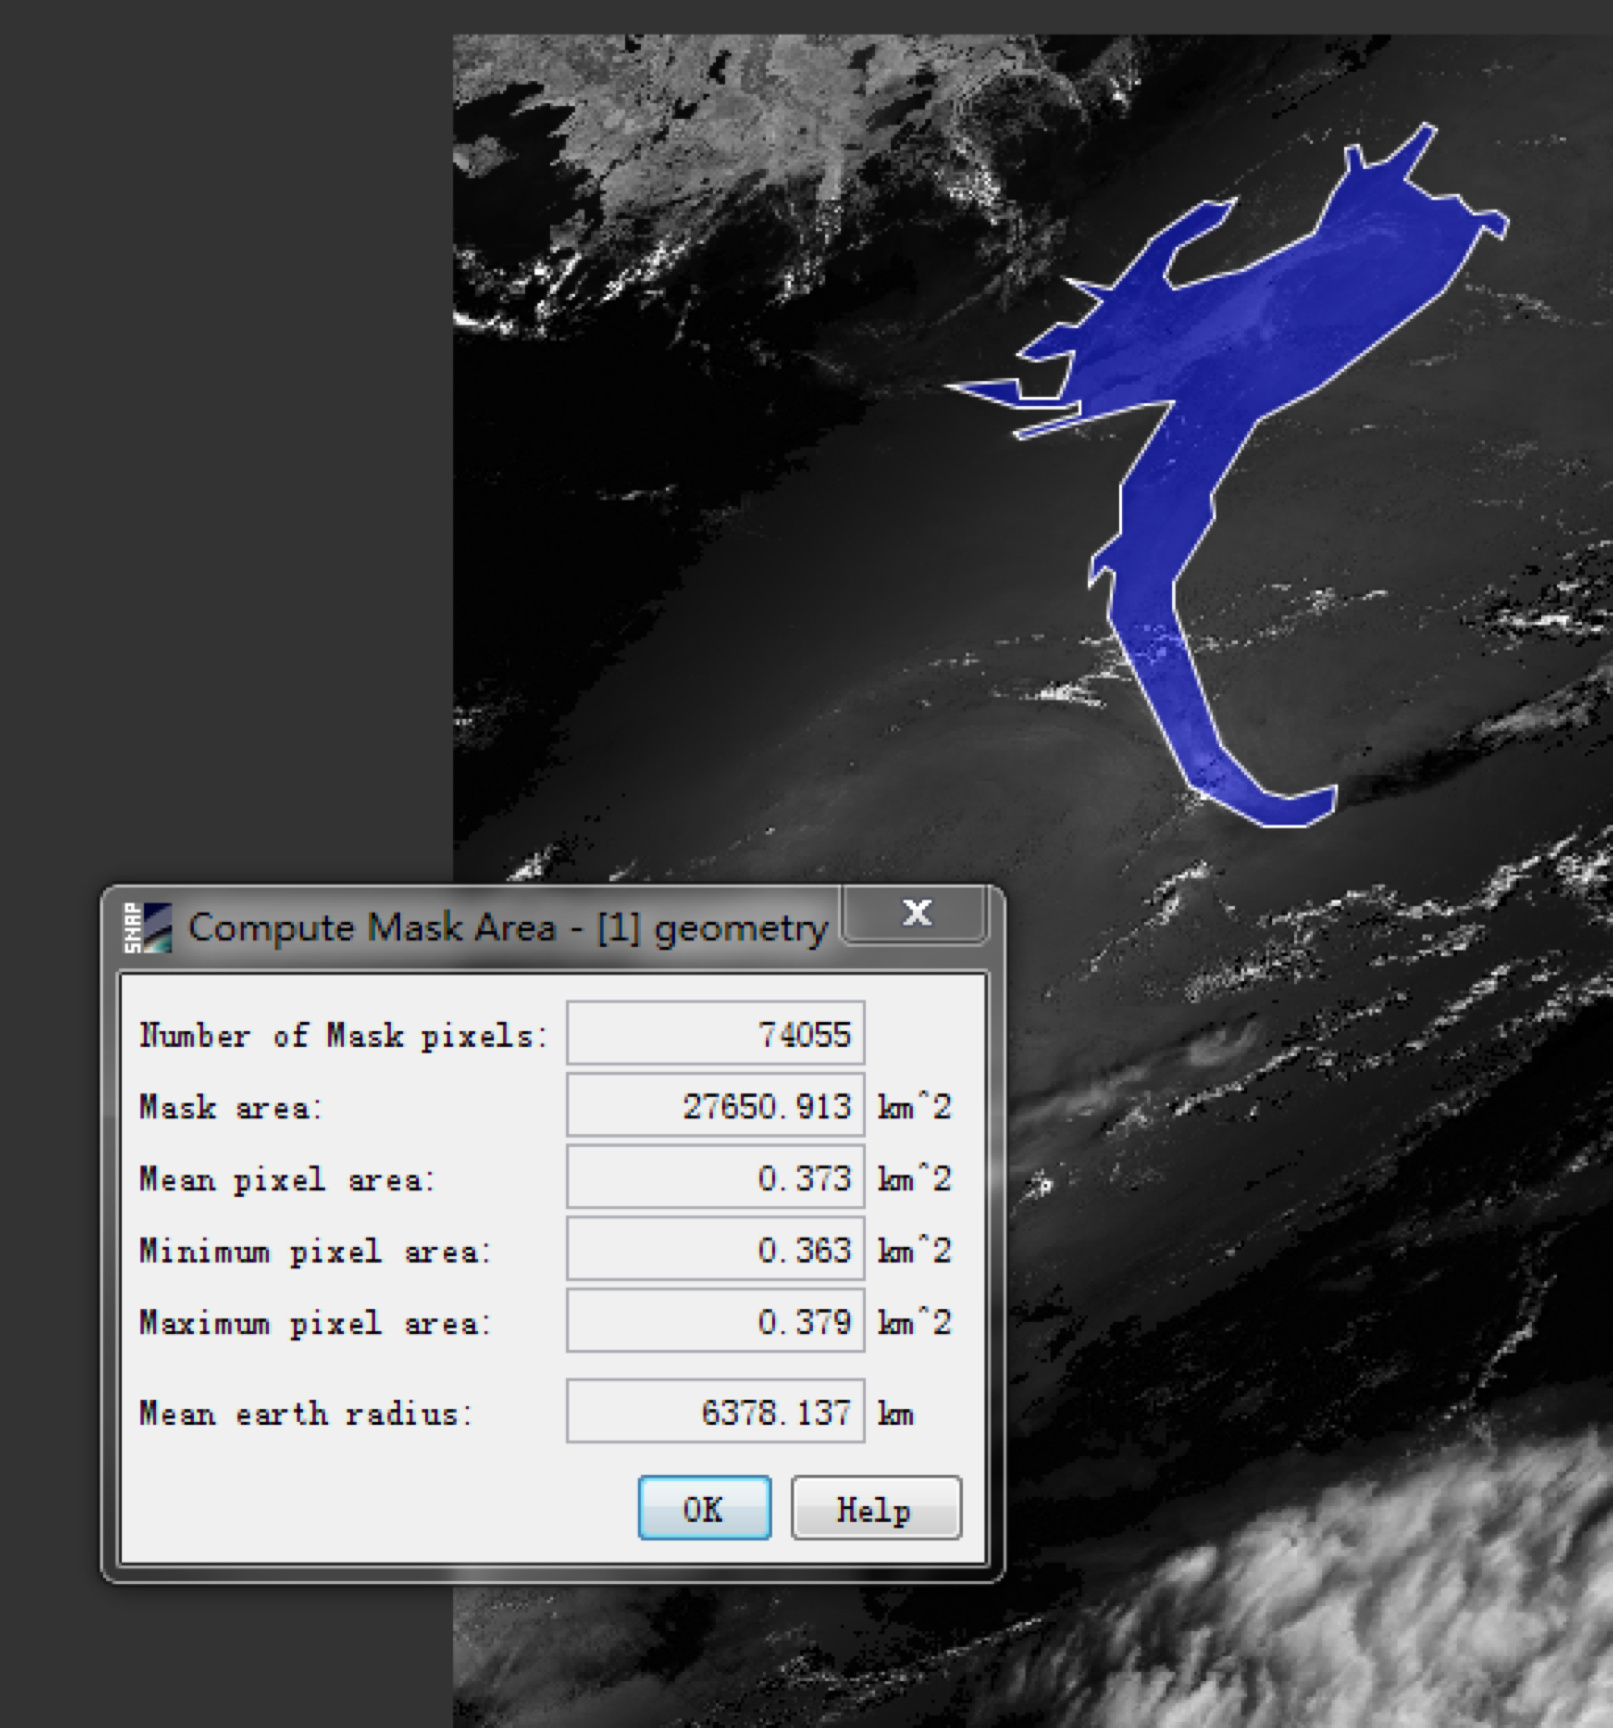
As the area result in SNAP is about twice as large as in the result from Clark, I think that there may be something wrong when SNAP was handling the data.
I have been able to reproduce the high value.
I’ve check the area calculation at a different location with MODIS and with a different sensor. In both cases the computed number is better. Maybe a bit to low.
I have created an issue for this are calculation and documented my results: https://senbox.atlassian.net/browse/SNAP-1346