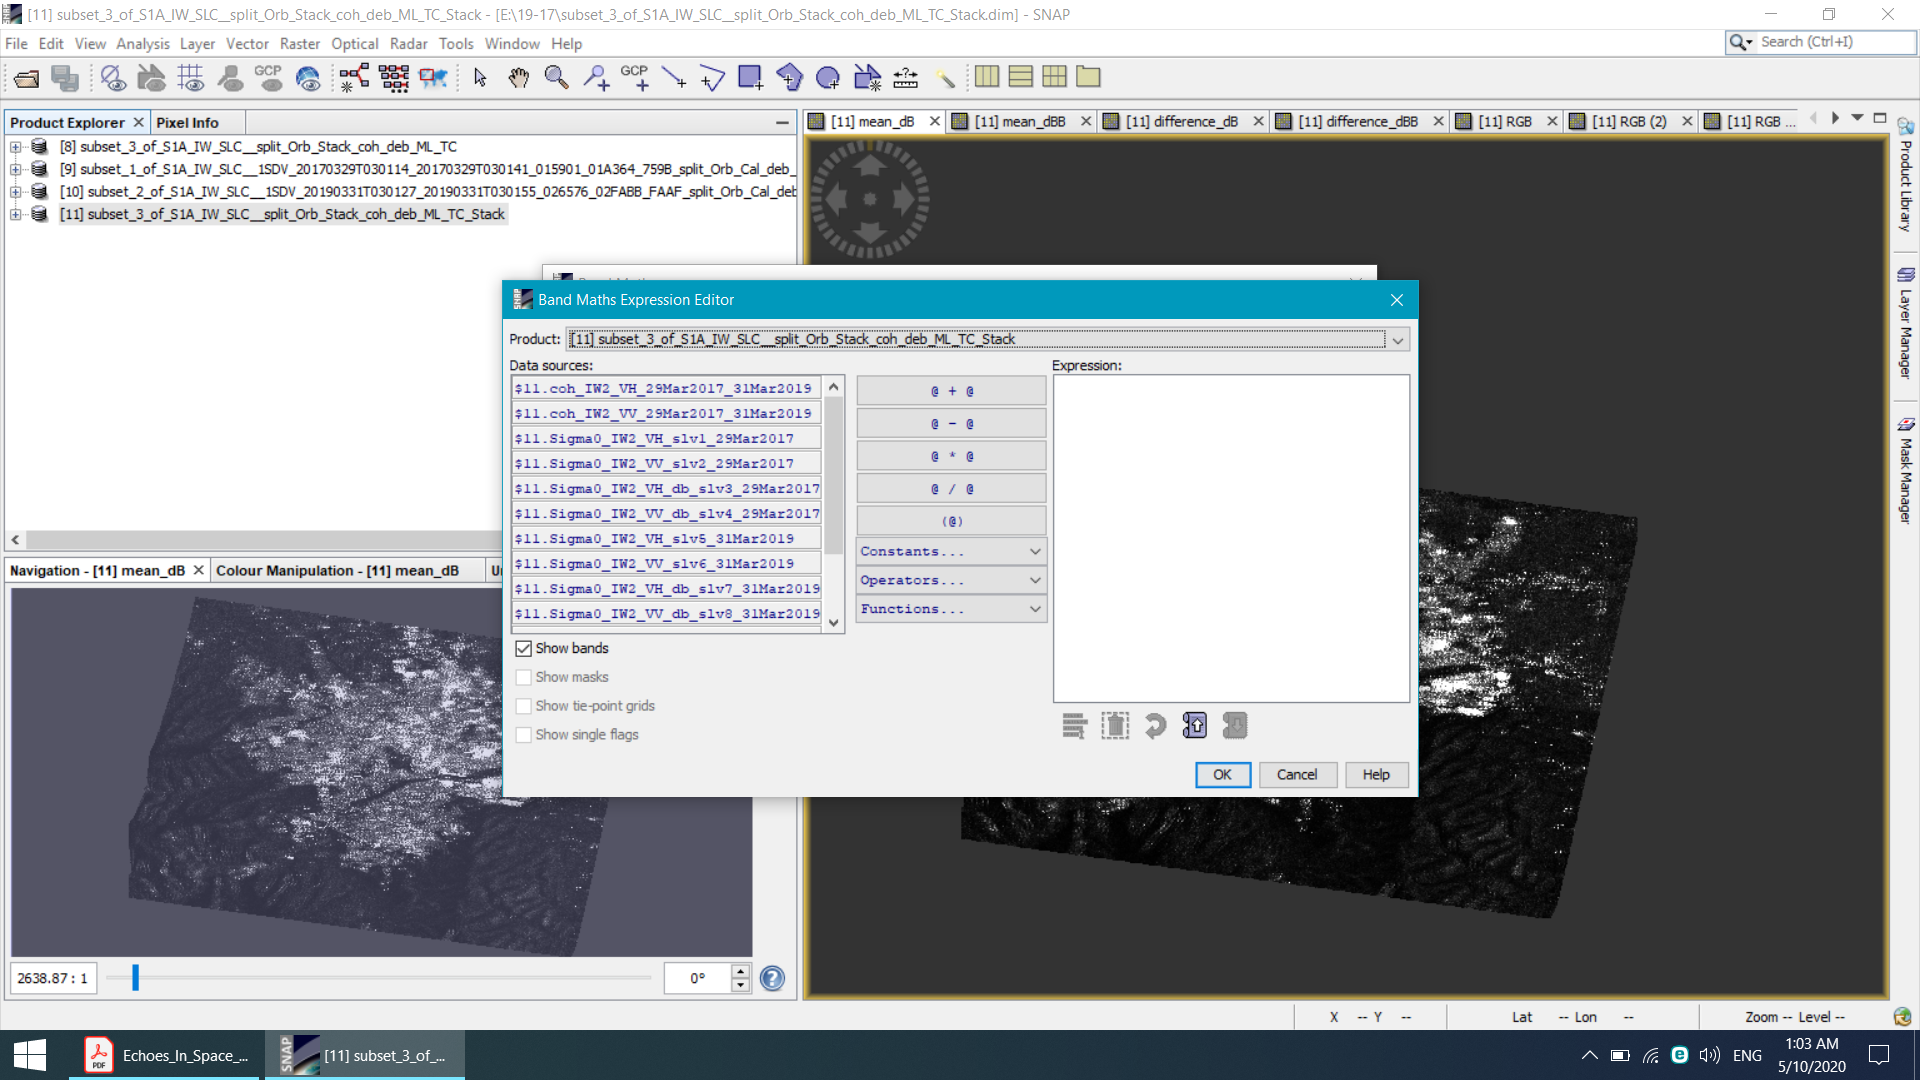
yes, you can reduce the extent of the image after deburst (step 15), but there will always be other things in the image, even in the PDF there are water bodies and mountainous areas. This is why they suggest the color composite, so the urban area is enhanced.
In your example, you have created the subset on the Split product but Deburst should be applied before that actually.
the names differ according to your data, of course. I can’t tell where the mst in your workflow went, but you can still calculate a difference.
Is there a reason why you use images of 2017 and 2019?
For good coherence you should rather combine data with 12 or 24 days inteval, as suggested in the tutorial. I also see an offset between image 1 and 2 in your image, the mean seems blurred.
The approach from the PDF is not designed for multi-temporal analysis.
In this case, you need short baseline image pair for each yeat first to compute the annual urban area and then compare these in a second step.
Hi professor,if you remind my project (if you don’t our conversations is in hand) I’ve finished the steps four in three times :
First:2017-2018
Second:2017-2019
Third:2017-2020
Now I’ve three as image consists of buildings
I wanna calculate the Changs with “and” , “or”
And find these areas:
1-the area that aren’t residential(not now not before)
2-the area that weren’t residential but now are residential
3-the area that were residential but now have been destroyed
4-the area have been residential and now are too,
Binary_img.rar (96.5 KB)
I think one of my image(17_18) there is problem in it,
in 17-20 and 17-19 image the building should be more than 17_18 image
17-20>17-19>17_18
but compare 17_18 image with another two images you’ll see what is my meant,
it should’not be this way ,what you think about it, what’s the problem?
any inaccuracies in the binary images will be inducing problems for the pairwise comparison.
You can create an RGB to see all three images at once and check if the results are plausible.
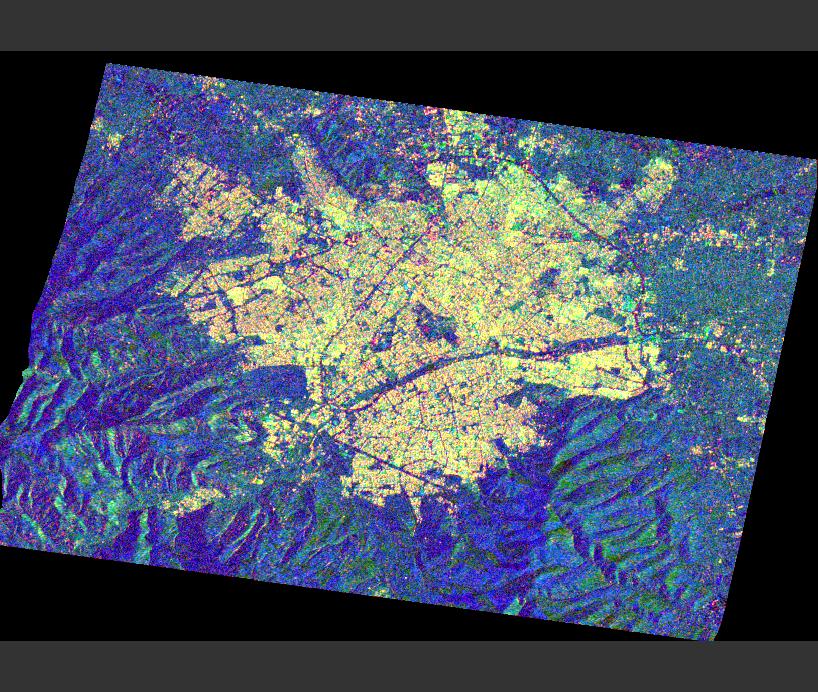
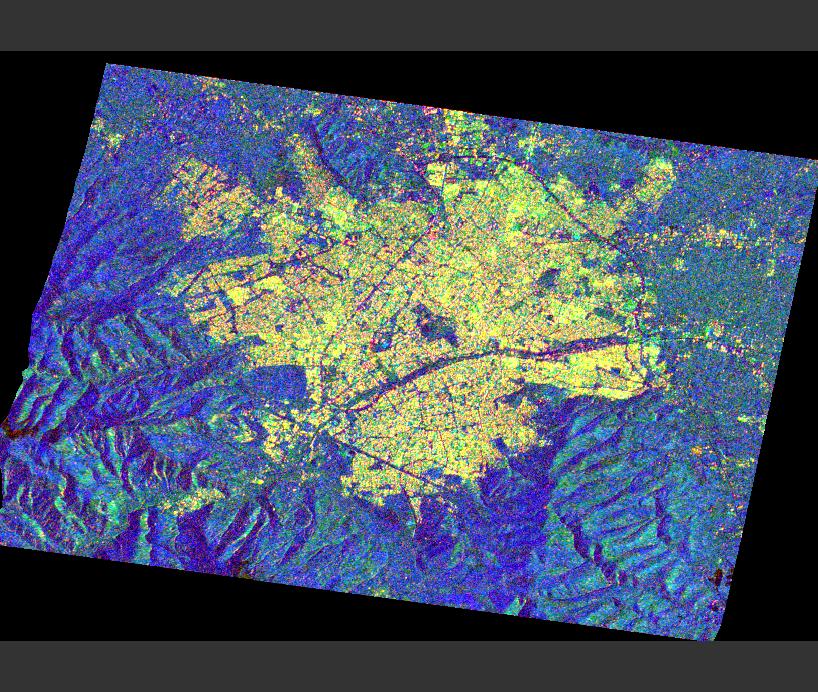
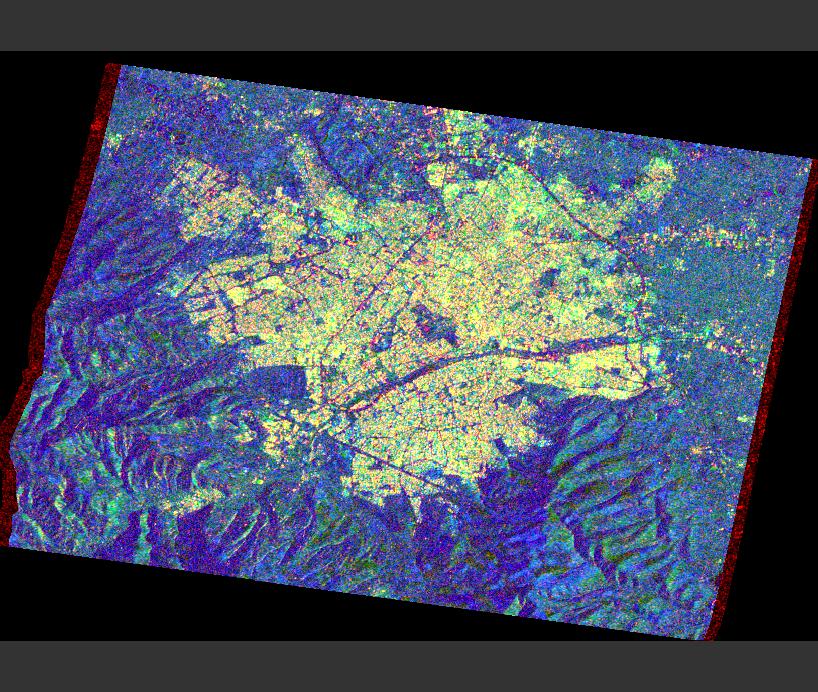
in this file there are the three RGB images,
the way i see i think the building in 17-18 image are more than another two images
let me ask your opinion
Easily I’ll say you,
If you see the 17-18 binary image the building in the image are so much relatively to 17-19 and 17_20 image,
Is this not unreasonable???