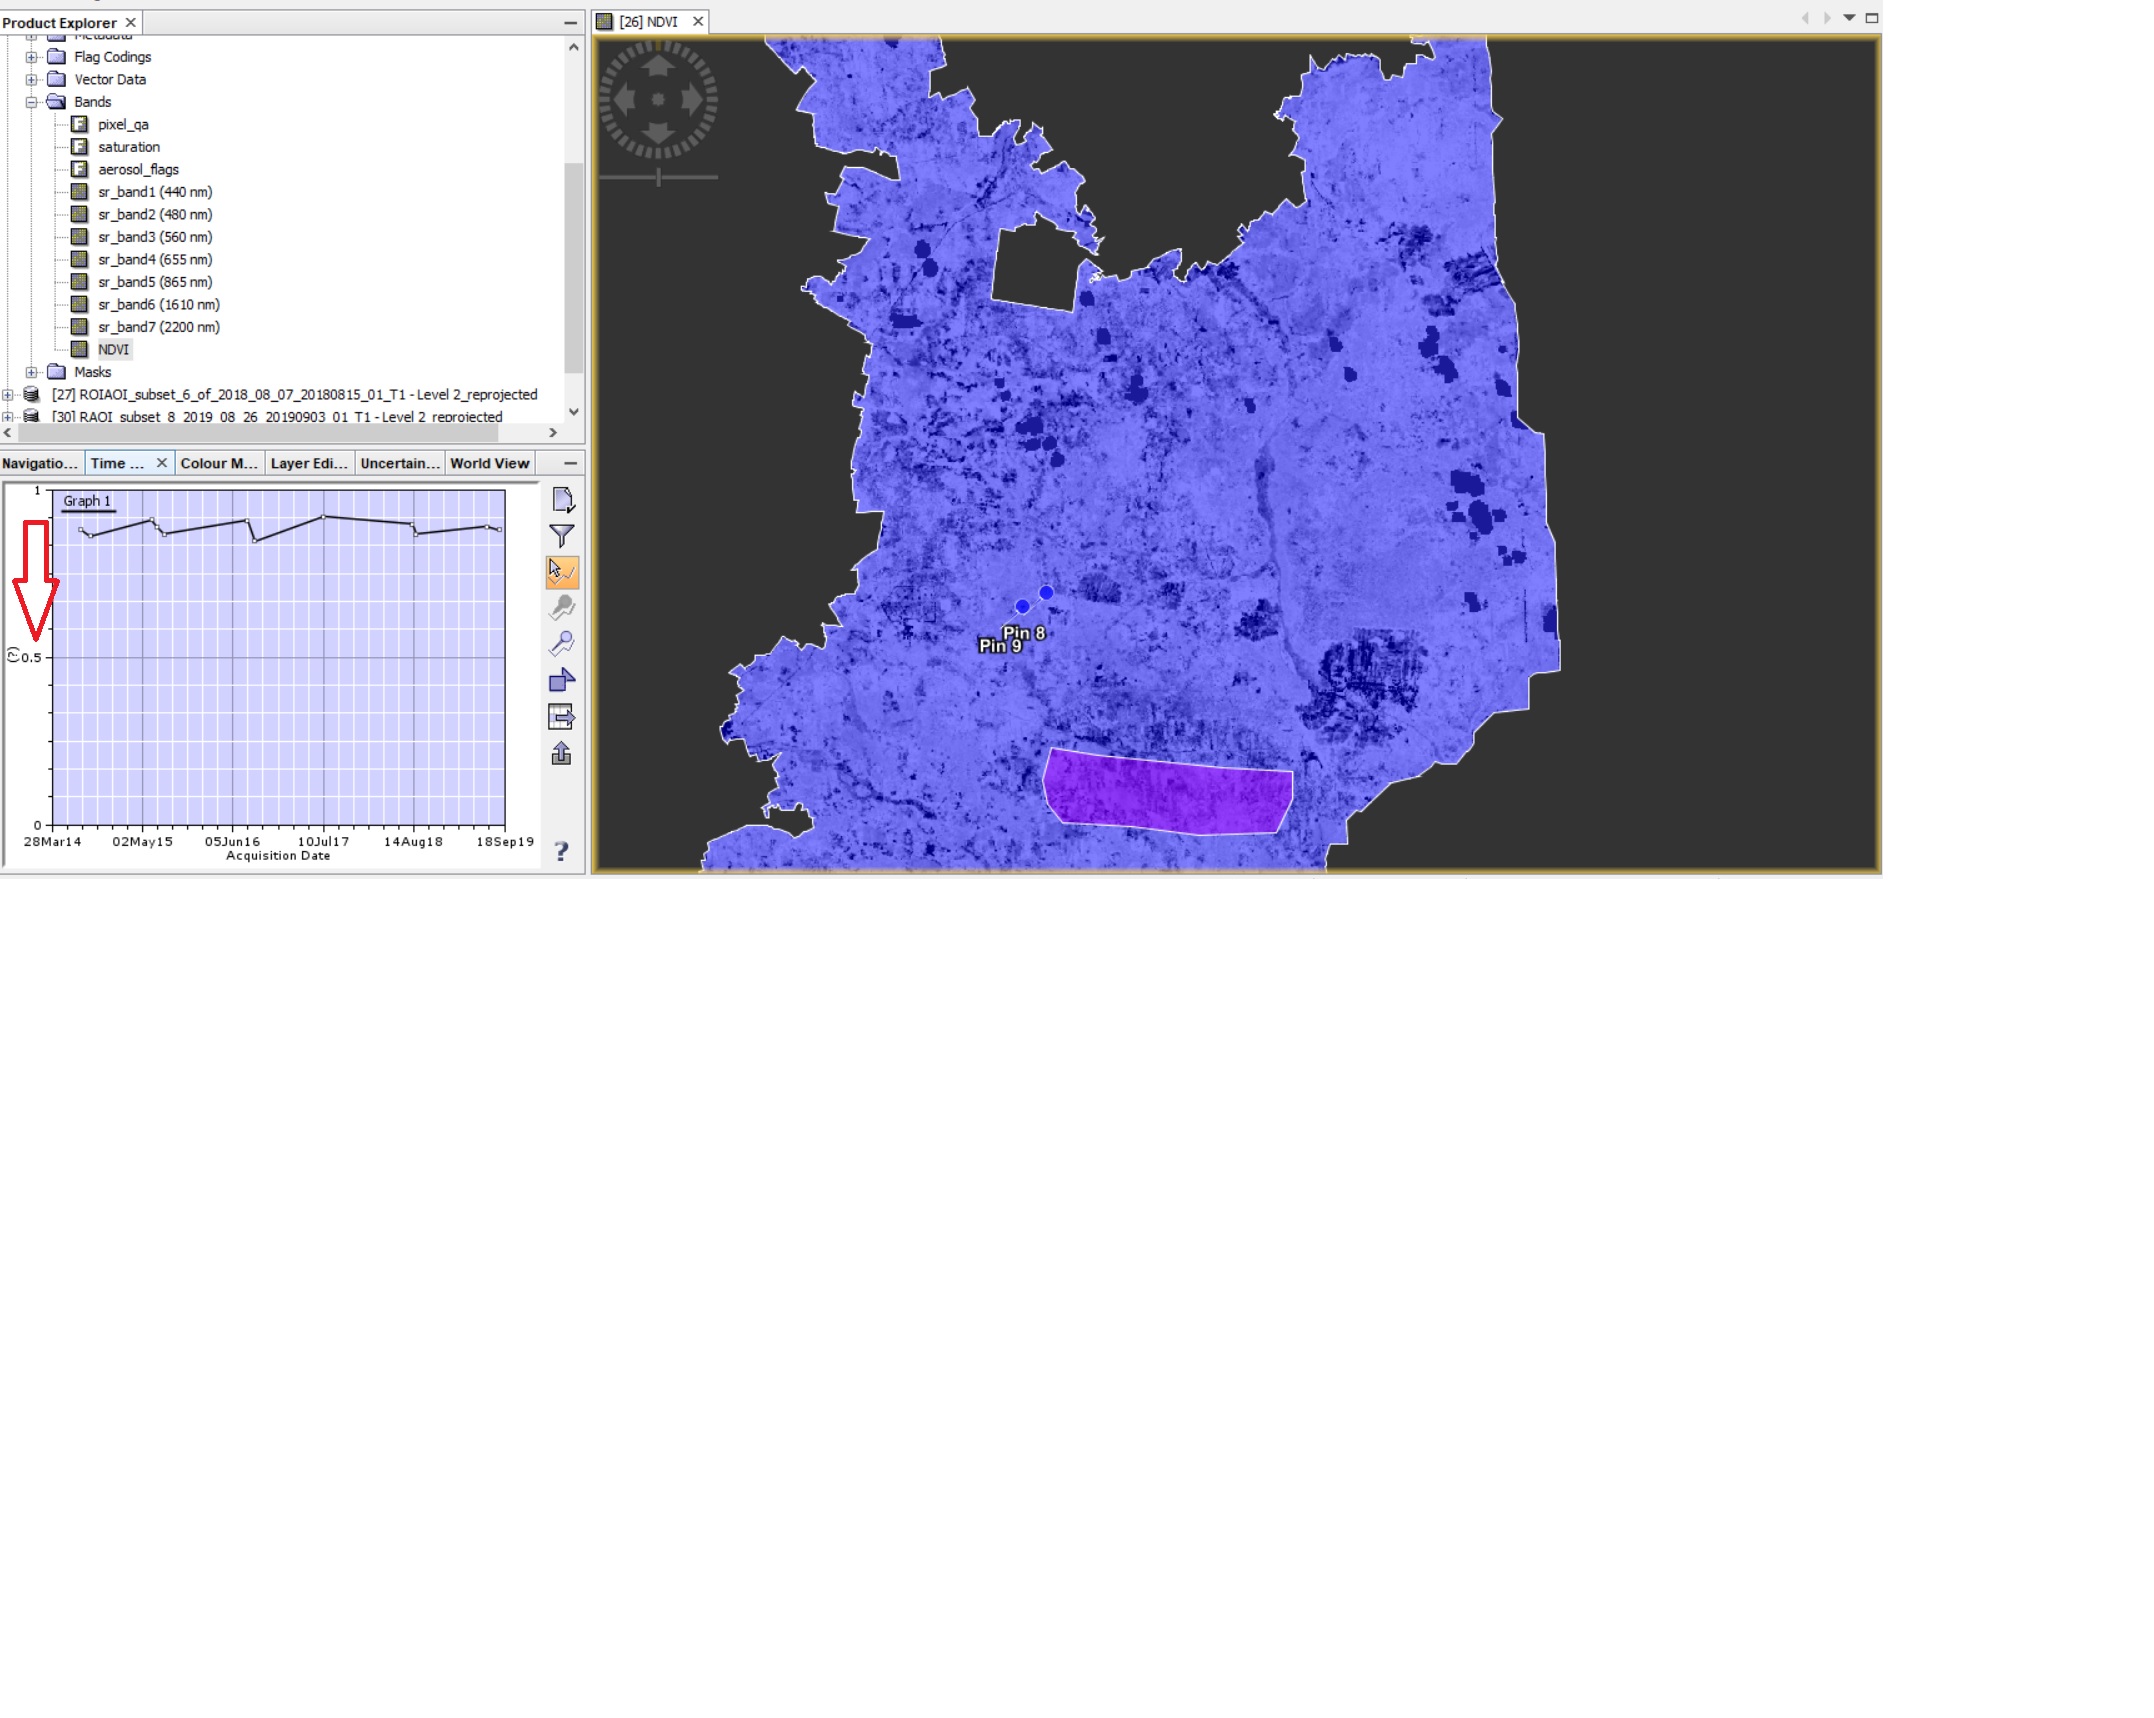
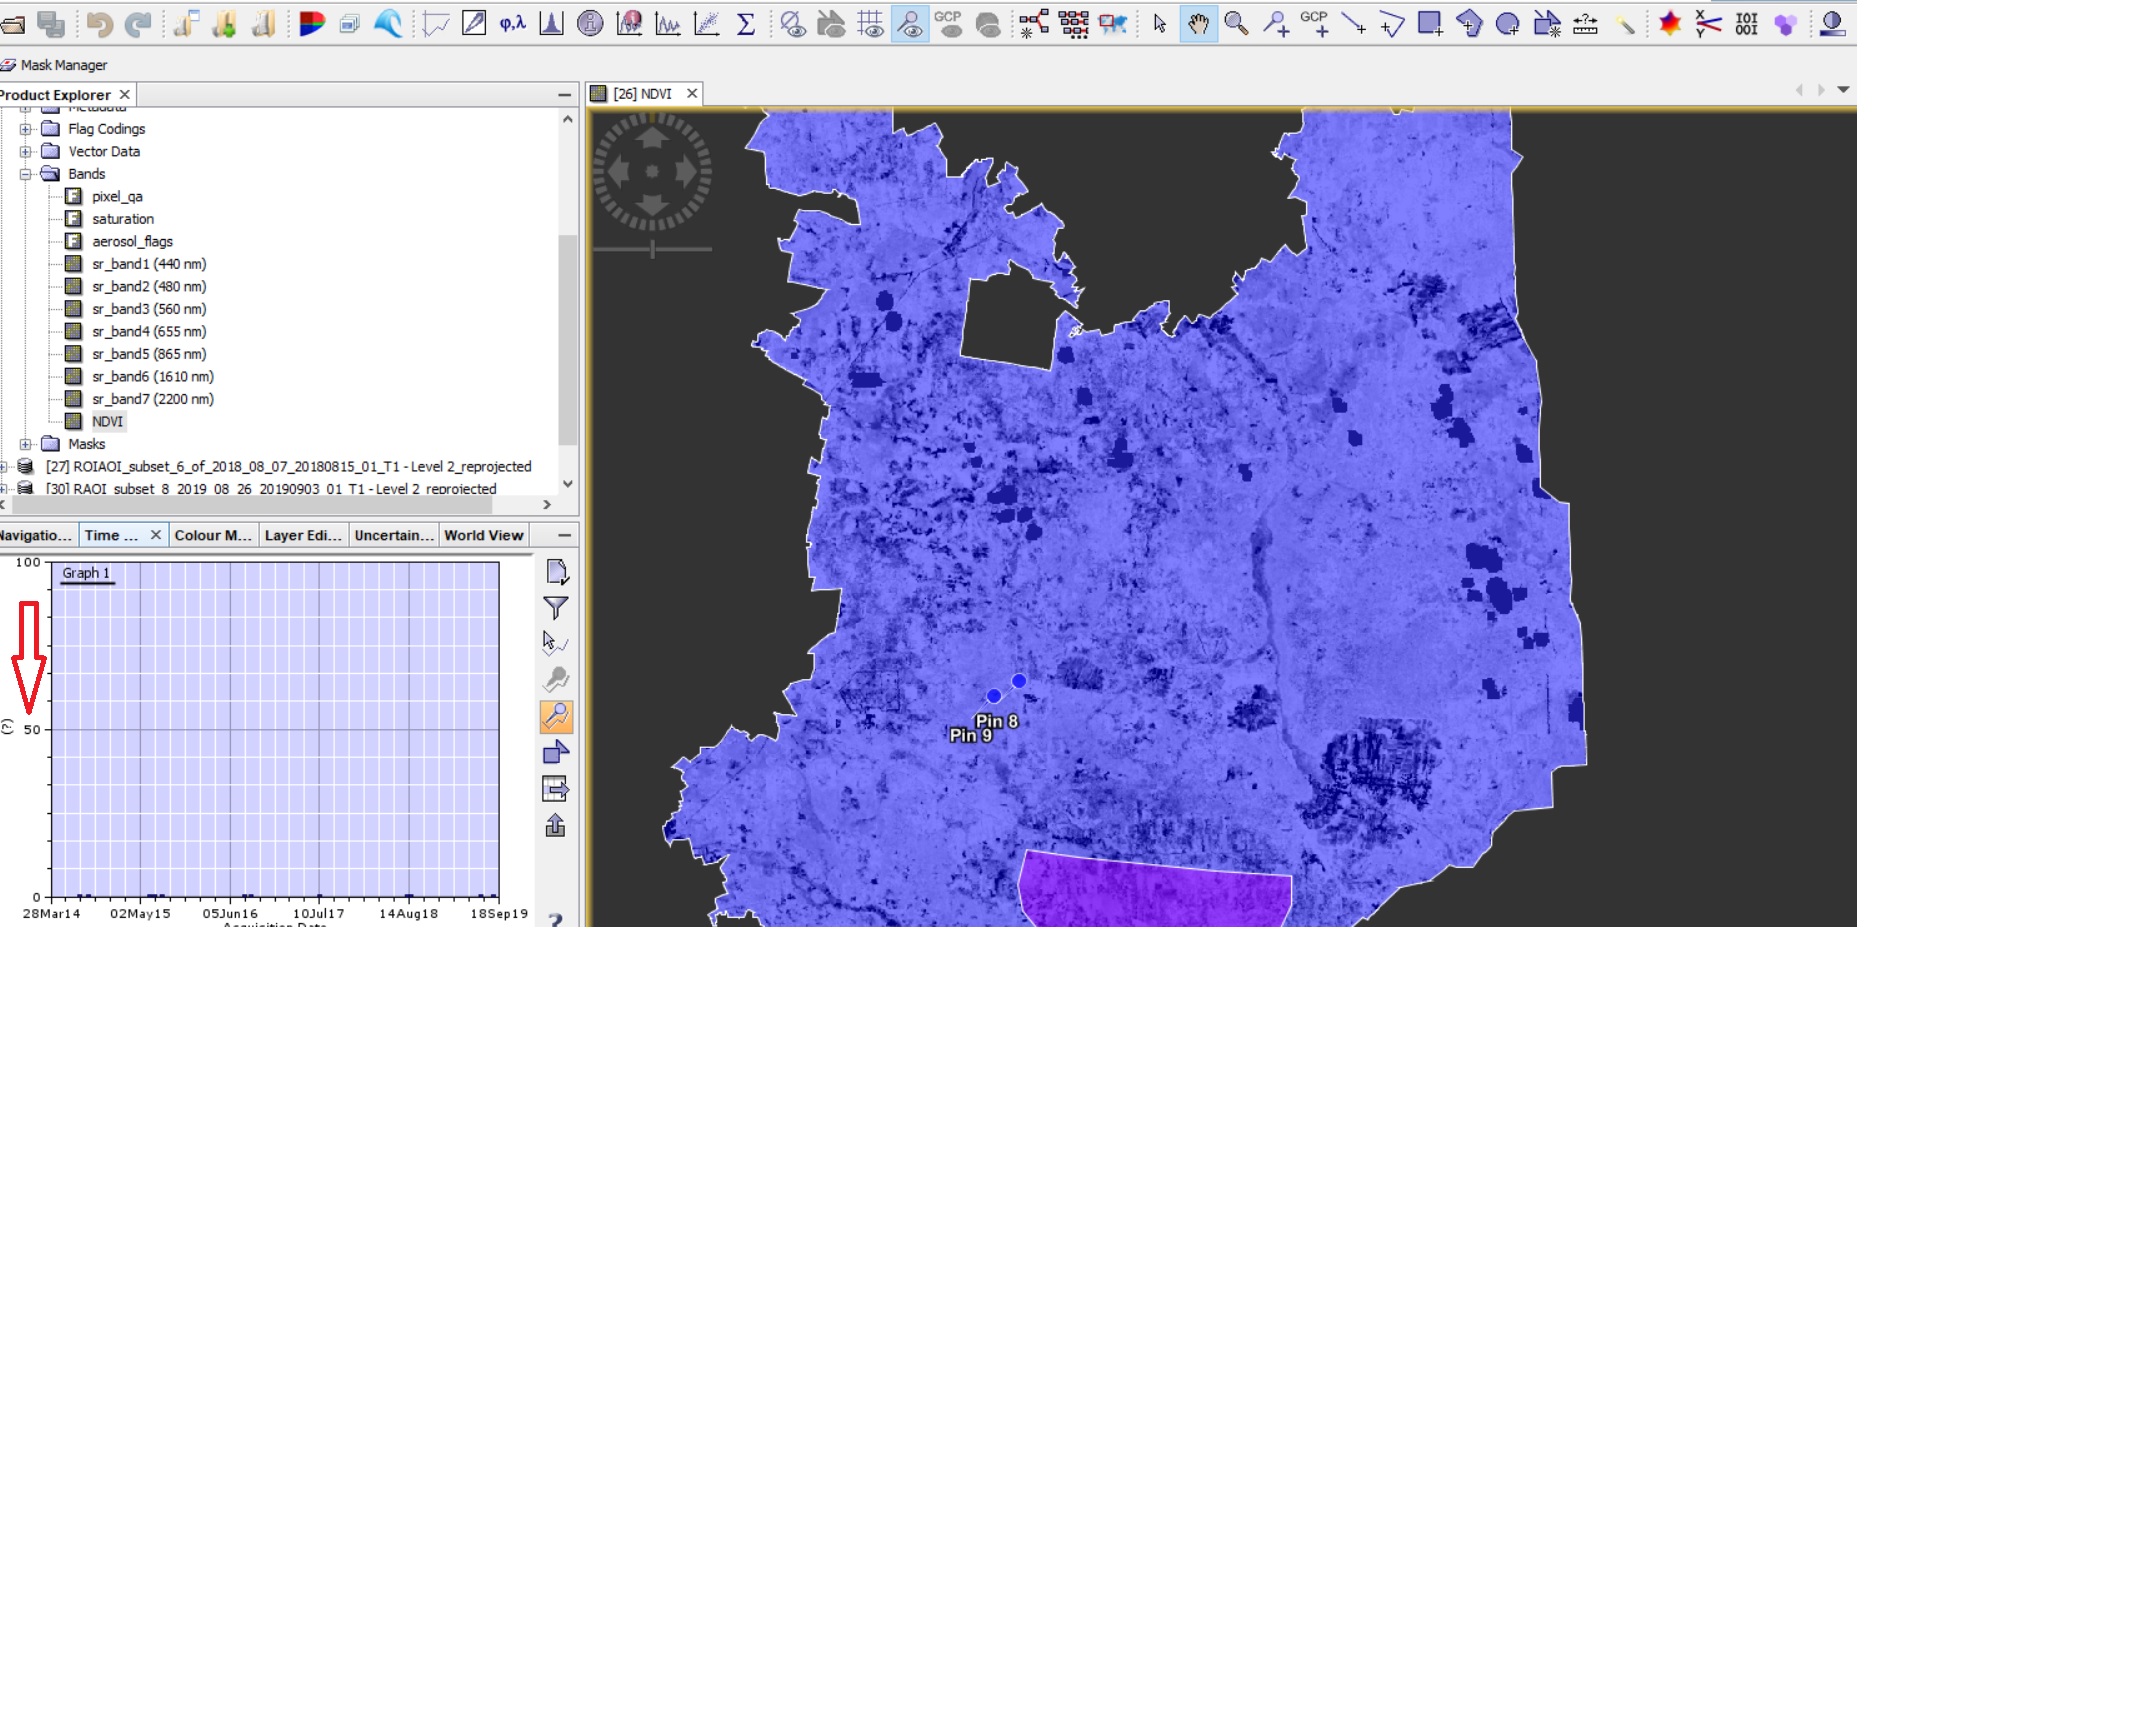
Update: Unfortunately problem is not fixed. After reprojection time series graph is created but only for “at the cursor position” option. There is no graph for ROI nor for pins. Also the y axis change.