Hello!
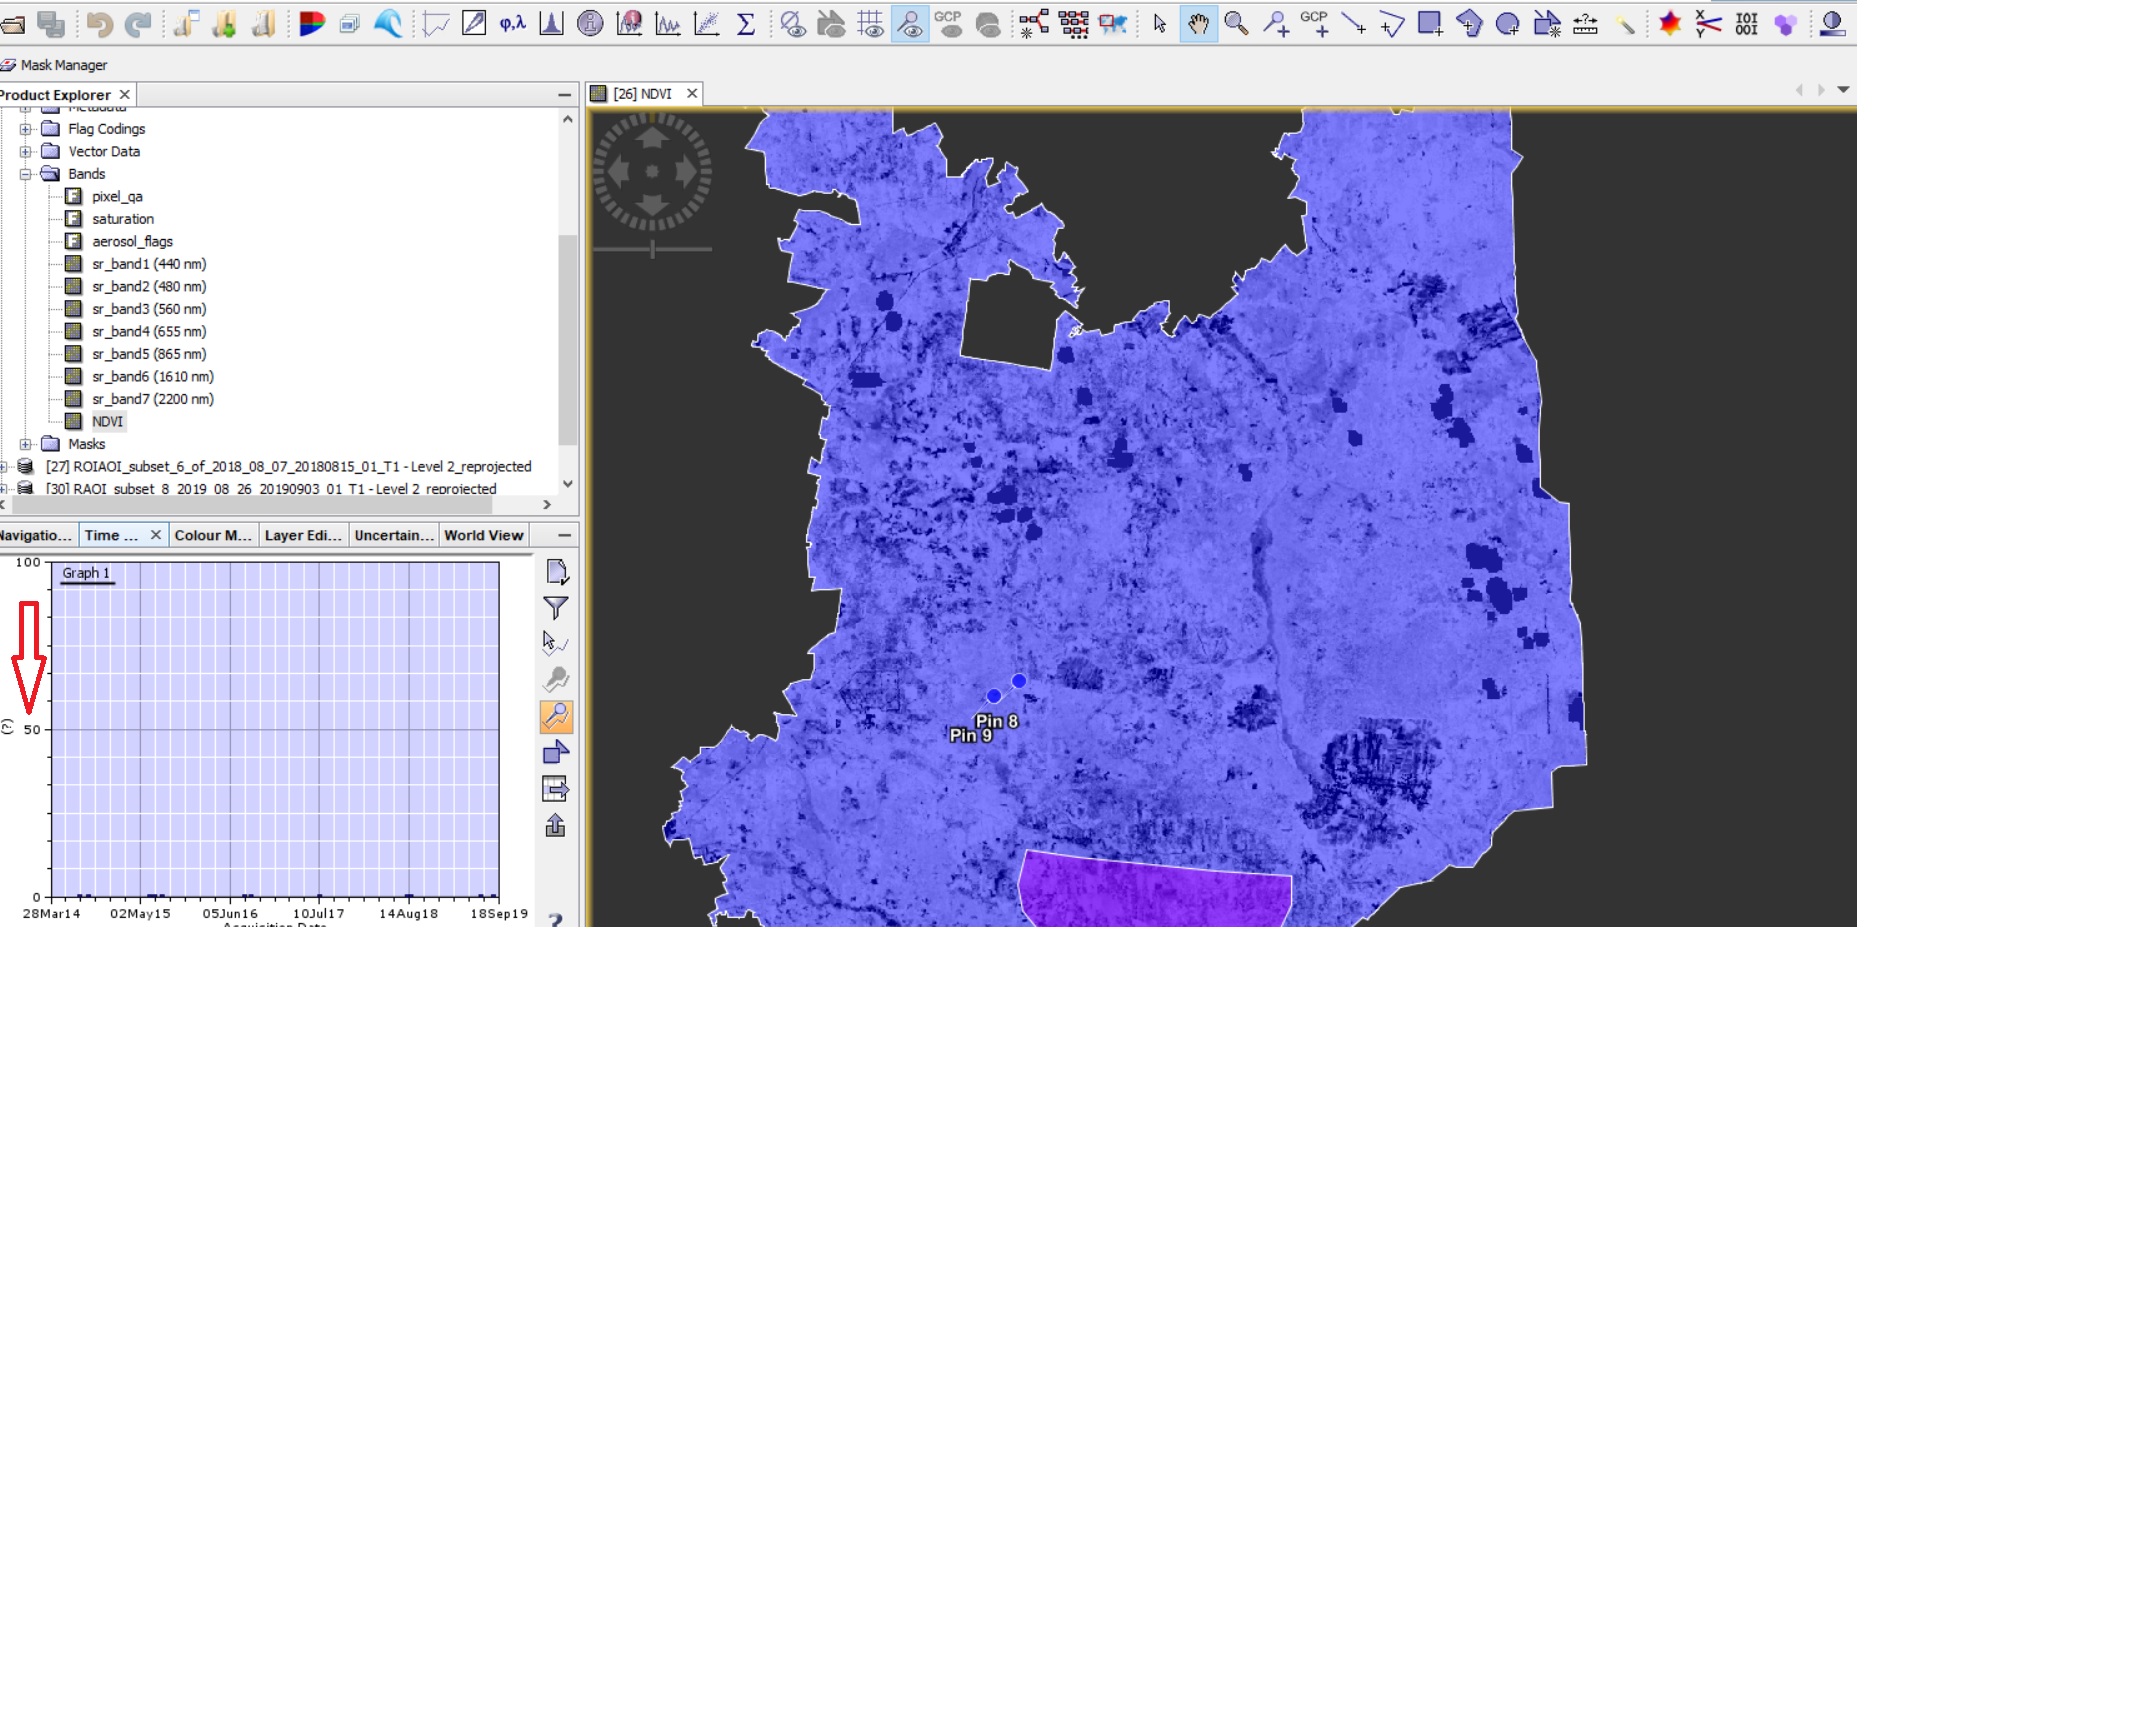
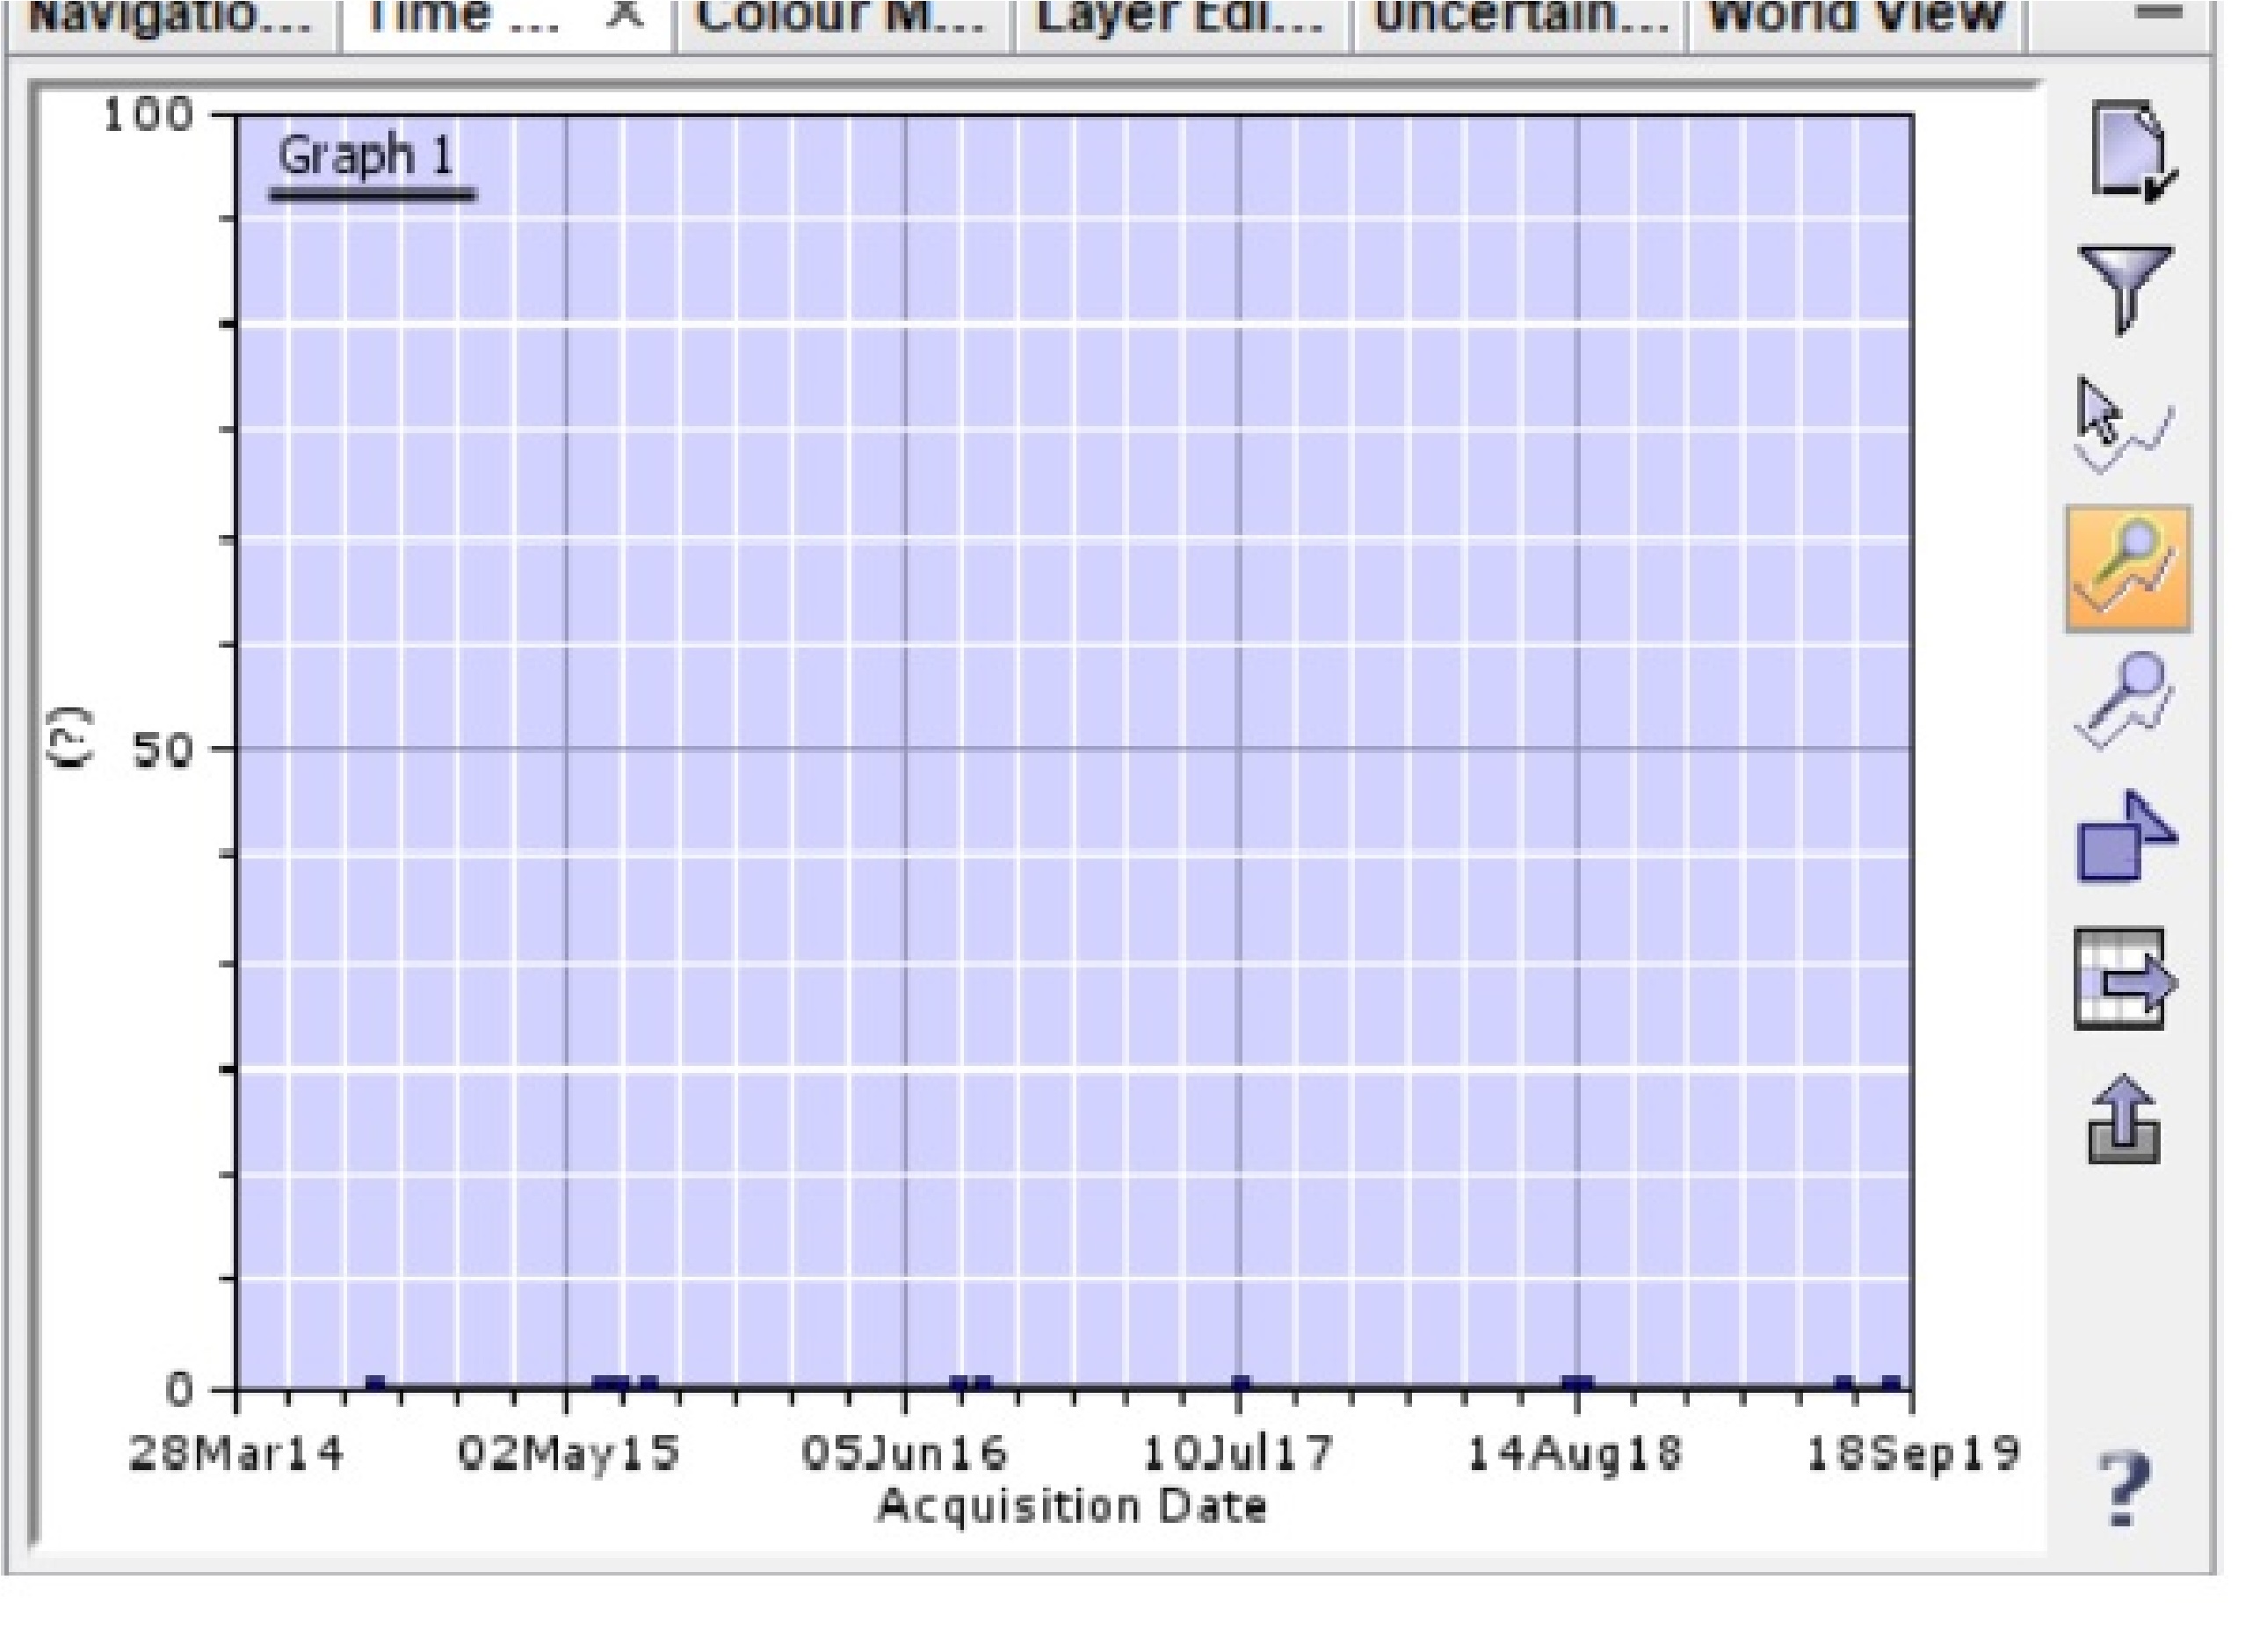
I want to compere NDVI values from several Landsat scenes. I added all the products to the Time series tool but there are no lines on the graph, only small squares. What can be the cause of this? 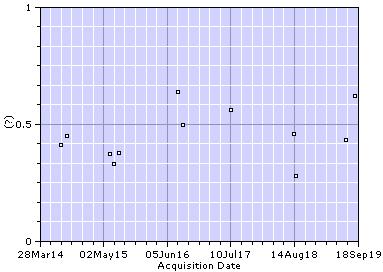
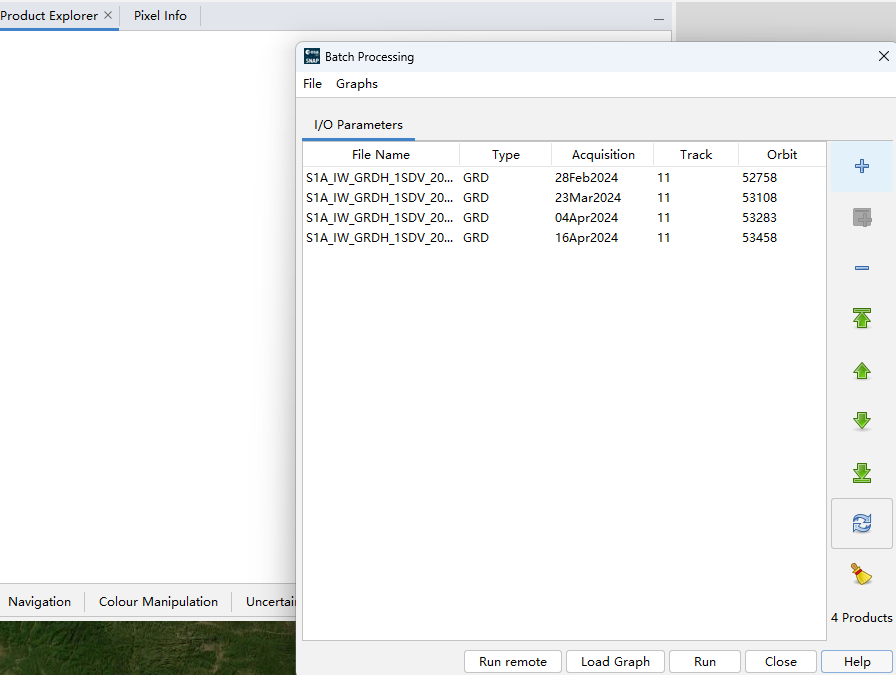
did you enter single images or a stack to the time-series tool?
Single images
Did you follow these steps? Time Series (Temporal) of NDVI (besides the manual calculation of the VI)
I manged to fix the problem. It think it was caused by projection errors (some scenes were slightly off). I used “reprojection” option and now Time series is working fine. Thank you for your advice.
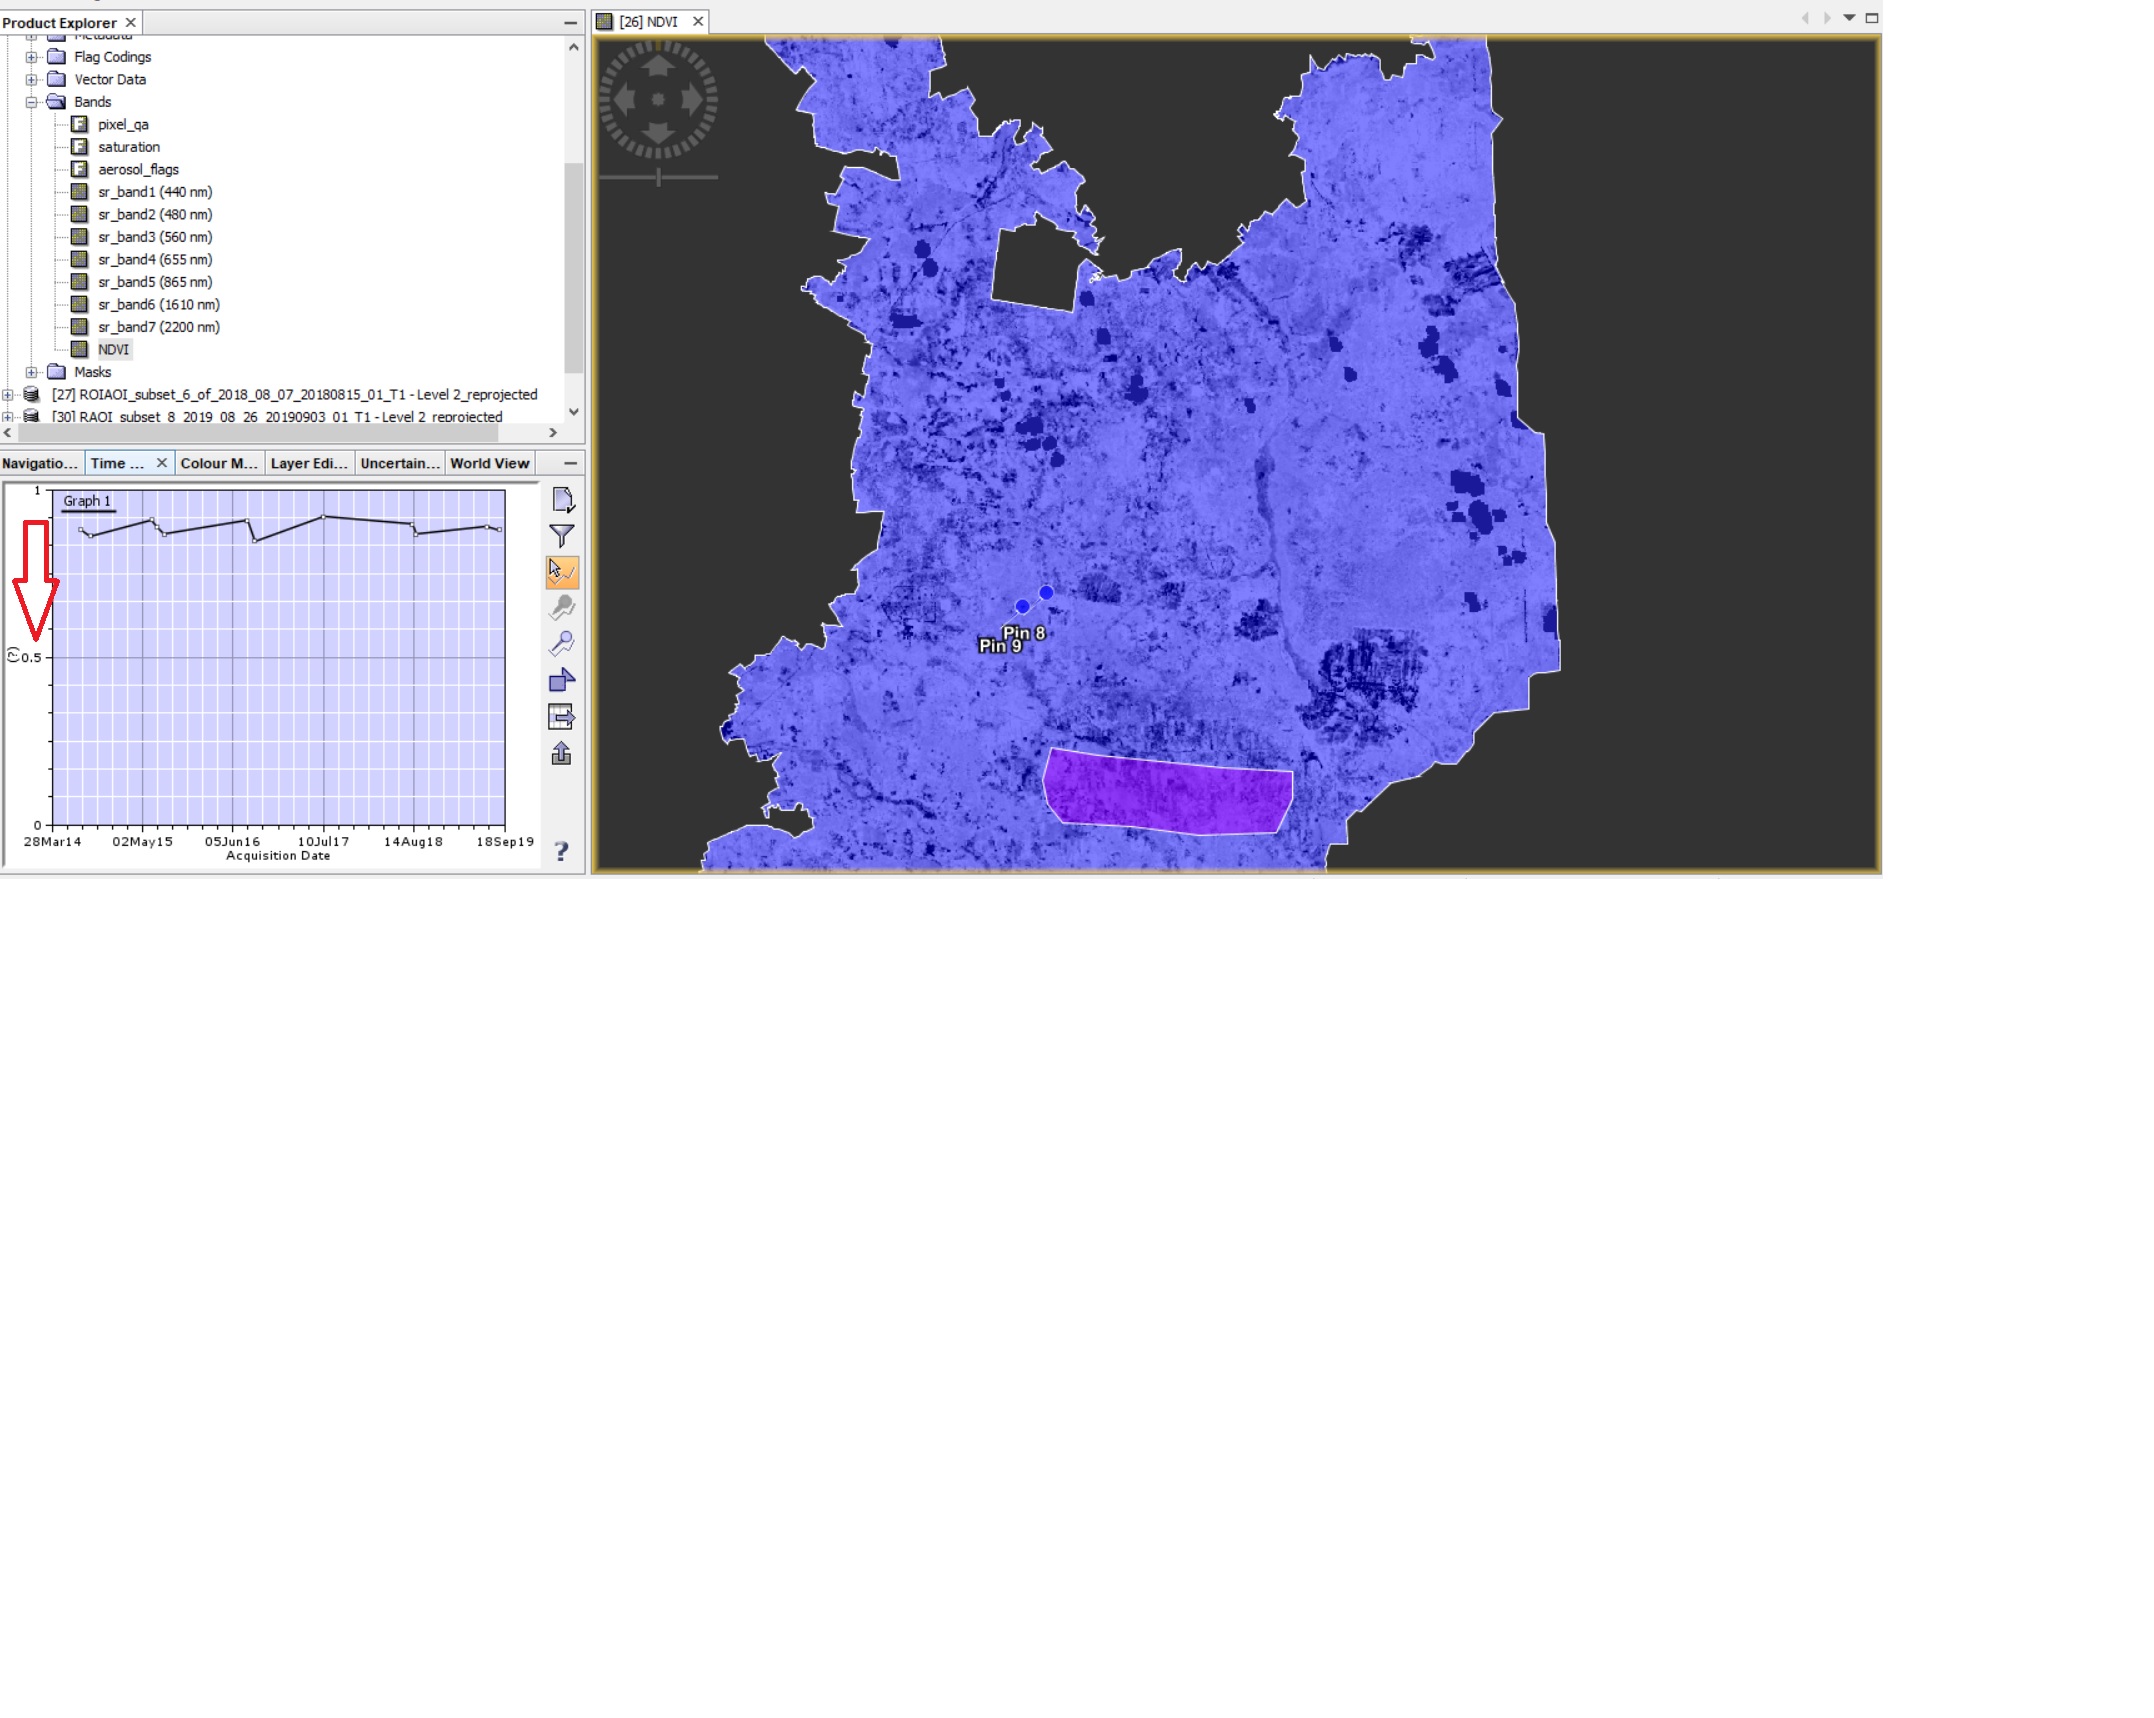
Update: Unfortunately problem is not fixed. After reprojection time series graph is created but only for “at the cursor position” option. There is no graph for ROI nor for pins. Also the y axis change.
Did you select the pins in the Pin Manager?
Please carefully follow all steps of this new tutorial: Time-series analysis with Sentinel-1
When the pins are selected in Pin Manager, small squares appear on the botom of the graph but there is no line.
can you select a common raster band with the filter symbol?