Time Series (Temporal) of NDVI

ok :+1:

now it worked. Thank you. :+1:

How did you calculate the NDVI?
Does the metadta re-appear when you enter the start/stop time according to the requested format?
The exact hour and minutes should not matter for the time series tool but the full time must be entered in a correct format, e.g.:

16-AUG-2018 08:05:55.000000
16-AUG-2018 08:05:59.000000

Save the product (File > Save) and open the time-series tool again to see if the date is back. If yes, you can do the same with the other rasters.

I tried with the 4-first maps. I added the date manually and saved the images. Now the images have date as it can be seen from the properties…

However in the time-series tool it keeps showing the wrong date for all of them: 01 Jan 2000… and therefore the time-series is not shown…

image

image

did you calculate the NDVI with the biophysical parameters tool or in the band maths?

I tried both. These last version I calculated using band maths. (Before I used the option Optical/Thematic land processing/vegetation radiometric indices. In both cases I got the same problem.

I cannot understand this. I tried it myself with the following steps and it works:
@PiriReis: If you follow these steps, it works.

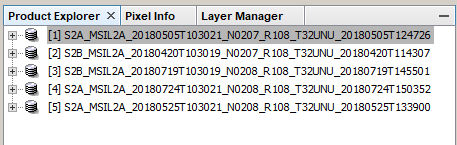
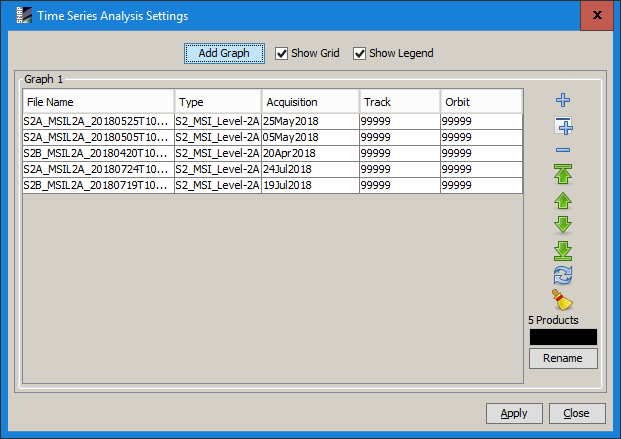
  1. Open 5 S2 images in SNAP
    grafik

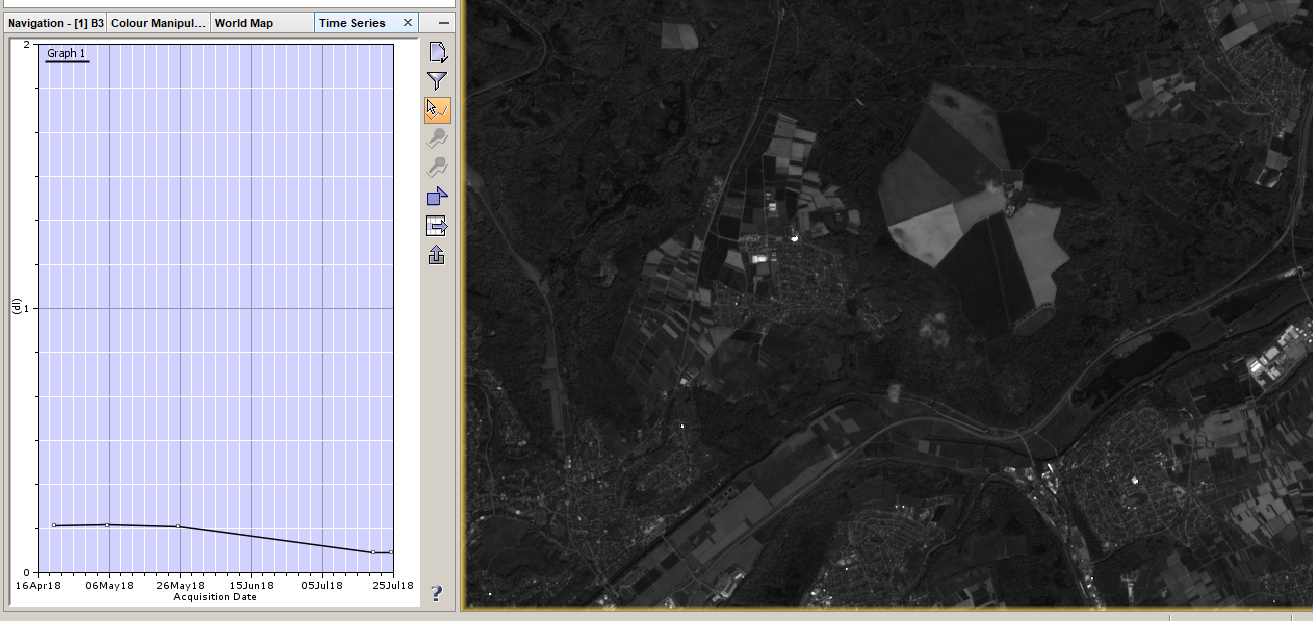
  2. Test the time-series tool for band 3
    grafik

  3. it works

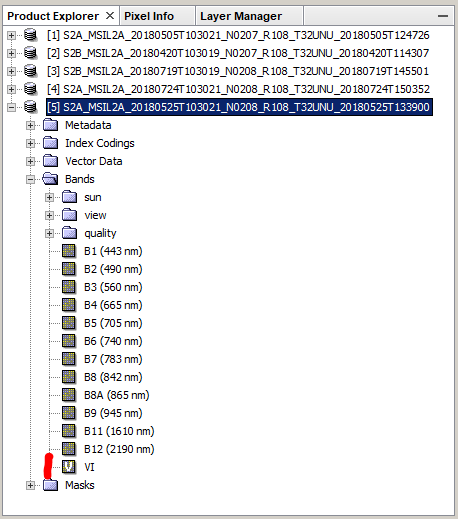
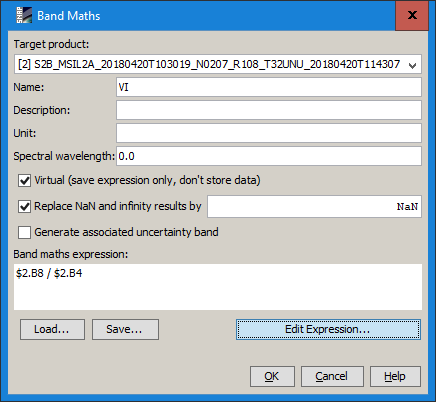
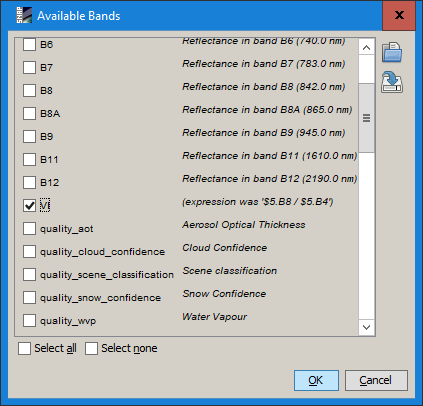
  4. Calculate index (I used the VI [NIR/Red] for the sake of simplicity) for each band
    grafik

  5. band in stack

  6. Right-click on new band and click ‘convert band’ so it becomes permanent
    grafik

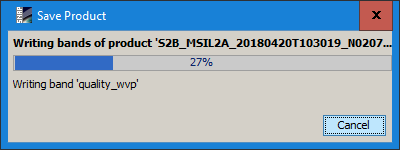
  7. Save all products (this takes time because the whole products are written into a DIMAP format)
    grafik

  8. Close all products and open again. Clear the time-series tool and insert the products again. The dates are still there.
    grafik

  9. Select the VI in the filter tab
    grafik

  10. Display VI series in the plot (note the tab says “VI” and the scale ranges from 0-30)

4 Likes

wow, that is really an easy way:

@PiriReis @chavarro This is not related to SNAP but all struggling with NDVI time-series please have a look here:

3 Likes

Yes!!! I did as you explained and now it works!
The problem was that I was creating the NDVI as independent maps and not as an extra band of the same image…it seems that it makes a difference.
Many thanks for your time and good explanations.

-A final question: what would be the best way to export ONLY de NDVI’s as GeoTIffs ??

(the Sentinel-hub EO-Browser looks fabulous)

glad to hear that it works.

Raster > Data Conversion > Band Select
Here you can define GeoTiff as an output and select the NDVI layer as a GeoTiff. But note that this will lose all metadata required for the time-series plugin.

Understood! Many thanks Andreas.

Thank you, I will try it

Hello,

I want to do classification of S1 time series images with time series “NDVI values” gathered from EO Browser.

How can I do it?

Thanks.

load all them in SNAP, create a stack, rename the bands according to the date and use this stack as the input for the classifier.

Just make sure you download them in a usable file type (NDVI requires float).

I just have NDVI values in excel format (not as images because it is not a downloadable band as shown below).

Thats why I checked the link below but dont understood how to create csv file format for my NDVI values Since I dont have lattitudes or longitudes but only have mean NDVI values of some polygons.

what do you mean about float?

float = floating point = decimal number [between -1 and +1]

I thought you had downloaded the NDVI rasters for multiple dates. If you have extracted the NDVI value at a specific location I am not sure what would be the best way to use it.

I tried your workflow many times but it didn’t work. Then I created NDVI images as below and tried again but still doesn’t show the time series. It only shows only curser when it is on. (All vector polygons are imported to all NDVI images).

Because of the problem I mentiened above, I extracted all NDVI values manually from EO Browser but I dont know how to integrate those values with my SAR images and classify together. Is there anybody have any suggestions? I have to solve this problem before weekend :frowning:

Thanks.

I don’t know how to explain it any other than above.

As an alternative you can extract the NDVI values along the time series as Pins (in the pin manager), save it as a CSV file and create the graph in MS Excel.

It is demonstrated here: Extracting single pixel information

I need mean NDVI values of polygons instead of a random pixel inside.

Any other options such as QGIS, ArcMap etc. to calculate mean NDVIs? I already have NDVI images as .img format and shape files or kml files as polygons.

I tried in QGIS as below but It doesnt display the spectral profile.

1- I imported all NDVI images as raster layer and all shape files as vector layer
2- Then I added all NDVI images as spectral layers and selected alI vectors as polygons but It doesnt work.

I think I am missing something. I need some help to calculate the my time series of mean NDVI values and download the values.

the QGIS plugin seems to be a good solution (although I don’t know it). I think it is crucial that the data is formatted in a way that the plugin can attach a date to the mean values.

Sorry, I haven’t done this outside SNAP so far.

Of the three date images which were coregistered, I am not getting one date values in the time series plot. Why is it so?