How did you calculate the NDVI?
Does the metadta re-appear when you enter the start/stop time according to the requested format?
The exact hour and minutes should not matter for the time series tool but the full time must be entered in a correct format, e.g.:
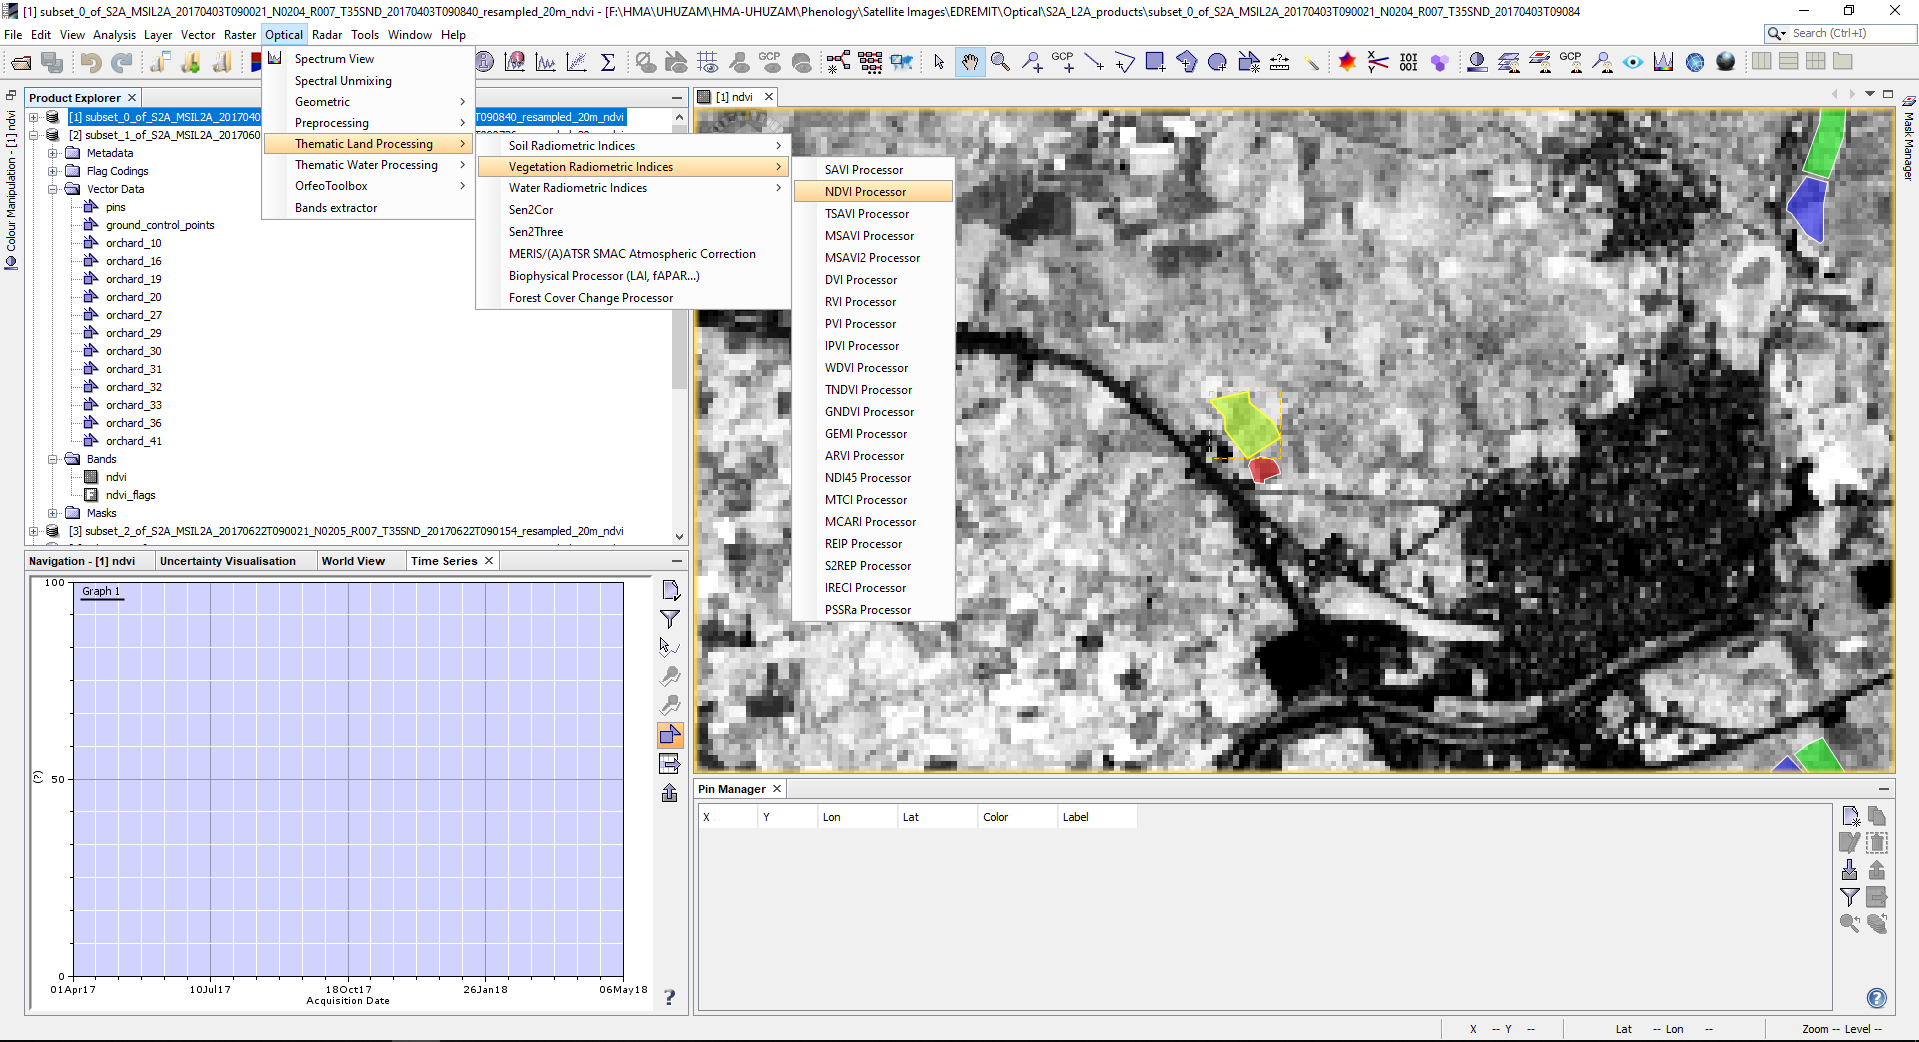
I tried both. These last version I calculated using band maths. (Before I used the option Optical/Thematic land processing/vegetation radiometric indices. In both cases I got the same problem.
Yes!!! I did as you explained and now it works!
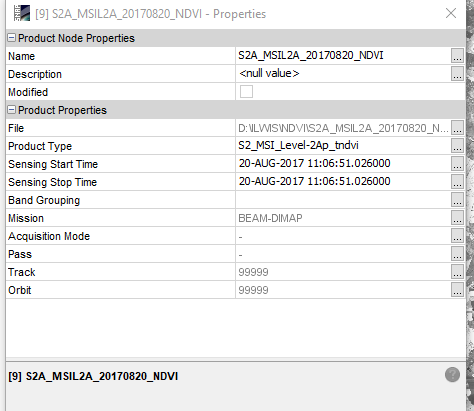
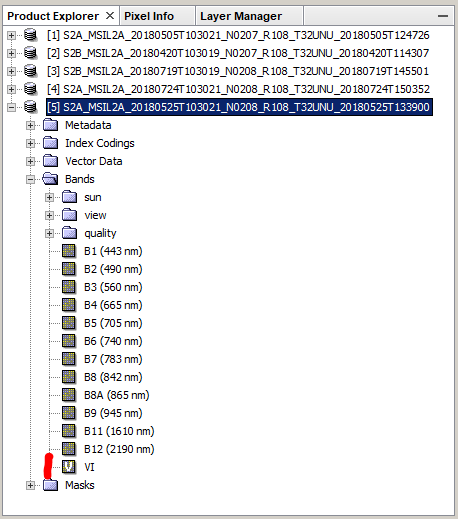
The problem was that I was creating the NDVI as independent maps and not as an extra band of the same image…it seems that it makes a difference.
Many thanks for your time and good explanations.
-A final question: what would be the best way to export ONLY de NDVI’s as GeoTIffs ??
Raster > Data Conversion > Band Select
Here you can define GeoTiff as an output and select the NDVI layer as a GeoTiff. But note that this will lose all metadata required for the time-series plugin.
Thats why I checked the link below but dont understood how to create csv file format for my NDVI values Since I dont have lattitudes or longitudes but only have mean NDVI values of some polygons.
float = floating point = decimal number [between -1 and +1]
I thought you had downloaded the NDVI rasters for multiple dates. If you have extracted the NDVI value at a specific location I am not sure what would be the best way to use it.
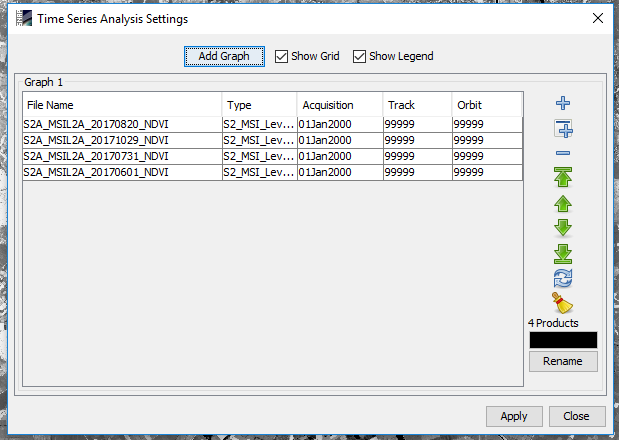
I tried your workflow many times but it didn’t work. Then I created NDVI images as below and tried again but still doesn’t show the time series. It only shows only curser when it is on. (All vector polygons are imported to all NDVI images).
Because of the problem I mentiened above, I extracted all NDVI values manually from EO Browser but I dont know how to integrate those values with my SAR images and classify together. Is there anybody have any suggestions? I have to solve this problem before weekend
I don’t know how to explain it any other than above.
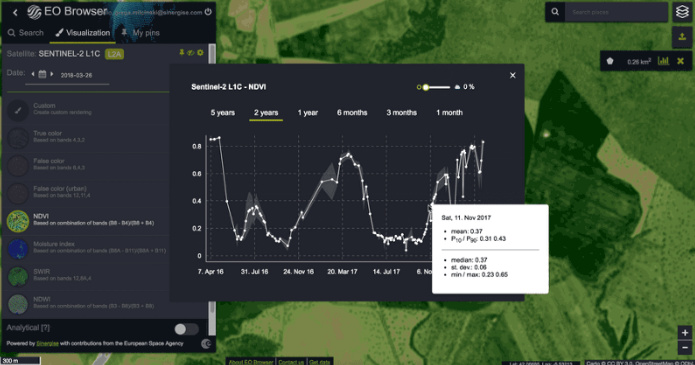
As an alternative you can extract the NDVI values along the time series as Pins (in the pin manager), save it as a CSV file and create the graph in MS Excel.
I need mean NDVI values of polygons instead of a random pixel inside.
Any other options such as QGIS, ArcMap etc. to calculate mean NDVIs? I already have NDVI images as .img format and shape files or kml files as polygons.
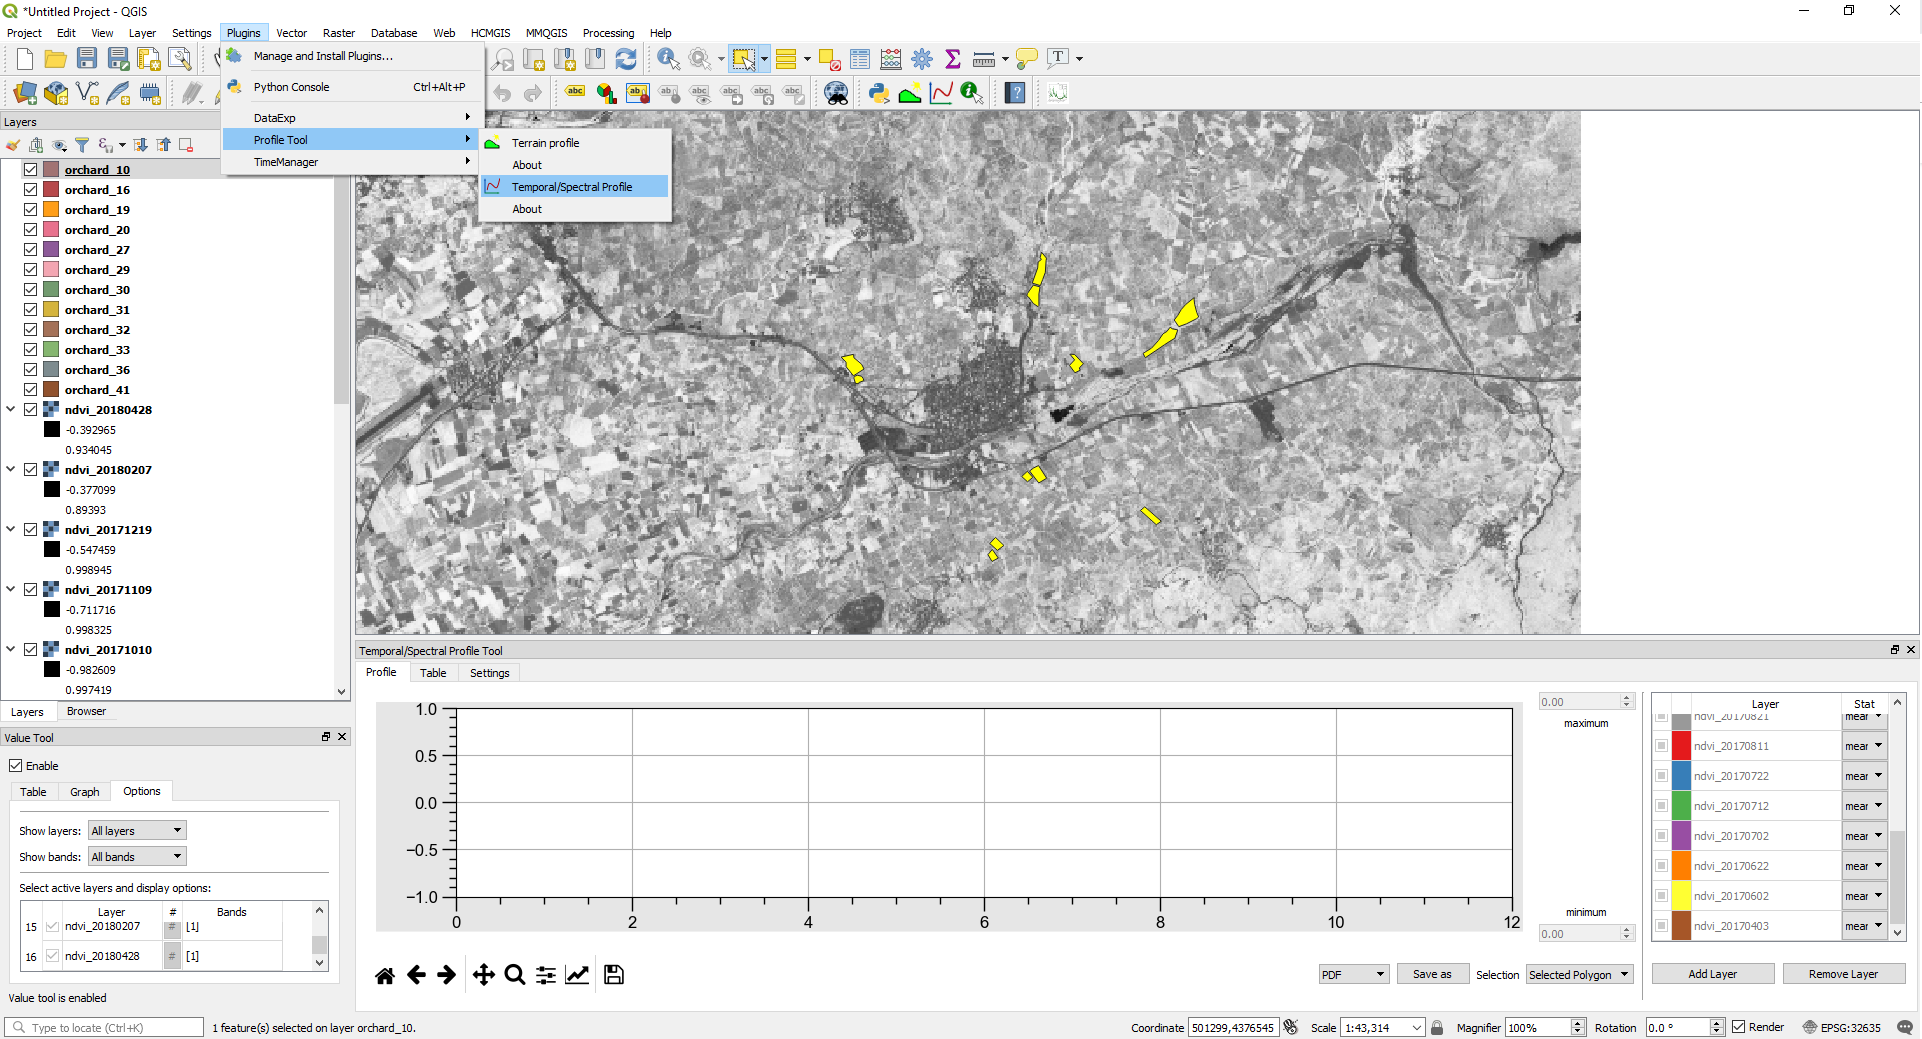
I tried in QGIS as below but It doesnt display the spectral profile.
1- I imported all NDVI images as raster layer and all shape files as vector layer
2- Then I added all NDVI images as spectral layers and selected alI vectors as polygons but It doesnt work.
the QGIS plugin seems to be a good solution (although I don’t know it). I think it is crucial that the data is formatted in a way that the plugin can attach a date to the mean values.
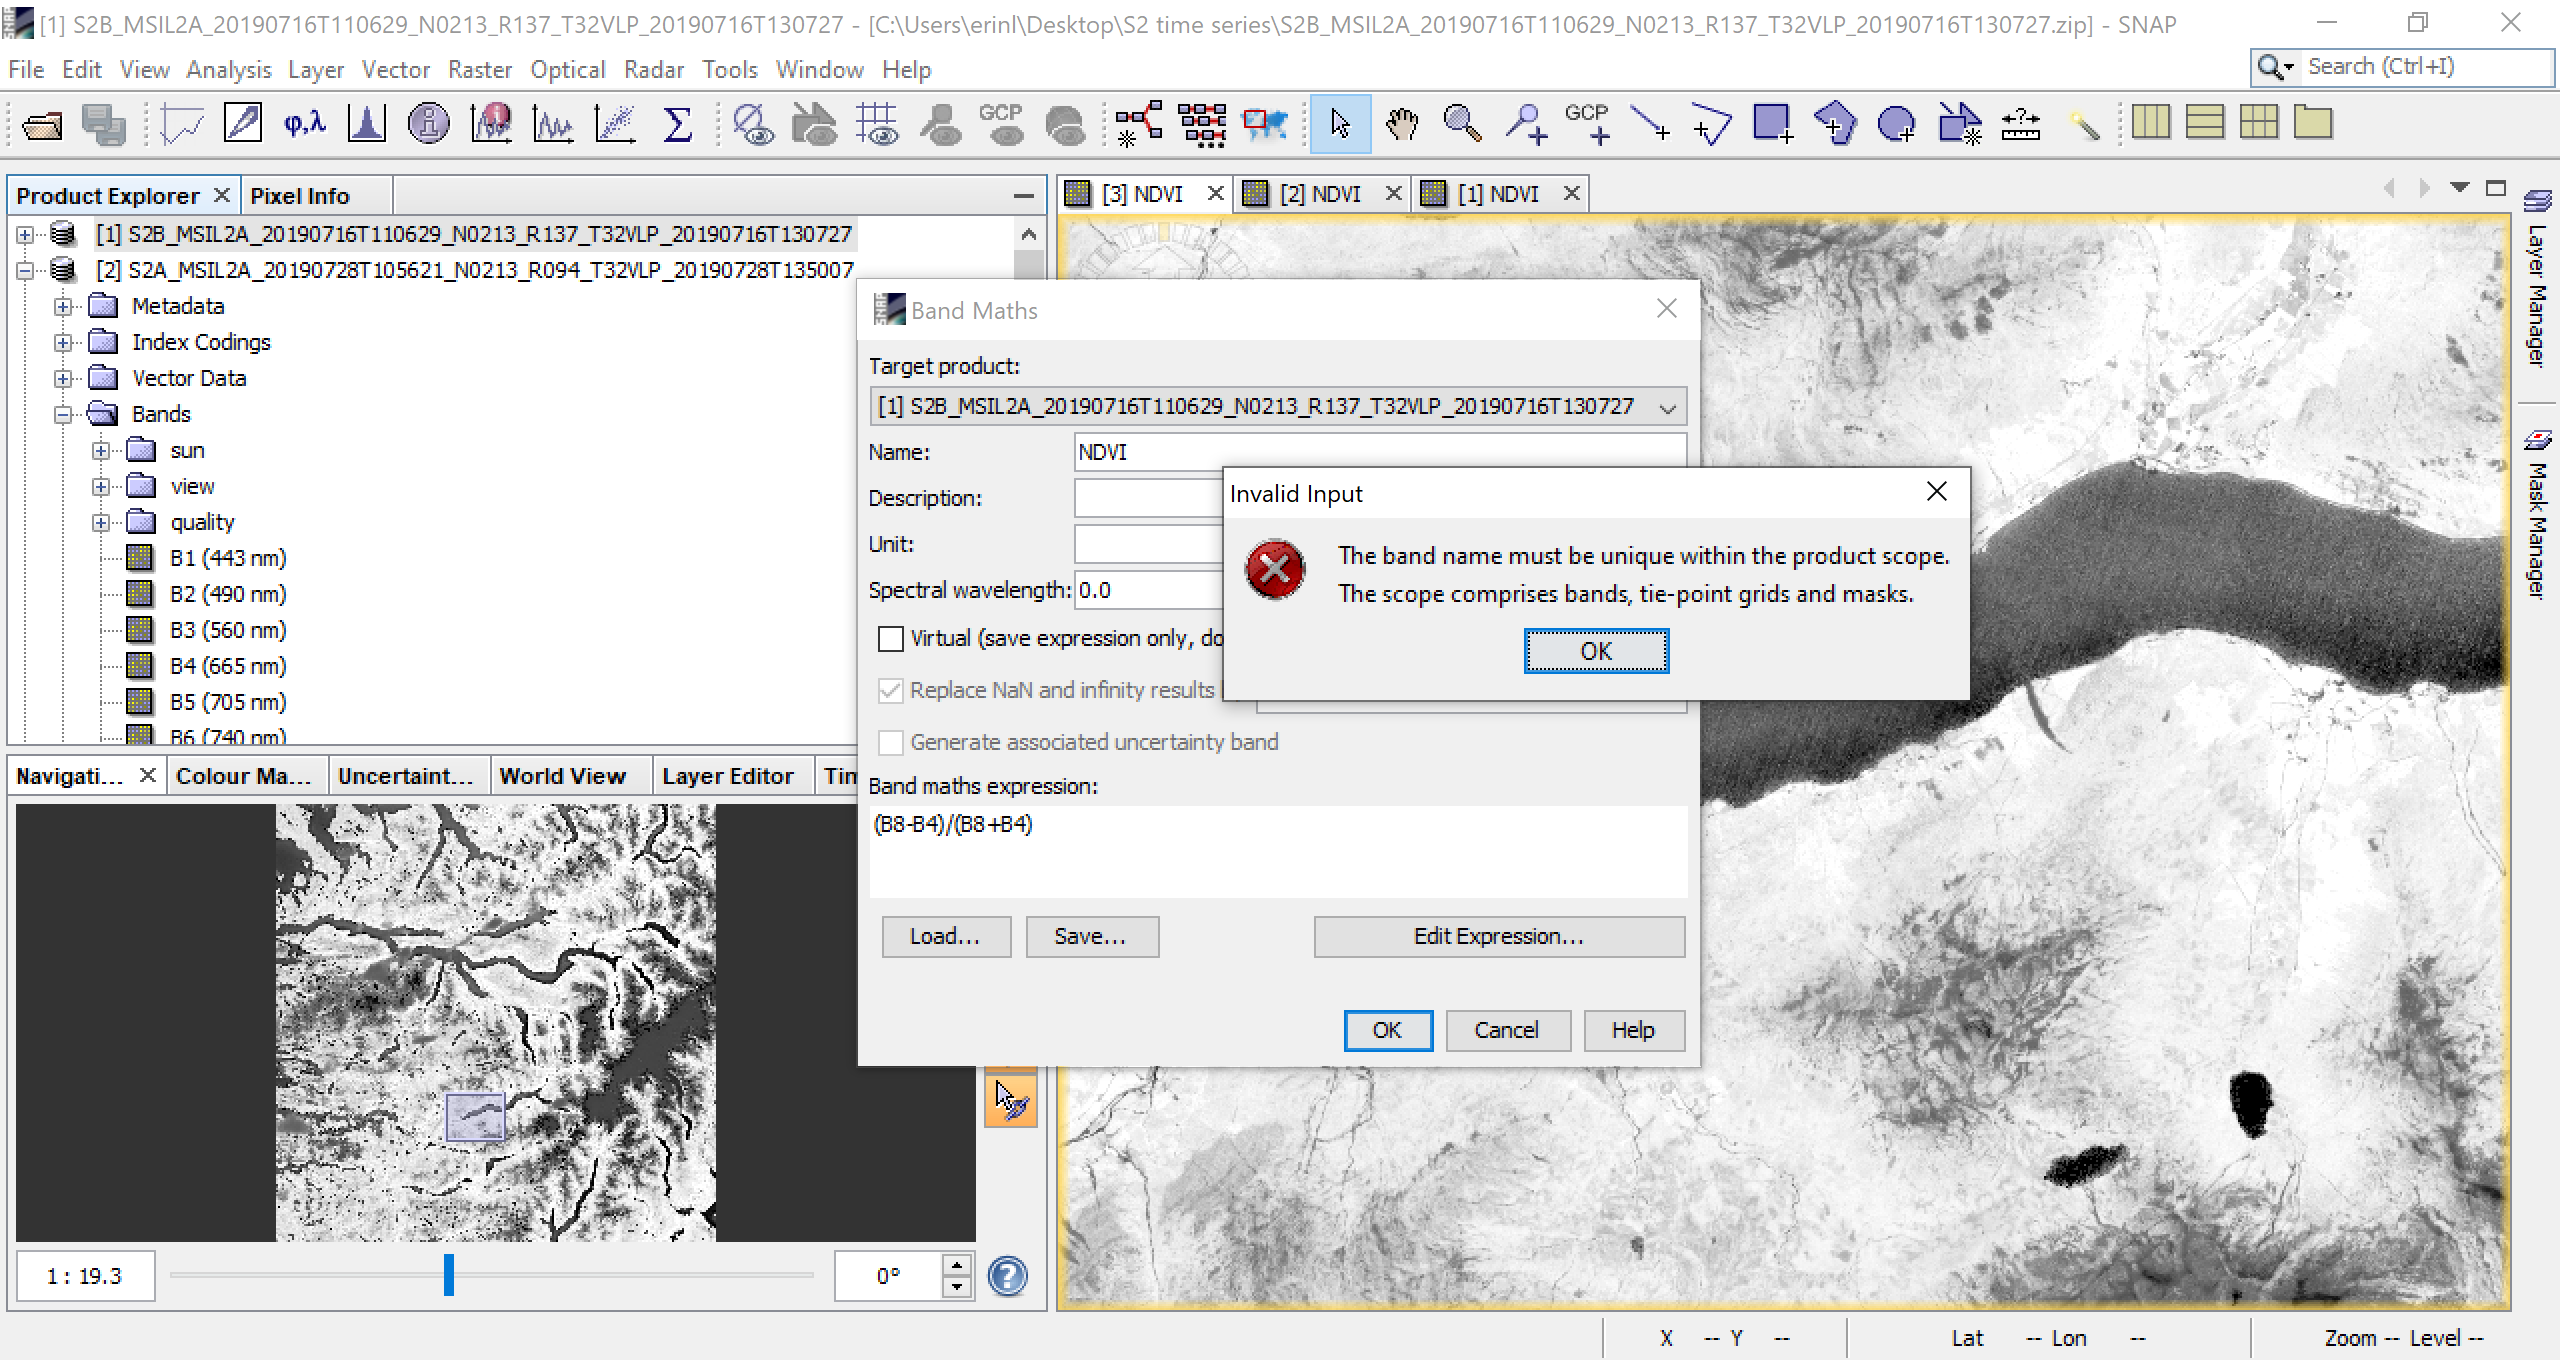
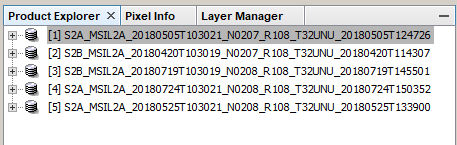
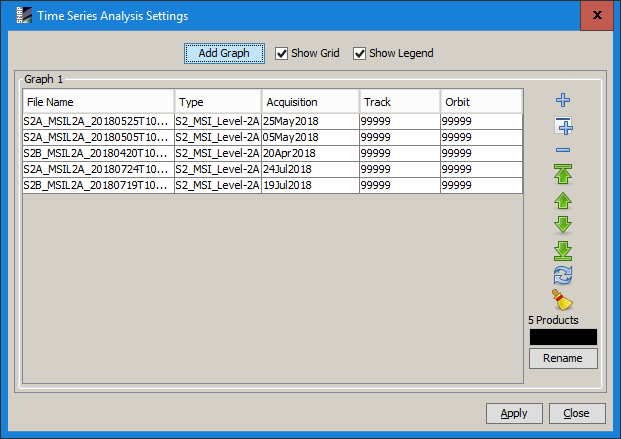
I have a problem to give the same name for all products.
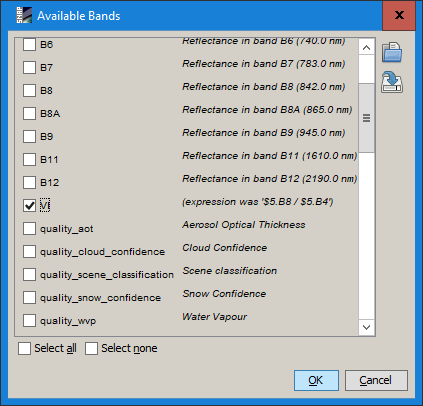
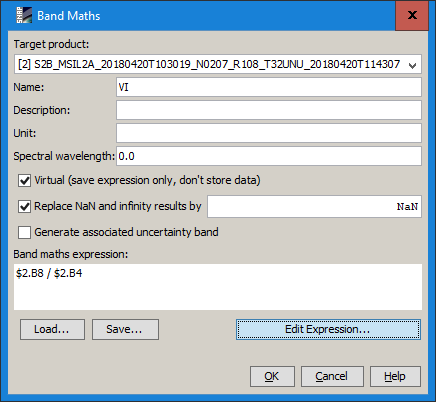
I downloaded all the products (a mix of S2A and S2B in the same area over 1 year). I opened them in SNAP. Right clicked on the product, in Product Explorer window > band maths. The first I could name ‘NDVI’ and create a new band (not virtual expression) using the NDVI calculation. However, it doesn’t work for subsequent products.
The error says: “The band name must be unique within all product scopes”.
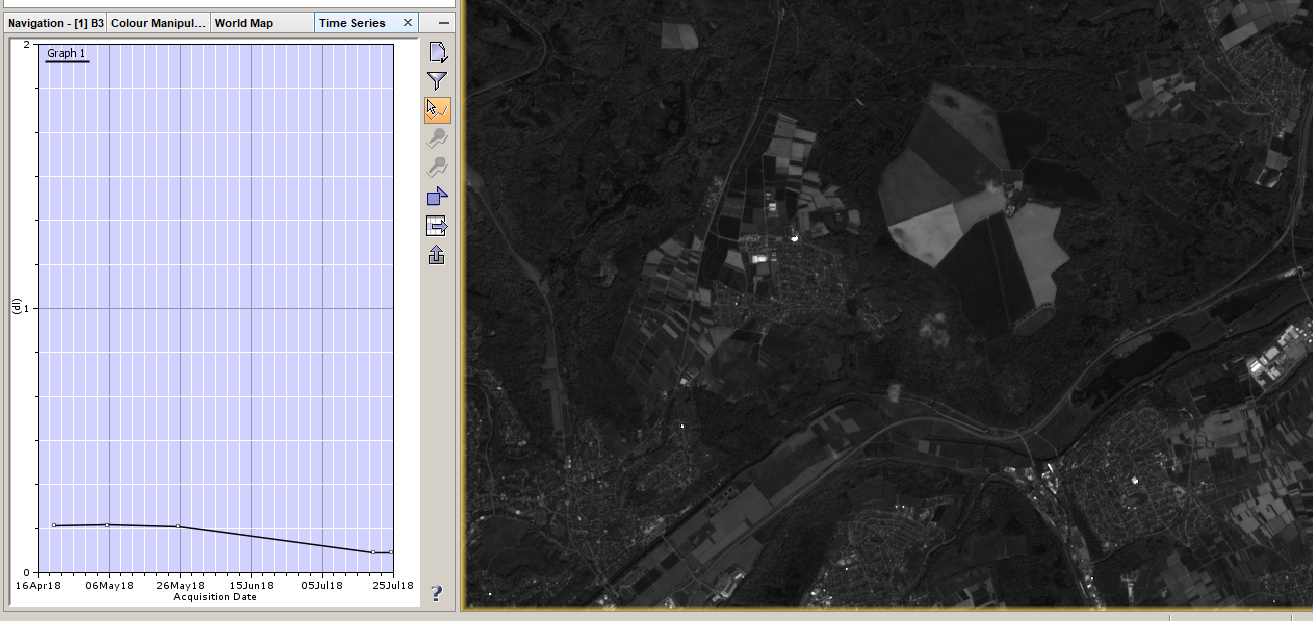
Are there some other pre-processing steps to do before using the band maths tool? Coregistration, making a spatial subset, or band subset, or collocation perhaps? My computer memory is also getting overloaded when I try to use the time-series tool.
So far I have the time series graph working for the cursor position with Band 8 and Band 4 separately, but not with them combined as an NDVI.

 ’
’