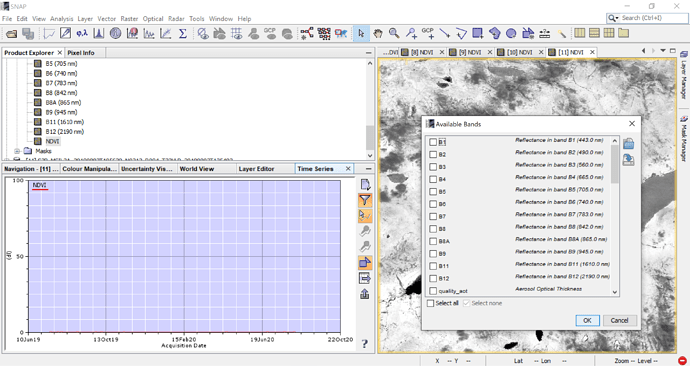
Each product (=each date) can have only one band called NDVI.
I got it working by resampling and then applying Band Maths on every product.
You then use all products as separate inputs for the time series tool.
I found my naming problem was due to that I still had virtual products of NDVI in the bands for each product. By deleting these products, I could use the raster calculator to make a non-virtual band, which I think avoids the need to resample.
Next problem: I removed then re-added all the products into the time series tool. However, when I try to filter the band and select NDVI, it is not an option.
I clicked on the load configuration option, is it possible to add an NDVI option that way?
Thanks again for your helpful responses.
Oh I missed step 7, to save all products into BEAM-DIMAP format.
Yes, after conversion File > Save Product is required to make the bands permanent.
Sorry for responding slowly, I’m not in the office at the moment
No problem, I am very glad for your responses whenever they come 
I saved a subset (spatial and band, only the new NDVI bands I created) as BEAM-DIMAP, and now I am able to get a time-series graph of NDVI when using the cursor 
 .
.
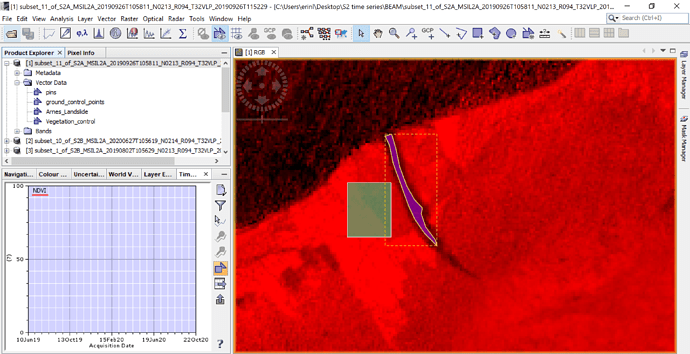
The problem now is to get it to work for an ROI. I added 2 vector data containers, for inside and outside of a landslide area, and made a polygon in each. I select one of the polygons, and click on ‘show averaged ROI’, but then nothing is showing in the graph. Is it because I made the vector data containers in only one product? Ideally I would like to compare the mean values within the 2 polygons on one time-series graph.
hard to tell, to be honest. Usually, having the ROI in one product is sufficient. I didn’t entirely understand why it works only sometimes.

