Good afternoon!
I’m trying to visualize conc_chl.img band on QGIS. I don’t know why my data keep getting displayed in such a way:
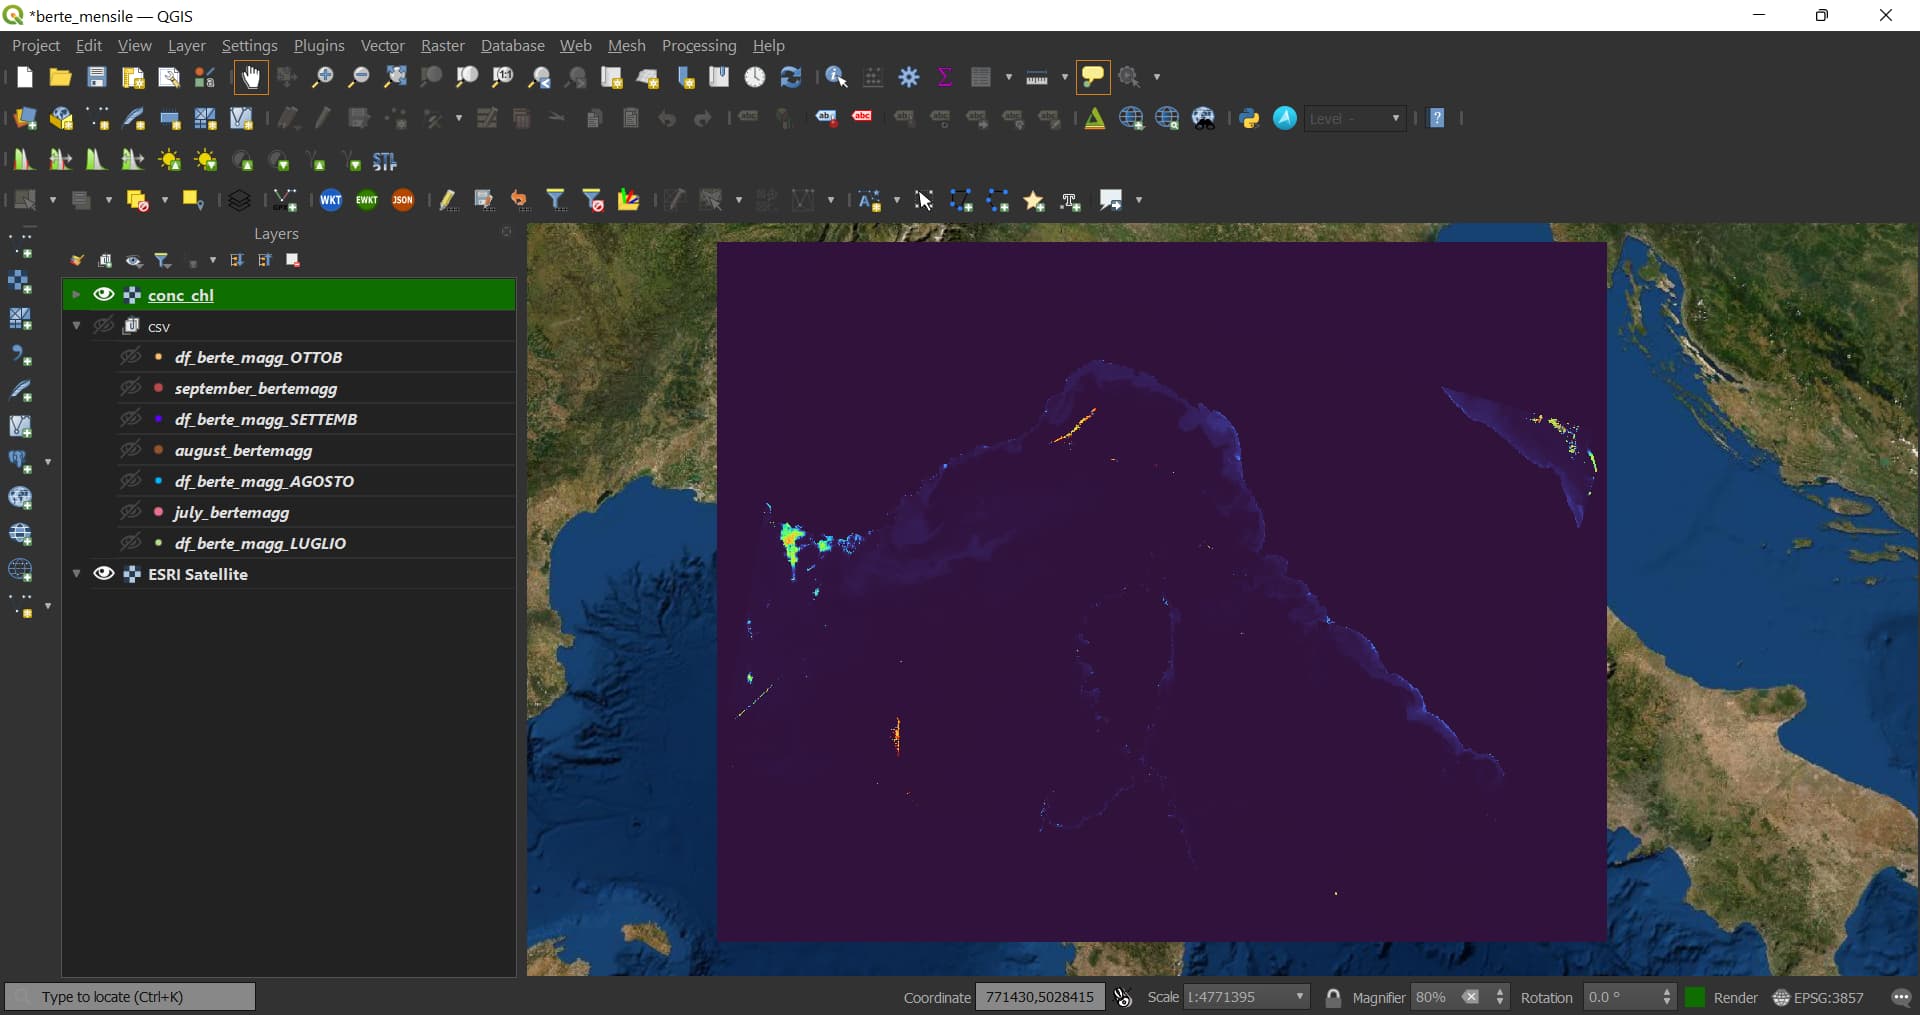
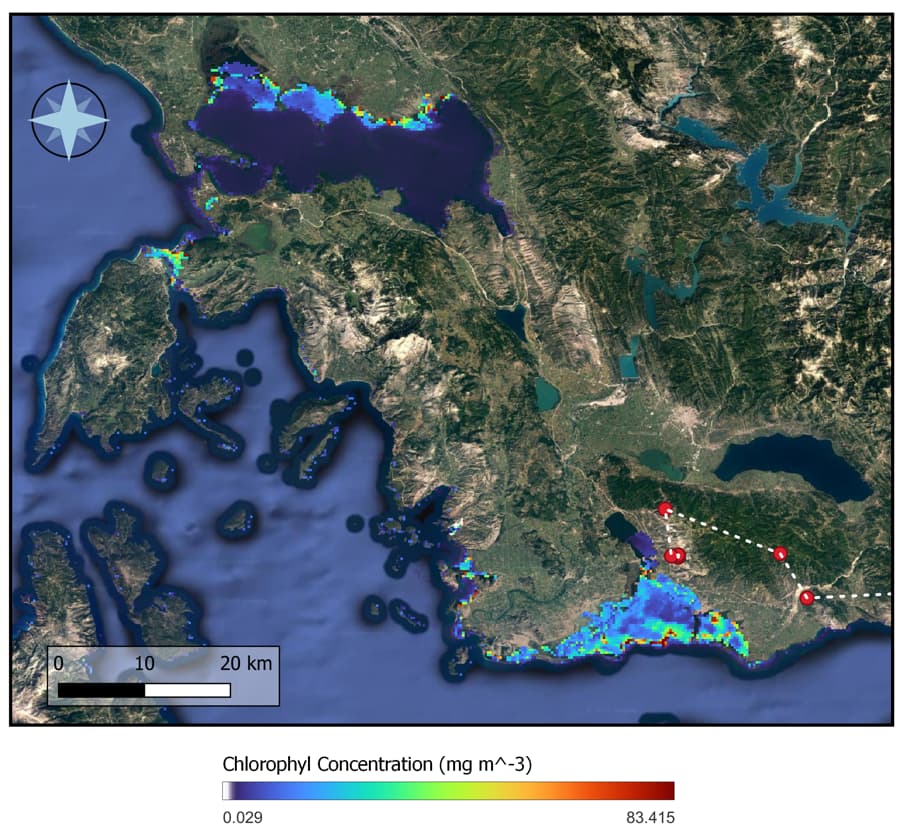
How is it possible to get data visualized this way?:
Thank you so much for your patience!
Bye!
Good afternoon!
I’m trying to visualize conc_chl.img band on QGIS. I don’t know why my data keep getting displayed in such a way:
How is it possible to get data visualized this way?:
Thank you so much for your patience!
Bye!
Hi
Questions on how to use QGIS are better asked in a QGIS forum.
This is a forum for SNAP and the toolboxes.