Hi everyone,
I’m using gpt in SNAP 13.0.0 (on Archlinux) to process S3A OLCI L1 data.
For my application, I need the OAA angle. As opposed to other angles, OAA has a sharp boundary on both sides of OZA=0, with strongly negative values and strongly positive pixels being in direct contact. This is very well visible in the OAA variable of tie_geometries.nc, as expected.
When I reproject to e.g. EPSG:3413, this sharp boundary becomes a smooth, gradual and continuous transition from the strongly negative to the strongly positive value, across a ~11km strip. This occurs even with nearest-neighbor resampling within the Reproject operator.
I suspect that it’s linked to the very coarse native across-track resolution of angles in tie_geometries.nc, which gets mapped to sensor resolution throughout the graph (and is not problematic for the three other angles that are smoothly evolving). Do you know if there’s a way for me to control this upsampling step and force it a nearest-neighbor, too? I’ve checked the detailed list of parameters of Read and Reproject operators, but couldn’t find one that could help me in this direction.
Another explanation could be the reprojection that by definition creates this smooth transition, but I feel like the sharp boundary should be conserved independently of the projection…
Thank you a lot in advance for your help!
Here is a very simple graph to reproduce the pattern I’m describing:
<graph id="S3">
  <version>1.0</version>

  <node id="Read_OLCI">
    <operator>Read</operator>
    <parameters>
      <file>${OLCIsource}/xfdumanifest.xml</file>
    </parameters>
  </node>

  <node id="Reproject_OLCI">
    <operator>Reproject</operator>
    <sources><source>Read_OLCI</source></sources>
    <parameters>
      <crs>EPSG:3413</crs>
      <resampling>Nearest</resampling>
      <includeTiePointGrids>true</includeTiePointGrids>
      <noDataValue>NaN</noDataValue>
    </parameters>
  </node>

  <node id="Subset_OAA">
    <operator>Subset</operator>
    <sources><source>Reproject_OLCI</source></sources>
    <parameters><sourceBands>OAA</sourceBands>
    <copyMetadata>false</copyMetadata>
    </parameters>
  </node>

  <node id="Write_OAA">
    <operator>Write</operator>
    <sources><sourceProduct>Subset_OAA</sourceProduct></sources>
    <parameters><file>${targetFolder}/OAA_x.tif</file><formatName>GeoTIFF</formatName></parameters>
  </node>

</graph>
Hi
The interpolation of the borderline happens already when reading the S3 tie-points grids. They are automatically interpolated.
A possible solution to your problem is to use the NetCDF file. As NetCDF the data are not treated as tie-points. Resample the NetCDF data to the width of the S3 product and then copy the OAA band to the original data using BandMaths. Then you can reproject the result.
You need to resample the data with gpt, because in the GUI the aspect ratio is always maintained.
You can add the resampling and the BandMaths operation to your graph.
This was my gpt call:
gpt resample -PtargetWidth=4865 -PtargetHeight=4091 -Pupsampling=Nearest -t “D:\EOData_temp\S3B_OL_1_EFR____20230717T104859_tie_geometrie-resampled.dim” “D:\EOData\S3\OLCI\S3B_OL_1_EFR____20230717T104859_20230717T105159_20230717T232729_0180_081_379_2160_PS2_O_NT_003.SEN3\tie_geometries.nc”
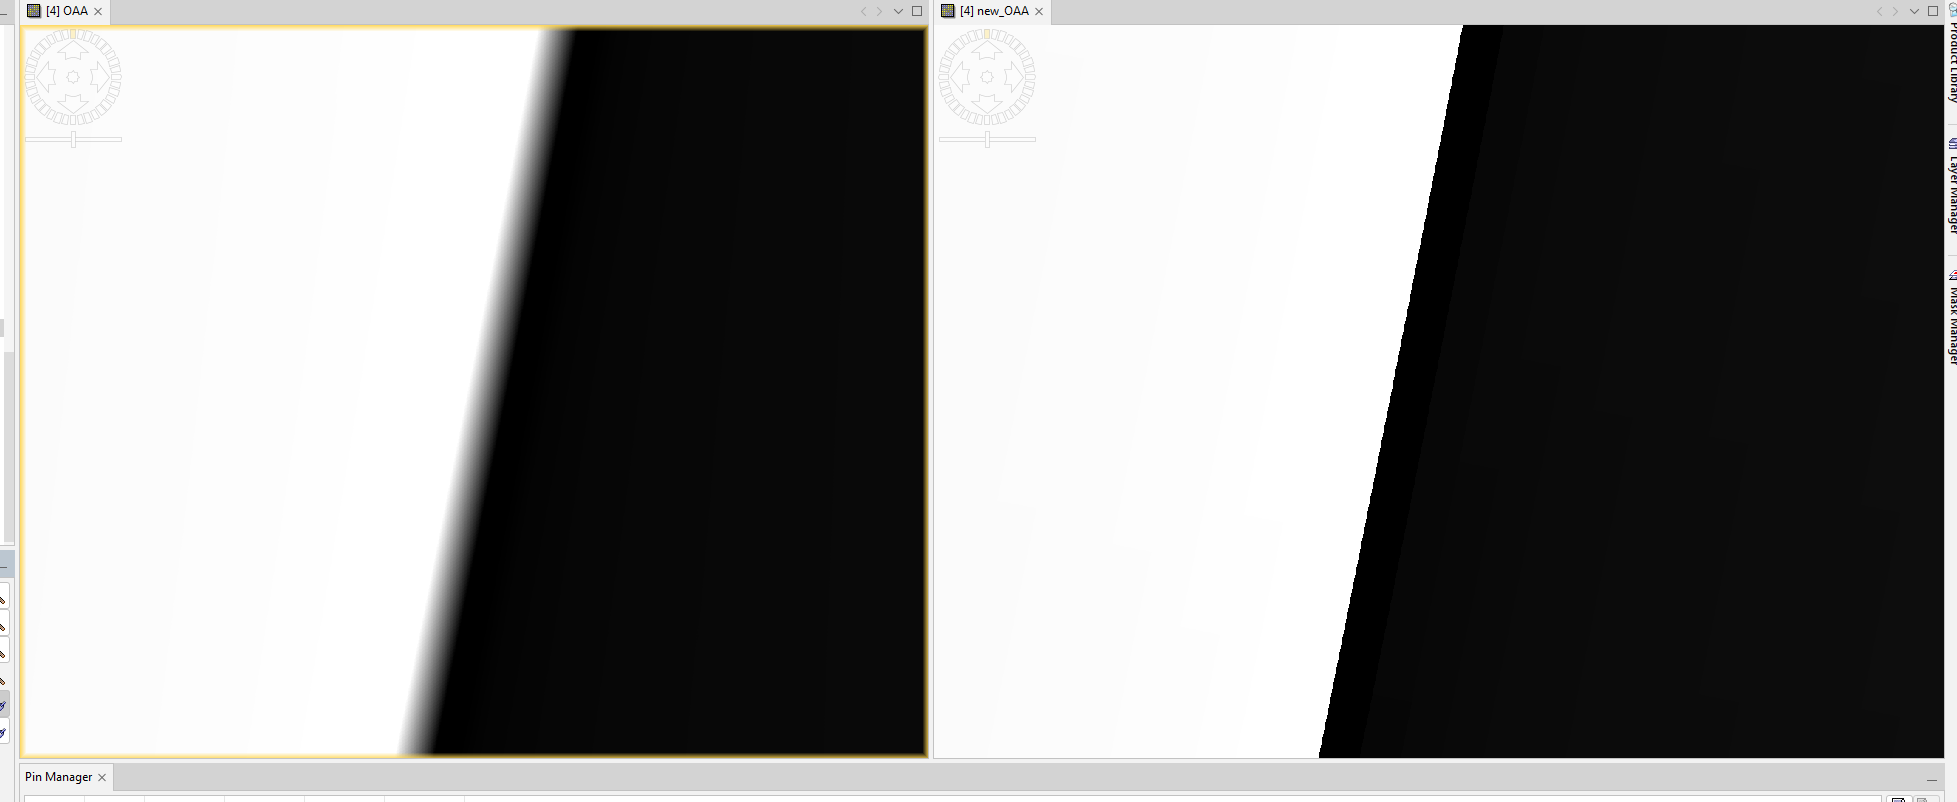
This is my result for a sample scene.
Left the original tie-point grid and on the right the separately resampled data.
 Marco from EOMasters - Mastering Earth Observation
Hi Marco! Thanks a lot for your help.
To complete the discussion for other users: I managed to gpt resample to get to the same resampled OAA with the expected sharp boundary as you’ve shown with your screenshot. Then I used the following graph:
<graph id="S3_OAA_Fix">
  <version>1.0</version>

  <node id="Read_OLCI">
    <operator>Read</operator>
    <parameters>
      <file>${OLCIsource}/xfdumanifest.xml</file>
    </parameters>
  </node>

  <node id="Read_TieGeom">
    <operator>Read</operator>
    <parameters>
      <file>${OLCIsource}/SNAP/tie_geometries_resampled.dim</file>
    </parameters>
  </node>

  <node id="BandMaths_OAA">
    <operator>BandMaths</operator>
    <sources>
      <sourceProduct1 refid="Read_OLCI"/>
      <sourceProduct2 refid="Read_TieGeom"/>
    </sources>
    <parameters>
      <targetBands>
        <targetBand>
          <name>OAA_fixed</name>
          <type>float32</type>
          <expression>$sourceProduct2.OAA</expression>
        </targetBand>
      </targetBands>
    </parameters>
  </node>

  <node id="Reproject_OLCI">
    <operator>Reproject</operator>
    <sources>
      <source>BandMaths_OAA</source>
    </sources>
    <parameters>
      <crs>EPSG:3413</crs>
      <resampling>Nearest</resampling>
      <includeTiePointGrids>false</includeTiePointGrids>
      <noDataValue>NaN</noDataValue>
    </parameters>
  </node>

  <node id="Subset_OAA">
    <operator>Subset</operator>
    <sources>
      <source>Reproject_OLCI</source>
    </sources>
    <parameters>
      <sourceBands>OAA_fixed</sourceBands>
      <copyMetadata>false</copyMetadata>
    </parameters>
  </node>

  <node id="Write_OAA">
    <operator>Write</operator>
    <sources>
      <sourceProduct>Subset_OAA</sourceProduct>
    </sources>
    <parameters>
      <file>${targetFolder}/OAA_x.tif</file>
      <formatName>GeoTIFF</formatName>
    </parameters>
  </node>
</graph>