I’m trying to compute a profile plot on sea surface temperature on snap wtih the sentinel 3a data.
Here is the complete name of the file I downloaded:
S3A_SL_2_WST____20201120T205457_20201120T223557_20201122T084552_6059_065_185______MAR_O_NT_003.SEN3
I’ve drawn a line but when I want to select if in the profile plot window using ROI mask or mask manager I can’t select the mask thus I can’t obtain a profile plot.
The line is a “geometry”. There is a show/hide geometry button. Just select the geometry and profile plot should use it, but sometimes a geometry drawn by hand has glitches that seem to confuse the profile plot and you won’t get a profile plot. The ROI button is used to mask part of the geometry, it does not select the “transect” (in your case, the “line”) geometry.
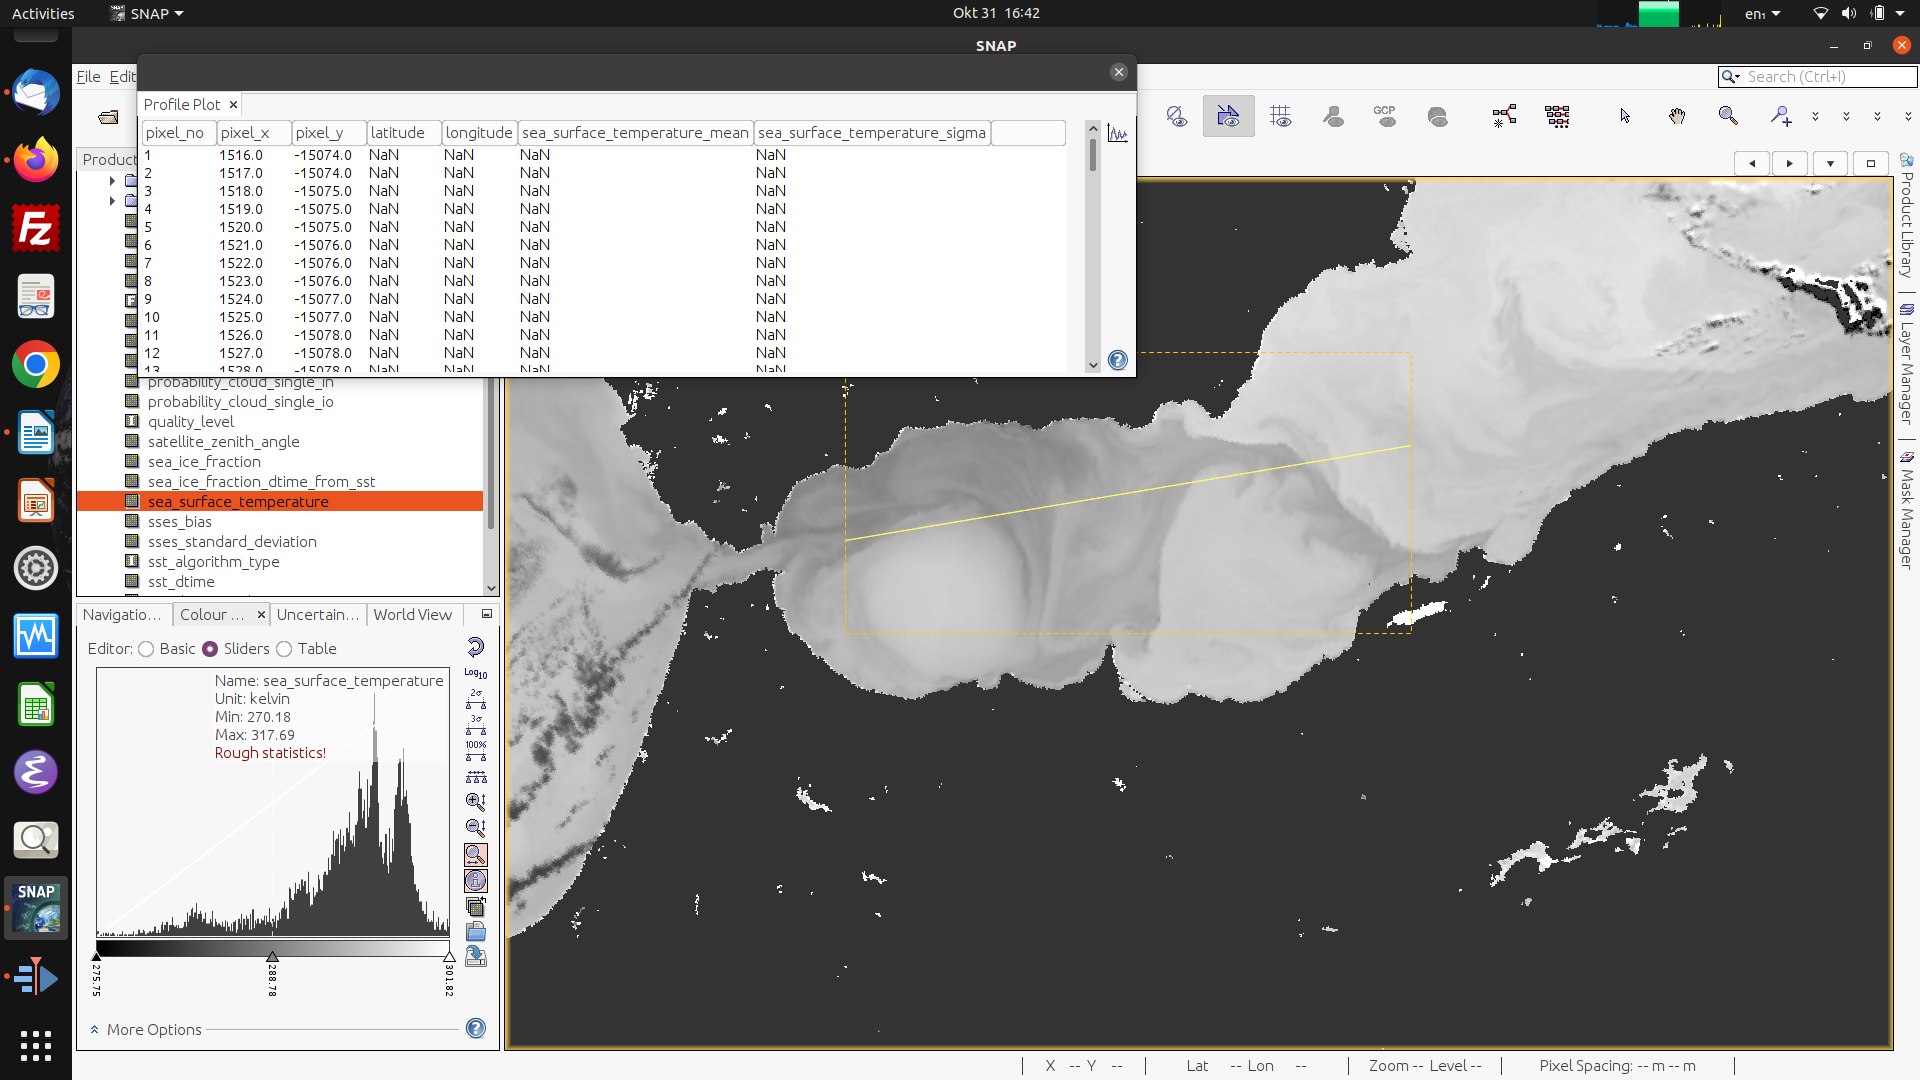
I am experiencing the same problem mentioned above: when trying to visualize a profile plot from a line draw in a Sentinel-3 sea surface temperature image, the profile plot remains empty, the table look shows all NaN for the line transect (see image). I have tried selecting ROI mask (geometry), but nothing appears. The profile plot with an Ocean colour image does work, but not for temperature (i.e. repeating the same procedure). I am using Snap version 9 on a Ubuntu machine, but some of my students (with various laptop configurations, Windows & Mac) have the same issue. Any hint would be appreciated!