I am trying to use sentinel toolbox to look the profile of a SAR data.
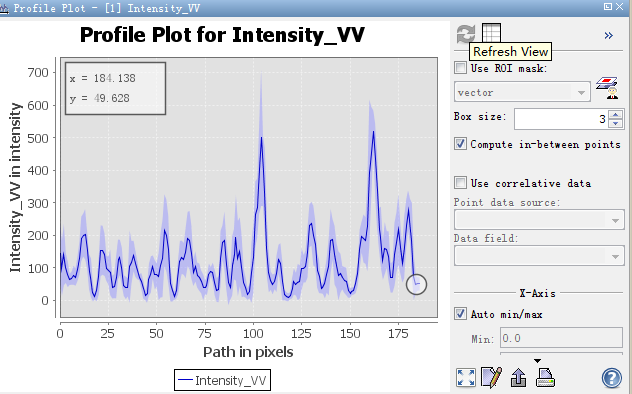
So I use the Line Drawing Tool to make a Line, and go to Analysis > Profile Plot. Then I get the following plot, and I am wondering if the x-axis represent the number of pixels ?
Because I also want to plot the similar profile in matlab by myself, I am wondering what kind of smoothing method is used in the tool? How can I get the similar smoothing results ?
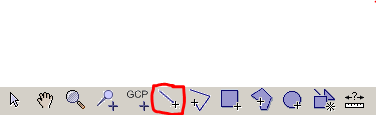
There is a small question: Where is the Line draw Tools?
I searched for the ‘Draw Line’ operator in the SNAP7.0 search box, and clicked on it. After that, there was nothing, did I miss something? Thank you in advance.
 Is it a low pass filter?