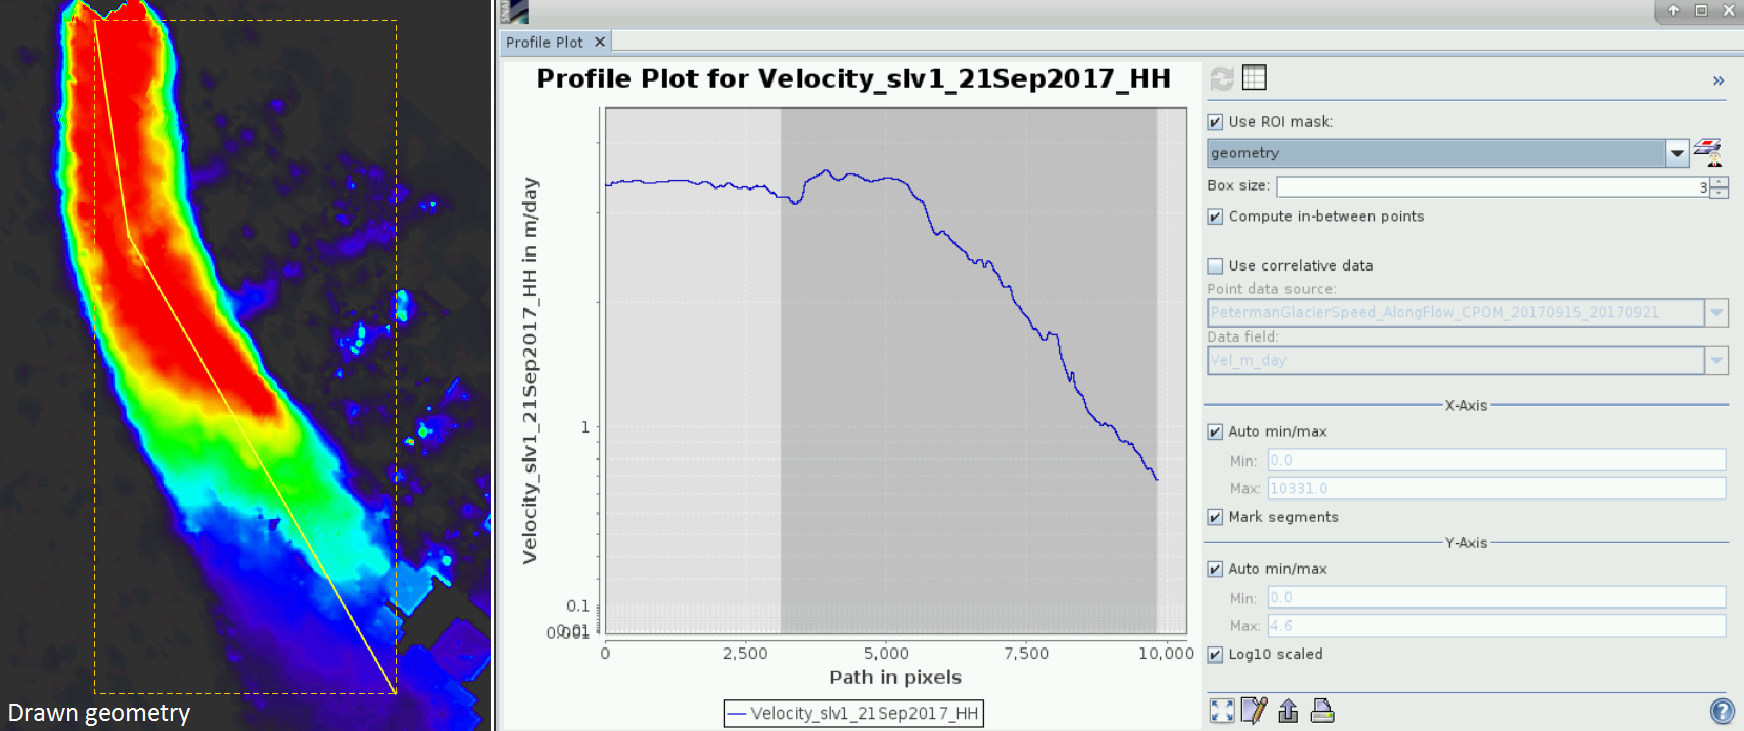
Hi, I am trying to visualize the Profile plot with external correlative data. However, I can’t seem to manage to get anything reasonable. If I draw the geometry manually the profile makes sense.
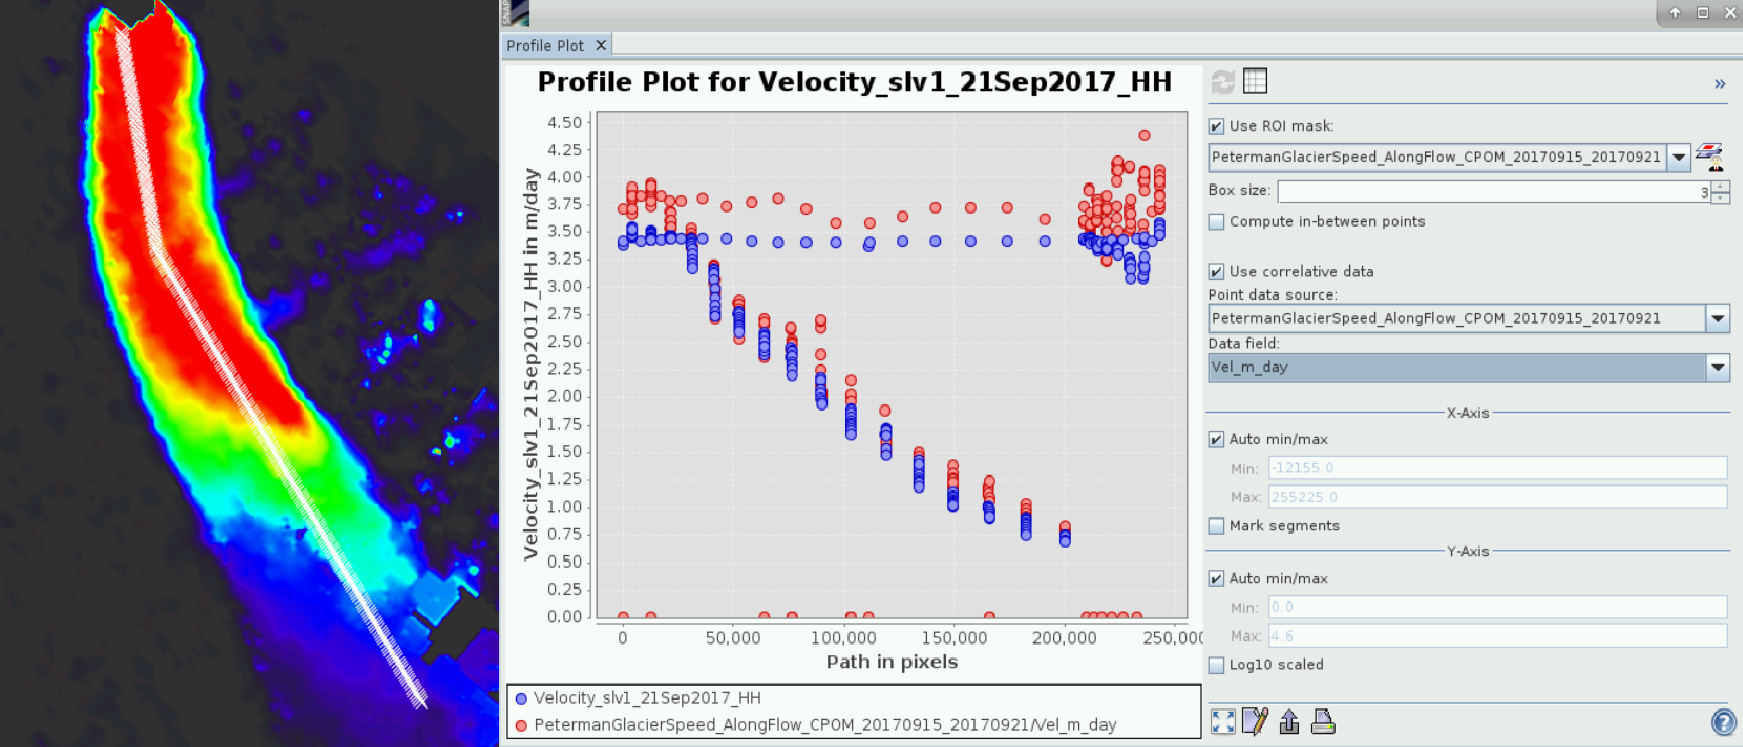
If I try import a vector point layer and use it as a a correlative layer (also as the ROI mask I suppose), the x (Path in pixels) values do not seem to make sense. The input vector includes Lat/Lon columns.
what is the information stored in your vector point layer? I mean the information you want to correlate with your velocities.
Very nice results by the way! May I ask which satellite was used?
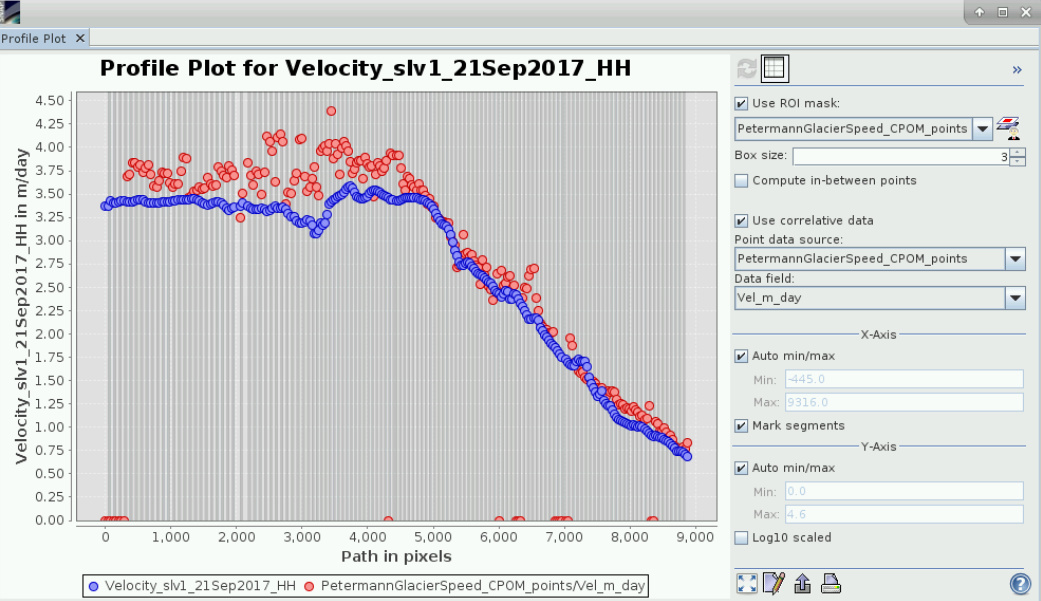
I used Sentinel-1 IW GRDH products. The data contains the points along the transect with velocities from an external source. I would like to plot them along the profile and compare them with the values from the underlying band, however it seems that the path in pixels is plotted along the lines, which does not seem very convenient. I cant seem to find a way how tot fix it, though.
Ah sorry I wasn’t clear, I want to use the Profile plot with correlative data option. The Correlative data plot works fine from me as well. I have finally managed to solve the issue, though, by importing my external data from CSV file (instead of SHP) and setting them as track points (interpret each point as track point). And finally I get what I wanted .
 .
.