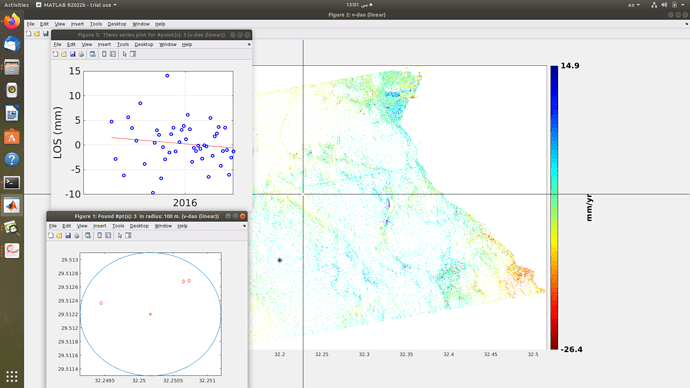
The annual displacement plot is noisy
Edit*
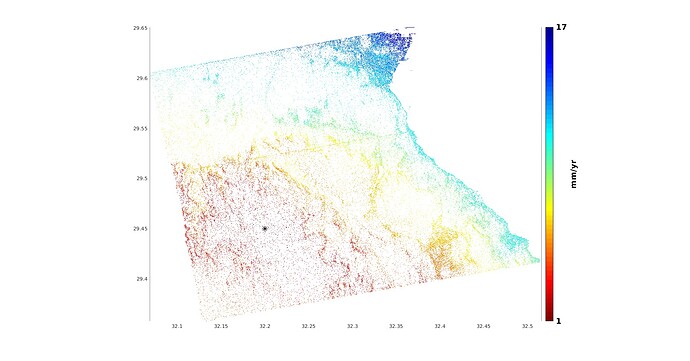
And this is the MLV standard deviation from a previously selected reference and but I cannot quite understand the result. The area covered by red ps points is relatively high and there’s a cliff located at the transition from red to yellow points northwards, while the white region due east is just a huge water body
Could that be because I used the old get_modis.py script while configuring the APS_CONFIG.sh file in TRAIN, therefore the atmospheric correction is undependable? I used the most basic linear method for aps removal even though the study area isn’t flat, nor is it dominated by urban settings. And yes, unfortunately the distribution pattern of PS points seems to conform to the topography even though I have applied topographic phase removed during the automated pre-stamps processing

