Hello All,
I am little confused with the interpretation of the mean velocity results of stamps PS.
So far my understanding of displacement results says towards/uplift (positive) and away/subsidence (negative)
Ps_plot description also says:
My doubt is, In case of PS where we have master image which fits in the middle of the timeline of multiple images, so there are slave images which are acquired before master and after master, in that case how’s the final (mean displacement/velocity) map is formed, does it still follows the criteria (+ve and -ve signs on velocity map) mentioned in the ps_plot.
Secondly, Does ascending or descending pass effects this +ve/-ve signs.
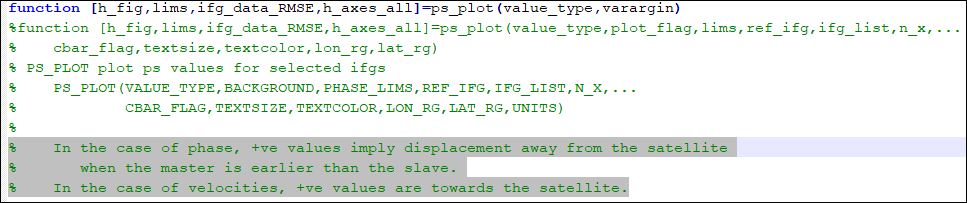
“Normal phase sign conventions apply: if the master predates the slave, positive phase implies
movement away from the satellite”
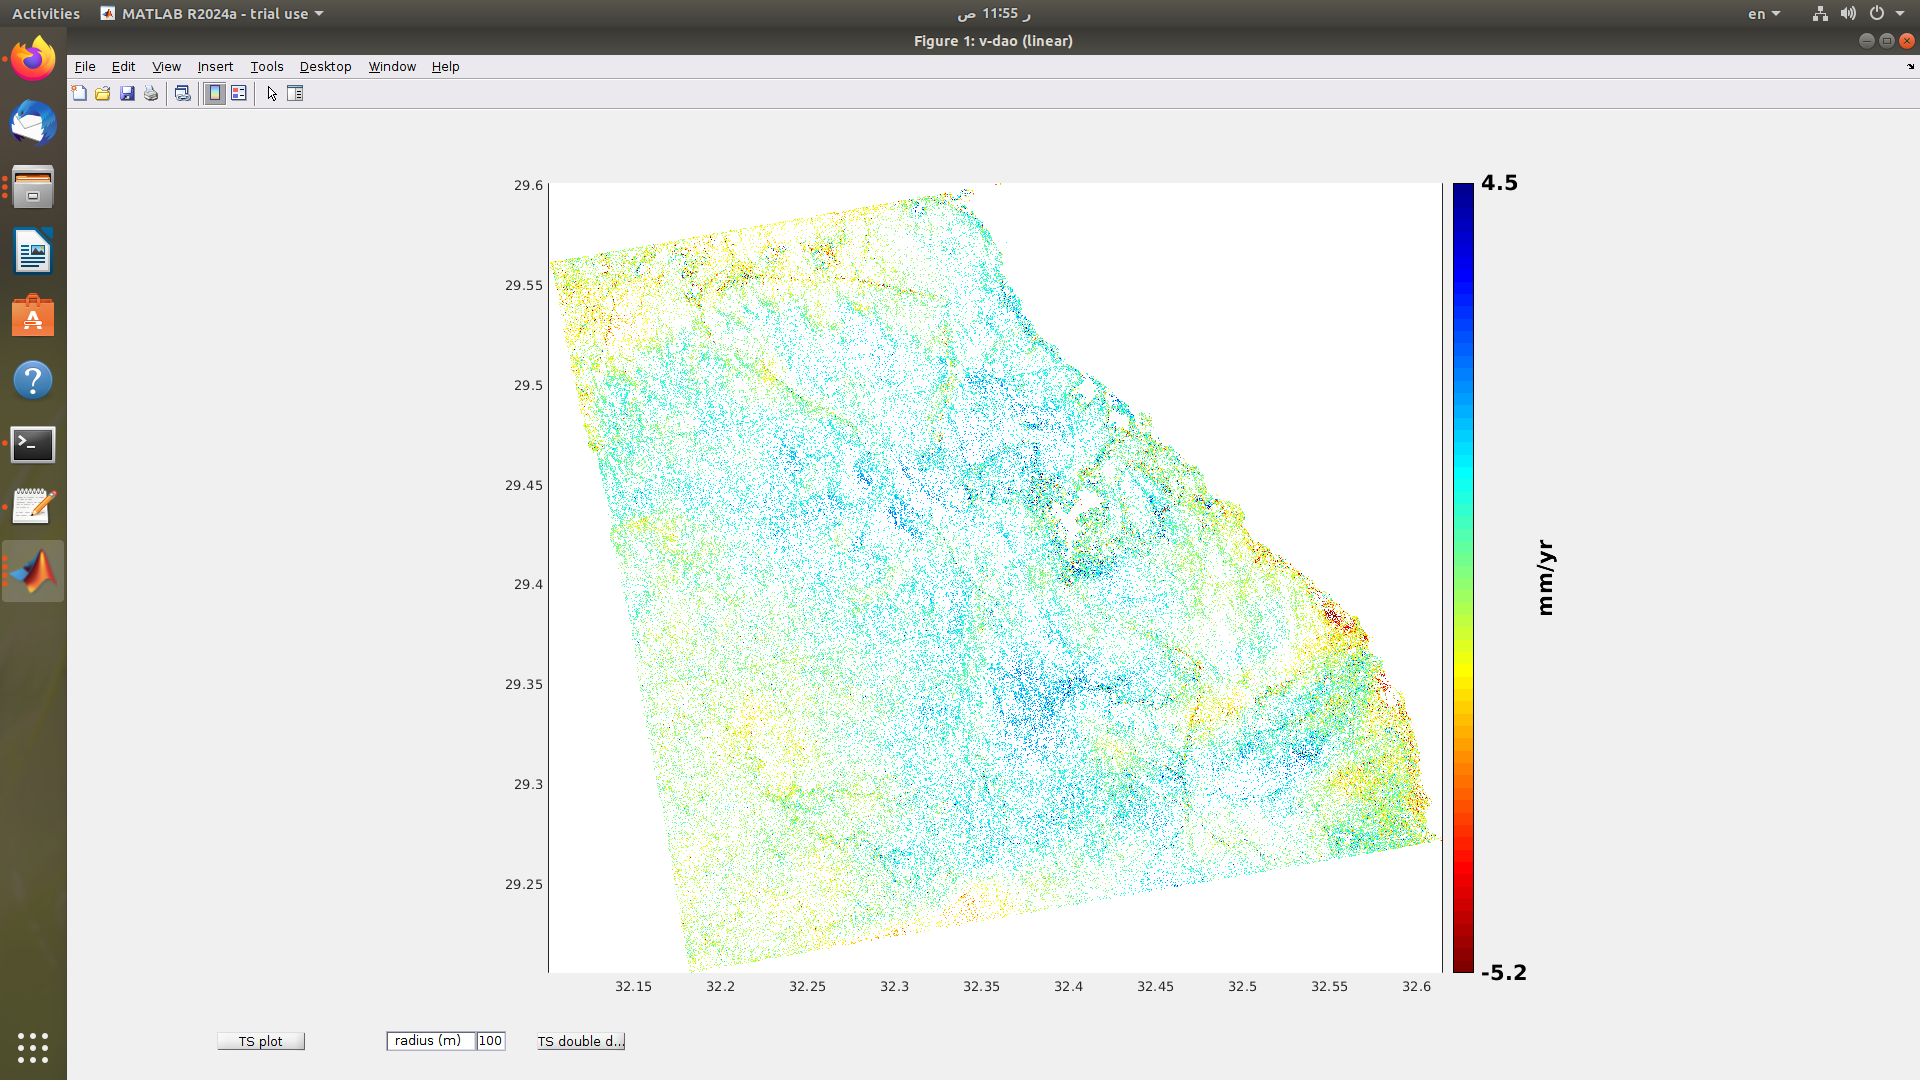
what about the velocity sign in the figure produced from
ps_plot(‘v-do’)
which is extracted from a time series where the master image predates almost half of thhe slave images and postdates the other half of the slaves. how will we interpret the velocity sign?
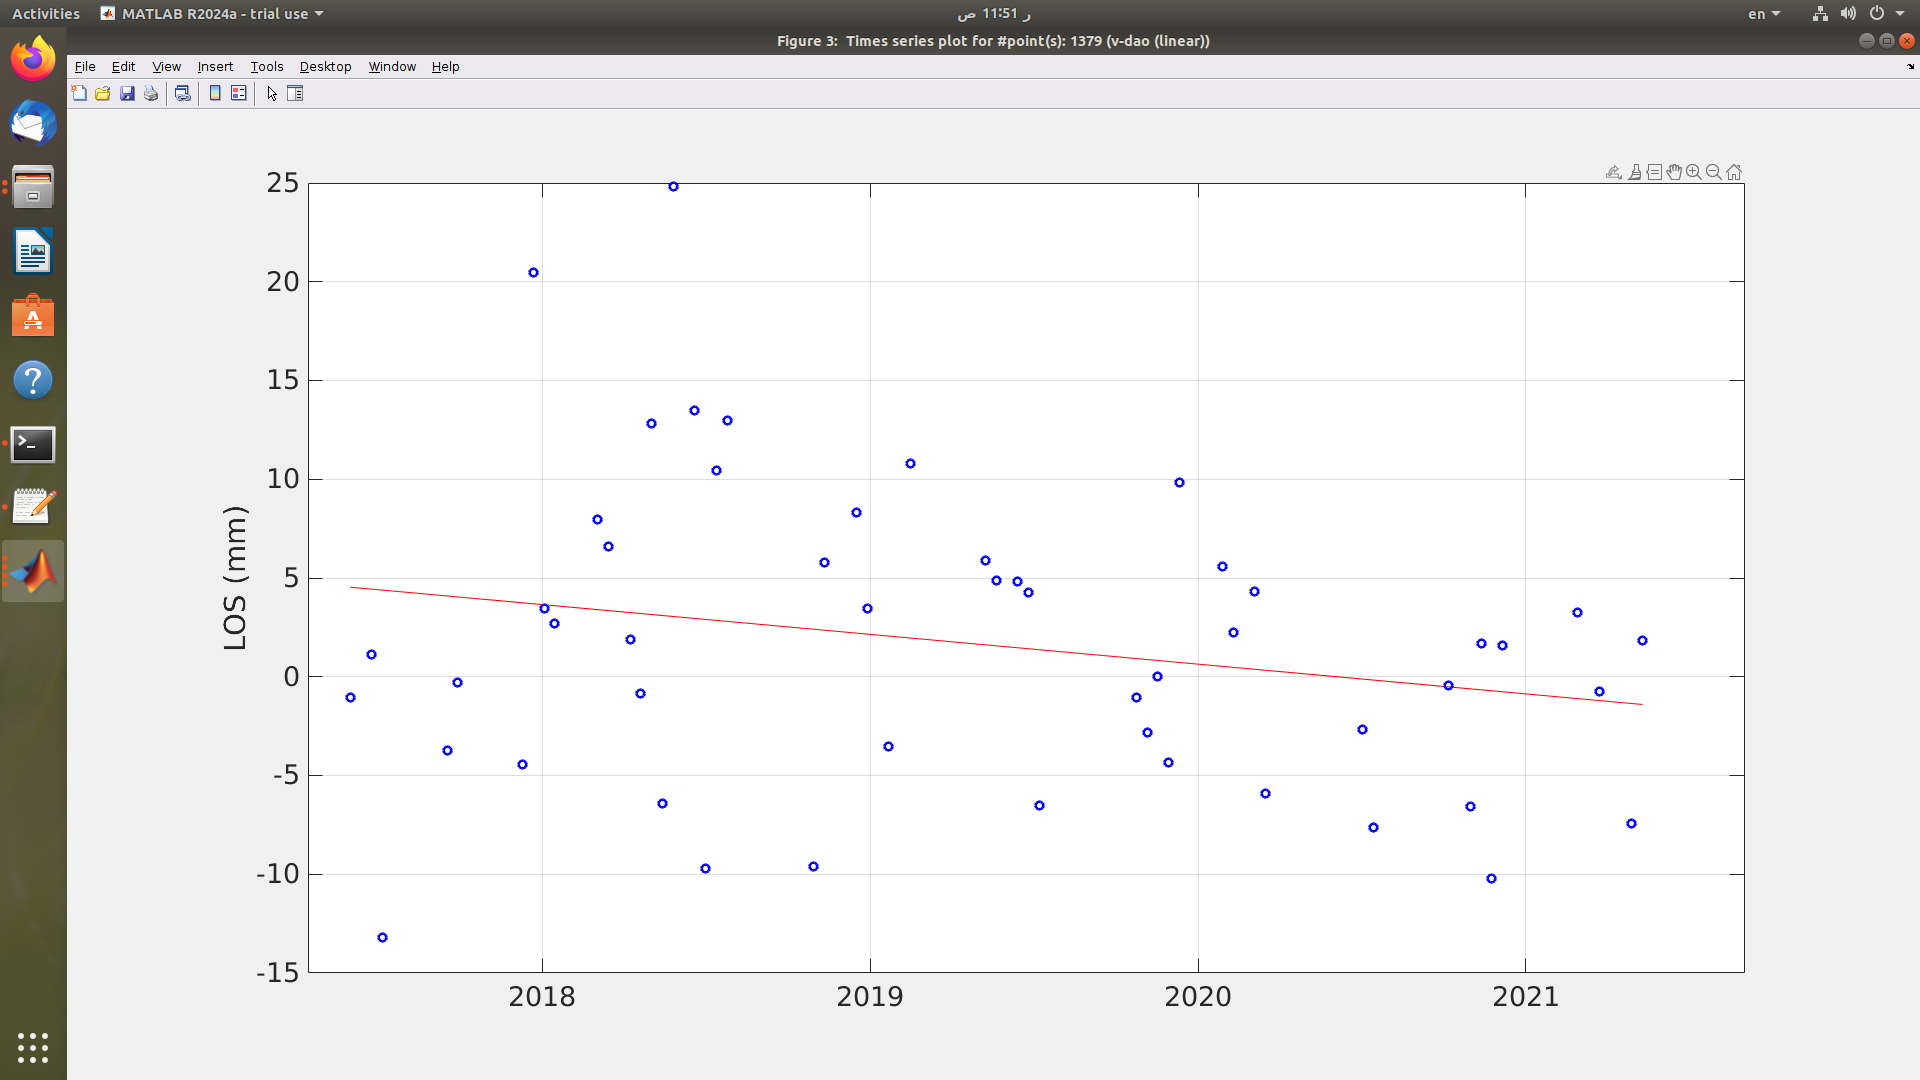
Is it possible to create a quick script to plot a number of displacement profiles and scatter plots from the figure resulted from
ps_plot(‘v-do’, ‘ts’) for multiple points with precise predefined lon/lat coordinates instead of hovering the mouse over the figure to select an position for each gs plot individually?
what about the sign of the LOS displacement velocity values and the displacement profile from a time series where the master predates approximately half of the slave images and postdates the other half
regarding the master predominating or not is taken care within the DInSAR generation and later during the StaMPS processing
Negative values indicate moving away from satellite in the LOS and positive values moving towards the satellite. Not saying subsiding or uplifting as for that I recommend you to process also the descending orbit if possible to decompose.
Time series values (above plot) have the 0 in the master image, but there is an option on the ps_plot to make that the 0 values start on the first image and not the master one (please check the matlab function manual). But again, negative means moving away from satellite LOS and positive moving towards the satellite in LOS.